
Home / Top 25 EXCEL SKILLS – All Levels (Basic | Intermediate | Advanced) + Test
Check Top 10 Excel Skills out of the Top 25
These days no matter on which profile you are working, from accountant to data analyst, HR to product manager, having Excel skills have huge benefits.
When we talk about Excel skills, we can further categorize them in 3 levels:
- Basic Excel Skills
- Intermediate Excel Skills
- Advanced Excel Skills
And in this tutorial, we will be covering all these three levels in detail, one by one, so let’s get started.
Below you have the top ten basic Excel skills to learn by anyone who is just starting out with Excel needs to learn.
1. Saving and Opening a Workbook
Saving and opening an Excel workbook is just like as you do in any other application.

When you click on the file tab it shows you the option to save the file.

And when you click on the save button it opens the save as dialog box from where you can specify the location and you can also select the file format to use.

Basically, Excel has different file extensions that you can use for saving a workbook. You can use the above steps if you are saving a file for the first time and if you have a file that is already saved in the system, you just need to press Control + S to save the changes.
In the same way, if you want to open a file that is saved on your system you can go to the FILE tab and click on the open.

It shows you the open dialog box from where you can locate the file and open it.
2. Managing Worksheets
Every workbook consists of worksheets where you can add your data and analyze it and once you open an Excel workbook you can see there are tabs at the bottom of the window.

To insert a new worksheet simply click on the plus button or you can also use the shortcut key Shift + F11.

And if you want to delete a worksheet just right-click on the worksheet tab and then select the delete option or you can also use the shortcut key Alt ➜ H ➜ D ➜ S.

But there’s one thing that you need to take care that once you delete a worksheet you can’t get it back.
3. Formatting Cells
In Excel, you have a bunch of options on the home tab for formatting.

- The font group gives you the option to format the font by making it bold, italic, and underline. You can change the font size, and color of the font and cell color.
- From the alignment group, you can define the alignment of the text, add indent, merge-unmerge cells, and wrap the text.
- And from the number group, you can apply accounting format, text format, number format with or without comma style, etc.
Apart from the above options, you can also open the format cell options by right-clicking on a cell and selecting the format option or you can also use the shortcut key Control + 1.

4. Printing
When you go to the File tab, you can find there is a print button that further includes all the printing options that you can use for printing data from a worksheet.
You can also use the shortcut key Control + P to open the print option and once you open it you can see the following options there:

- Print Area
- Range of Pages to Print
- Collision
- Page Orientation
- Page Type
- Margins
- Scaling
5. Excel Functions (Basic)
The biggest power of Excel is its functions that you can use to perform a lot of calculations below you have a list of the top ten Basic Excel Functions:
- SUM: With this function, you can sum values from multiple cells, or you can also input values directly into the function.
- COUNT: This function returns the count of numeric values in a cell. You can refer to the cells where you have values or simply insert the values into them.
- AVERAGE: It returns the average of numeric values. You can refer to the cells where you have the values or simply insert them into the function.
- TIME: It returns a valid time serial number as per Excel’s time format. You need to specify hours, minutes, and seconds.
- DATE: It returns a valid date (date serial number) as per Excel’s time format by using the day, month, and year specified.
- LEFT: It extracts specific characters from a cell/string starting from the left (start). You need to specify the text and number of characters to extract.
- RIGHT: It extracts specific characters from a string starting from the right (last). You need to specify the text and number of characters to extract.
- VLOOKUP: It looks up a value in a column and can return that value or a value from the corresponding columns using the same row number.
- IF: IF function (tests a condition) returns a value when the specific condition is TRUE and returns another value if that condition is FALSE.
- NOW: It returns the current date and time (using your system’s settings) in the cell where you insert it.
And here are the Top 100 Excel Functions for you to learn more.
- String (Text) Functions
- Date Functions
- Time Functions
- Logical Functions
- Math Functions
- Statistical Functions
- Lookup Functions
- Information Functions
- Financial Functions
6. Charts
Once you start working on data probably you need to present it to someone, and a chart is one of the best ways to this.
In Excel, you have a whole list of charts that you can create. Once you go to the Insert tab, and in the charts group you can find all the charts which are available to use.

But to create a chart in Excel you need to have data in the right format, and then you need to select the right type of chart (make sure to check out this guide on chart types). For example, below you have 12 months of data for the sales quantity.

You can create a column chart to present this monthly data.

But you can also use a line chart if you want to show the trend for the 12 months.

But below you have product-wise data.

And in this case, the perfect chart would be a pie chart where you can present the quantity share of these products.

You can also use the recommended charts button to let Excel recommend a chart type according to the data you have.

You just need to select the data and click on the recommended chart button.

You can customize a chart in different ways. Once you select the chart you will have Chart Design and Format tabs where you have all the options for customization.

7. Sorting Data
Excel gives you a powerful option to sort data. To open the sort option, you need to go to the Data Tab and then click on the Sort button.

Now here you have 3 things to define:

- Sort by: The column to use as the base of sorting.
- Sort on: In the sort drop-down, you have 4 different options to sort values on. You can use cell value, cell color, font color, and conditional formatting.
- Order: The order of sorting or a custom order.
You can also use more than one level of sorting. If you want to add a new level simply click on the Add Level and then define all the three things that we have discussed above.

Related: Sort By Date, Date and Time & Reverse Date Sort
8. Find and Replace Option
Just like any other application, Excel has its own find and replace option. The shortcut key to open the find is Control +F and to find and replace it is Control + R.
In the “Find what” input bar, enter the value that you want to find, and in the “Replace with” enter the value with which you want to replace.

Now if you want to replace or find all the values, use the replace all or find all buttons, otherwise, you can use the “Find Next” and “Replace” buttons for a single value.
And once you click on the options button, you’ll see that there are some advanced options that you can use.

- Perform case-sensitive find and replace.
- Find and replace in the entire workbook.
- Find and replace using the cell format.
- And you can also find values from comments and notes.
9. Paste Special Option
The paste special option gives you complete control over how you want to paste values in a cell.
To open the page special option, you need to go to the Home tab and then click on the dropdown “Paste” and click on the paste special (You can also open the page special from the right-click menu).

In the paste special dialog box, you have multiple options that you can use.

Let’s say, you have a cell where you have a formula, but you only want to copy and paste the value from that cell. In this case, simply copy that cell and use the “Values” option from the paste special options on the destination cell.

Or if you want to copy and paste the format from one cell to another you can use the “Formats” option.
Related: Format Painter | Transpose
10. Keyboard Shortcuts
From Excel 2007 to Excel 2019, you can locate a keyboard shortcut by pressing the ALT key. On pressing it, it shows the shortcut keys for the options which are there on the ribbon, just like below.

And from here you can download (Excel Shortcuts Cheat Sheet) which covers the top eighty two keyboard shortcuts for Excel.
More Tutorials on Basic Excel Skills
Now once you master the basic stuff the next thing you need to understand is the Intermediate Excel Skills. Basically, these skills include options and methods to manage and work data in an efficient way.
11. Go To Special
The GO TO SPECIAL option helps you navigate to a specific cell or a range of cells within the worksheet. To open it you need to go to the Home Tab ➜ Editing ➜ Find and Select ➜ Go To special.

As you can see it has different options that you can use and select the different kinds of cells.

For example, if you want to select all the cells which are blank, you need to select the blank and click OK, and it will instantly select all the blank cells.
In the same way, if you want to select cells that have formulas and return numbers, you need to select formulas and then tick-mark numbers, and then click OK.

12. Pivot Table
Pivot Tables are one of the best ways to analyze data. You can create a summary table out of a large data set. To create a pivot table, follow the below steps:
- First, go to the Insert Tab and click on the pivot table button.

- You’ll have a dialog box to specify the source data, but as you have already selected the data it takes the range automatically.

- Once you click OK, you will have a sidebar just like below where you can define the rows, columns, and values for the pivot table that you can simply drag and drop. And now, add “Age” to the rows, “Education” to the column, and “First Name” to the values.

Once you define all, you’ll have a pivot chart like the one below.

More on Pivot Tables
- Rank in a Pivot Table
- Update Pivot Table Range Automatically
- Pivot Table Calculated Field
- Grouping Dates in Pivot Table
- Link multiple Pivot Tables to One Slicer
- Add a Date Timeline to the Current Pivot Table
- Refresh All Pivot Tables
- Running total in Pivot Table
13. Named Range
Named Range is about giving a name to a cell or range of cells. In Excel, every cell has its address which is a combination of row and column.
Related: Excel R1C1 Style
But with the named range you can give that cell or the range of cells a specific name (Generic) and then you can use that name to refer to it.
Let’s say you have a tax percentage in cell A1 and now instead of using the reference, you can give a name to it and then use that name in every calculation.
- To create a named range, you need to go to the Formula Tab ➜ Define Names ➜ Define name.

- Now in the define name dialogue box, you need to define the following things:

- Name of the range.
- Scope to use that range in the entire workbook or just in the worksheet.
- Comment if you want to add any.
- And then the address of the cell or the range.
Now once you click OK, Excel will assign that name to cell A1 and you can use that in formulas to refer to cell A1.

In the same way, you can also create a named range for the range of cells and then you can refer to it in the formulas.
14. Drop Down Lists
A drop-down list is basically a predefined list of values that can help you quickly enter the data in a cell. To create a dropdown list, you need to go to the Data Tab ➜ Data Tools ➜ Data Validation ➜ Data Validation.

Now in the data validation dialog box, you need to select the list from the allow, and then in the source you need to refer to the range from where you want to take values (You can also insert values directly into the source input box).

In the end, click OK
Now when you go back to the cell, you’ll have a dropdown list from which you can select the value to insert into the cell.

More on Drop Down Lists
- Dependent Drop-Down List
- Dynamic Drop-Down List
15. Conditional Formatting
The basic idea of conditional formatting is to use conditions and formulas for formatting and the best part is there are more than 20 options that you can apply with a single click.

Let’s say you want to highlight all the duplicate values from a range of cells, you just need to go to the Home Tab ➜ Conditional Formatting ➜ Highlight Rules ➜ Duplicate Values.

And you also have data bars, color skills, and icons to apply.
Make sure to explore all the options and check out this guide if you want to learn to use formulas in conditional formatting.
16. Excel Table
Excel table converts normal data into a structured table where you can sort, filter, and analyze data easily.

To convert your normal data into an Excel table all you need to do is use the keyboard shortcut key Control + T or you can also go to the Insert tab ➜ Table.

Excel tables by Microsoft | Rename an Excel Table | Excel Slicer
17. Idea Button
If you’re using Office 365 you can have access to the new Idea Button introduced by Microsoft that can help you to analyze your data in an easy way by recommending the possible ways to create:
- Pivot Tables
- Trendline Charts
- Frequency Distribution Chart
You simply need to select the data and then click on the idea button which is on the home tab.

It takes a few seconds to analyze the data and then show you a list of possible outcomes.

18. Using Sparklines
Sparklines are tiny charts you can insert into a cell, based on a range of data.
To insert a sparkline you need to go to the Insert Tab ➜ Sparklines.

There are 3 types of sparklines that you can insert into a cell.
- Line
- Column
- Win-Loss

When you click on the sparkling button it shows you a dialog box where you need to select the data range and the destination range of the sparkling.

Apart from this, you have options to customize a sparkline by changing its color, adding markers, and much more from the sparkline tab.

19. Text to Column
With the text-to-column option, you can split a single column into multiple columns using a separator. It’s one of the best ways to clean and transform your data.
Look at the below table where you have a column with names and between first name and last name there is a space.

You can split this column into two different columns (first name and last name) using text to column by using space as a separator.
- First, go to the Data Tab and click on the Text to Column.

- Now, from the dialog box select delimiter and click next.

- After that, tick-mark the space. As you can see it has separated values from the column using the space.

- In the end, click next and then finish.
The moment you click the finish, it converts that one column of full names into two different columns (first and last name).

20. Quick Analysis Tool
As the name suggests the Quick Analysis Tool allows you to analyze the data with one or two clicks. What I’m trying to say is, it has some of the selected options that can help you to analyze and present the data.
Below you have student data with their score the moment you select it you get a small icon at the bottom of the screen which is the button for the quick analysis tool.

Now when you click on it, it shows you a few tabs from which you can select options. Now let’s explore each tab one by one.
- Formatting: This tab allows you to add conditional formatting to the selected table, like, as data bars, color scale, icon sets, and other conditional formatting rules.

- Charts: This tab shows you some of the recommended charts which you can insert with the selected data or you can also click on more charts to select a specific chart.

- Total: From this tab, you can quickly add some of the basic formulas, like average count, running total, and many more.

- Table: From this tab, you can insert a pivot table with the selected data, and you can also apply an Excel table to it.

- Sparklines: This tab allows you to add sparklines which are basically tiny charts that you can create within a cell.

Advanced Excel Skills
Advanced Excel skills are more about solving complex problems and making you efficient to do all the work done in Excel, and below you have top advanced Excel skills that you need to master.
21. Advanced Excel Formulas
An ADVANCED EXCEL FORMULA (Excel Formulas List) means combining different functions to calculate a specific value that is not possible to calculate otherwise. Below is a list of some of the most important ones:
Advanced Formula Examples
22. Advanced Excel Charts
As you have already seen that you can create most of the charts in Excel with a few clicks, but apart from all those charts you can also create some advanced charts.

Advanced Excel Charts are for a specific purpose and need you to spend a few minutes learning how to create and how they presented data. Below you have a list (tutorials) for some of the Advanced charts that you can learn to create in Excel.
23. Visual Basic for Applications
VBA is an object-oriented programming language for Microsoft office applications, and you can use it in Excel to write VBA codes to automate the activities that you normally perform manually.

24. Power Query
If you work with data, I’m sure you face this situation where you need to clean and transform data before you use it.

Now the thing is cleaning data and transforming data is a tedious process and you need to spend a big chunk of your time on it every day. But with the power query, you can do this entire process of cleaning and transform with a few clicks.
Power query basically works as an ETL where you can extract data from different sources, transform it, and then load it back to the worksheet. Check out this complete tutorial on Power Query and do not forget to learn to combine multiple Excel files.
25. Power Pivot
Power Pivot is basically a data modeling technique that you can use to import data of millions of rows, from multiple sources, and then perform calculations (DAX).

To get started with Power Pivot:
- Introduction to Power Pivot
- Power Pivot – Overview and Learning
Learn More
- Excel Tips and Tricks
- Excel Watch Window
- Excel Formula Bar

Excel is a powerful program for handling complex data. The data can be in the form of numbers, text, or both. But there are many features of Excel that are not immediately obvious, and these can be extremely useful in analysing and manipulating data.
If you want to get ahead in your career, it is essential to learn how to use these features such as pivot tables, advanced charting, macros, and of course – VBA!
Excel can be used for a wide range of tasks, from managing simple lists to complex financial models. It is a versatile program that can help you improve your work efficiency, reduce errors, and save time.
So, if you want to learn intermediate Excel skills today, whether you are reading this from a business perspective and want to improve your team’s productivity or from a personal perspective and want to stand out in your next job interview, this guide is for you.
In this guide, we’ll look at the advanced excel features that will help you become more productive and efficient in your work.
Let’s get started!

Learning Basic Excel Functions
The better your understanding of the basic functions of Excel, the more confident and comfortable you will be when it comes to executing more complicated actions and tasks.
You are going to want to get comfortable with these functions if you want to stand out from the competition. These are the functions that will help you organise your data into something that makes data work for you.

Learn essential skills including map charts, data insights, formulas and visualisations.
There are five key basic Excel functions that can take your skills to the next level and put you or your team in the position to take the next step and unlock the real potential of this programme.
SUM Function
The SUM function allows you to add values. If you are managing a budget spreadsheet, for example, you can add the contents of a column or a range of cells to give you the final total.
TEXT Function
This helps you make long or complex numbers more comprehensible. There are different TEXT functions to help you round up numbers to decimal places or combine them with symbols and text such as dates and times.
VLOOKUP
VLOOKUP helps you to find specific data in a row or a table, such as the amount of money spent on a product or the name of the person working on a project. You can search for an approximate match or an exact match.
AVERAGE Function
This is a great help for anyone processing a large amount of data, on a database for example. As you would expect, it will give you the arithmetic mean of the numbers in the cell range that you have selected.
CONCATENATE Function
This helps you to join the words or data in a series of cells into a sentence. You can insert any missing words into the string of cells that you want to join.

![]()
Excel Do’s and Don’ts: How To Make Your Spreadsheets Shine!
Why Excel Knowledge Looks Good On Your CV
Everyone is looking for a way to stand out and having Excel knowledge will help you to stand out. Excel is one of the most versatile pieces of software and also one of the most widely used.
Employers will want to teach you their specific way of doing things, but it will look great if you can demonstrate that you have skills beyond the basics.
- Employers will not have to waste time training you.
- You can learn new skills more quickly.
- It demonstrates experience in your field.
Most people have some experience with Microsoft Office products, but surprisingly few can use Excel properly. Having intermediate skills will put you ahead of the competition.

Benefits of Learning Advanced Excel Skills
If you really want to stand out to any prospective employers, then you should think about taking your Excel skills to the next level.
Businesses are looking for ways that they can improve efficiency and cut down on wasted time. Having advanced knowledge of Excel means that you will be an important asset to them.
- You can find better solutions to data management.
- You can be more efficient and productive.
- You can work on more complex projects such as financial predictions.
If you are looking for a job in finance, or if you are launching a small business and want to stay on top of your budget projections, then advanced Excel skills are essential.
7 Excel Skills Employers Look For
It is rare that you will find a job advert that does not mention Microsoft Excel. It is such a key element of day-to-day business operations and knowing what they are looking for ahead of time will help.
Here are seven key Excel skills that employers are looking for when they put “Microsoft Office skills” as a requirement. Let’s break them down.
Formula Functions
You will need to show an understanding of the functions of the most common Excel formulas. The ones we have listed above are the most important, but any additional functions you can master will be a bonus.
Data Validation And Protection
You will need to show that you can validate data according to their specific requirements. You will also need to demonstrate that you understand how to protect and lock data.
PivotTables
You will be using PivotTables to summarise your data. This is one of the most important steps to help you turn a mountain of data into something that is organised and easy to comprehend.
Proper Formatting
Every company is going to be different, but if you are going to be presenting spreadsheets to bosses or clients, understanding how to format data is crucial.
Essential Macros
Macros save time when putting a complicated spreadsheet together. These are the actions that you can create which will cut out the need to perform the same task over and over again.
Charts And Graphs
To demonstrate an advanced understanding of Excel, knowing how to create a chart or a graph is key. A visual representation of data is one of the best ways to communicate complicated information.
The IF Function
If you really want to show that you are confident with Excel, learn about the IF function. This helps you to create a comparison between what you expect and the actual value. This is a great tool for comparing budgets to actual spend, for example.
Beginner vs Intermediate Excel Skills
You may be asking yourself if your current business requirements make learning intermediate Excel skills necessary. There are so many reasons why you should take the next step.
Beginner Excel skills will give you the tools you need to put a basic spreadsheet together. You will be able to search the data that you have and to create clean, comprehensible information. These are valuable skills.
Moving to intermediate will allow you to harness the power of Excel to make software work for you. It is the difference between creating a list of data and creating the kind of graphs and comparisons that show you what that data really means.
Excel has so many different uses, and a beginner tutorial is a good place to start. But if you are a business owner or if you are looking to stand out from the crowd, you should seriously consider learning the intermediate skills.

What To Expect On An Intermediate Excel Skills Test
When you are applying for a job that requires knowledge of Excel, you should expect to be given a Microsoft Excel test. Your employers will be looking to see how capable and comfortable you are with the software.
If you are taking an intermediate Excel skills test, the tasks will be more complex. These tests require you to understand how the more sophisticated actions and formulas in Excel work.
It is worth noting that an intermediate Excel skills test will still cover many of the skills that you will have learned as a beginner. You will be asked some questions on formatting and cell protection, for example.
However, the real test will be showing that you understand macros, that you can put a formula together, and that you can create a graph or table, but it will not be as intensive as an expert level test.
An Intermediate Excel Skills Checklist
There are some key skills that you will need to have mastered if you want to pass an intermediate Excel skills test. While the specifics may vary, here are the most common areas.
- Charts, graphs, and bars
- Pivot tables
- VLOOKUP
- COUNTIF
- SUMIF
- Filtering information to provide quality data
- Creating macros
- Managing data
You will need to organise large quantities of data and present it in a graph or table. You will also need to demonstrate that you understand the more advanced tools that can help you to save time.
Microsoft Excel Digital Skills
At The Excel Experts, we know you’ll love our MS Excel Training Courses!
This is because we uniquely deliver our courses, tailored to each learner. We use our total combined experience of 25 years to make sure that we cater to your needs.
Excel can be a great tool for any professional or business, and with the right set of skills such as learning conditional formatting and data validation, you will find Excel is much easier to use.
Our training course is designed to give you a better understanding of some of the more complex features that Excel has to offer.
Some of the topics that we will be covering include:
Pivot Tables
Learn how to use pivot tables to your advantage and make data analysis a breeze. Pivot tables are used for organising and summarising huge amounts of data into a clear, easy-to-understand format.
Arguments
Learn how to write arguments that will make your formulas more dynamic and easier to use. Arguments are used in conjunction with functions to give your formulas more flexibility.
Array Formulas
An array formula is a type of formula that allows you to perform multiple calculations with a single entry. Array formulas can be used for a variety of tasks, such as finding the sum of a range or returning multiple pieces of data.
Macros and VBA
Create custom macros to automate tedious tasks and use Visual Basic for Applications to truly take your understanding of Excel to the next level.
These are just a handful of Excel topics you can expect to learn and explore further.
If you want cutting-edge MS Excel training that is tailored specifically to your needs, look no further than The Excel Experts.
Get in touch today!
Conclusion: What Are Considered Intermediate Excel Skills?
It can be difficult to tell what your potential employer will consider intermediate or advanced skills. What you need to remember is that intermediate Excel skills are the skills that help you to really engage with the data.
The intermediate Excel skills you will learn with us will help you to create visual representations of your data, organise information in easy-to-read tables, save time through shortcuts and quick commands, and protect the information on your spreadsheets.
FAQs
What is intermediate Excel knowledge?
Intermediate Excel knowledge is the step beyond simply inputting data into a spreadsheet. That means knowing how to format properly, use formulas for mathematical equations, and create graphs and tables.
What is the difference between intermediate and advanced excel skills?
When you learn advanced Excel skills, you will use formulas for more complex actions. For example, you will be able to analyse data and create simulations and projected spending, as well as understanding Visual Basics for Applications.
What qualifications are available for learning intermediate excel skills?
There are a lot of courses out there for anyone looking to learn intermediate Excel skills, which is why it is so important to find an online tutor that can work with you to achieve your specific targets. Visit The Excel Experts to learn more about the courses we have available!
Any likely intermediate excel skills interview questions?
You should expect to be asked to explain functions of Excel such as VLOOKUP, SUMIF and COUNTIF. You will be asked to explain what a pivot table is and what you would use it for, and to give an example of a macro that you have used in your previous place of work.
NEED HELP WITH AN EXCEL PROJECT, BIG OR SMALL?
The Excel Experts can help you or your business complete an unfinished project, integrate web applications, automate tasks, and much more.

We often get questions on the difference between Microsoft Excel intermediate skills and Microsoft Excel beginner skills.  Many of our students who think they have beginner Microsoft Excel skills have intermediate level Microsoft Excel skills and vice versa. There is this ongoing debate on what constitutes intermediate level Excel skills and what constitutes beginner level Excel skills.
So we, at GraduateTutor.com, have decided to end this debate and clearly define what constitutes intermediate level Microsoft Excel skills and what constitutes beginner level Microsoft Excel skills.
TEST YOURSELVES
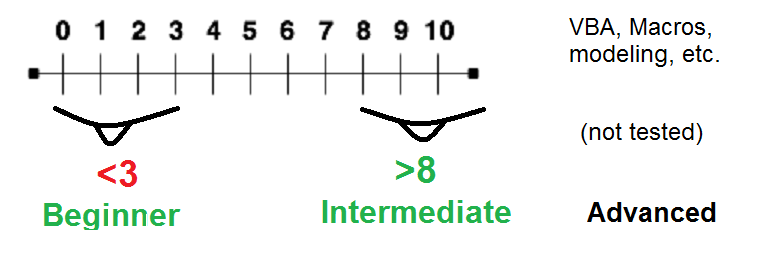
We have outlined this set of 10 Excel exercises that will test your Excel skills. If you can tackle 8 of these Microsoft Excel exercises, then you are firmly in the intermediate Excel skills camp. If you can tackle 3 or more, we think you are beyond beginner level. If you can tackle less than 3 of these exercises, you can rate yourself as a beginner in Microsoft Excel.
Microsoft Excel Intermediate Challenge 1
This Microsoft Excel Intermediate challenge is about importing data into Excel and working with text data. The challenge is to find and pull out data within a cell and to segregate and join text data. You should be able to do this in under 10 minutes if you have intermediate level Microsoft Excel skills.
Import the list of Governors from Wikipedia and answer the following questions:
- List the governors alphabetically according to their first names.

- List the governors alphabetically according to their last names.
- List all names in UPPER case letters.
- Which of these governors has the longest & shortest names?
- List all names with the first alphabets of each word in upper case letters.
- How many days, months, years have the governors been in office?
- List which of these governors has had the longest & shortest tenure.
- What is the average tenure of Republican governors? Democratic governors?
- How many Democratic & Republican governors do we have?
- How many governors started their tenure in 2012 & 2013?

Microsoft Excel Intermediate Challenge 2
The IF function in Microsoft Excel is one of the most powerful functions in Microsoft Excel. There are however a variety of ways to use the IF function (and a number of substitutes too). This Microsoft Excel Intermediate Challenge is about modeling a specific scenario in Excel.
I have opted for a phone plan with the following features. Please model the computation of my monthly invoice in Microsoft Excel. Show the amount payable for each month in the yellow cells. You should be able to simply drag and drop the contents of the first cell and have the monthly invoice estimated in the other cells colored in yellow. Feel free to add more columns to the right and make assumptions should you need to.
- I pay $5/month to retain my phone number (my basic number fee).
- If I use the phone during a month (incoming or outgoing), I pay $10 in addition to my basic number fee (above).
- If my total minutes used does not exceed 500 minutes a month, my per minute fee for minutes below 500 minutes is $0.1 per minute.
- My lower rate minutes can be rolled over for 3 months.
- If my total minutes exceeds 500 minutes a month, my per minute fee for minutes above 500 minutes is $0.2 per minute.
- If I use the phone only for incoming calls in the month, I get a $20 credit.
- If I use the phone only for outgoing calls in the month, I get a $25 credit.
- My bill cannot be negative.
- Credits cannot be rolled over.
Microsoft Excel Intermediate Challenge 3
Here is a dice game you can play. Roll two dice at each throw.
- If the sum of the outcomes is 5 or 6, the game is lost.

- If the sum of the outcomes is 2 or 9, the game is won.
- If it is not either of the above, roll the dice again.
- If we continue for 3 moves without losing, the game is won.

Please model this game in Microsoft Excel. Empty cells should be blank. Now you can play this game with or without dice.
Microsoft Excel Intermediate Challenge 4
Mark Twain said that you cannot escape death and taxes. So it would be useful to model taxes. Try modeling your taxes. Here is a simple corporate scenario if you don’t want to deal with the gloomy subject of your taxes today (note that I am using random numbers to compute revenues and Cost of Goods Sold (‘COGS’). You should have the taxes computed correctly in the yellow cells each time a new random number is generated.
Microsoft Excel Intermediate Challenge 5
The next Microsoft Excel Intermediate challenge is to compute the net proceeds from sale of an asset by a company. The computation of the net proceeds from sale of an asset by a company is something you will usually learn in your first accounting class. We have tried to explain it simply here.
For this challenge, only the inputs in yellow can be changed. Economic life can be any value that has a MACRS depreciation schedule (3, 5, 7, 10, 15, 20 years). You could also consider having an error message if the useful life is anything other than 3, 5, 7, 10, 15, 20 years. The key Microsoft Excel challenge here will be to automatically pick the MACRS depreciation schedule based on the useful life of the asset.
Microsoft Excel Intermediate Challenge 6
This Microsoft Excel Intermediate challenge is about modeling a mortgage cash flow. This is an exercise you will typically encounter in your first finance class. You are provided the price of the home, the down payment, the duration of the loan in years and the interest rate for the loan.
Please model the mortgage payments over the life of the loan, specifically showing the interest and principal amount of each payment over the life of the loan. Please round up the monthly interest payment to the nearest dollar. The inputs to the model are only in the yellow cells. Everything else should automatically get filled in based on the formula you place in the cells.
Microsoft Excel Intermediate Challenge 7
Pivot tables and Pivot charts are definitely one of the most handy tools you will encounter in the Microsoft Excel world for data analysis. Mastering Pivot tables and Pivot charts will save you hours over your 2 year MBA program and probably hundreds of hours over the rest of your career.
The data below is of tourist traffic to a holiday town in Napa Valley. Use the data below to tease out patterns with pivot tables. Patterns may include factors such as nationality, gender or age groups. Can your pivot tables and charts at least answer the following questions:
- Which country provides the highest and lowest revenue?
- Which country provides the highest and lowest AVERAGE revenue?
- Do men or women spend more?
- Which age group spends the most and the least?
- Which age group in different countries spends the most and the least?
- Is this holiday town more attractive to older men or older women?
Microsoft Excel Intermediate Challenge 8
Scenario analysis and what-if analysis are helpful in understanding various possible outcomes in a given situation. The chart below has sales data on 10 employees of a small firm. If the firm pays a bonus of 1% on sales above $500,000, 2% on sales above $750,000 and 3% on sales above $1,000,000, what would the bonus be this year? If the firm introduces no new products and you assume that the sales will stay the same next year, how high can the commission on sales above $1,000,000 be if you want to give out a total bonus of $100,000 to all employees combined? If you expect the sales to increase by 10% on average for each employee, how high can the commission on sales above $1,000,000 be if you want to give out a total bonus of $100,000 to all employees combined?
Microsoft Excel Intermediate Challenge 9
You are given the following data on unit sales of a handcrafted pen.
- What number of units must be sold to break even for the year (have no profits or losses)?
- The selling price per unit and material cost per unit are highly variable. What combinations of selling price per unit and material cost per unit are profitable for the firm? Please fill in the profit for the year in the yellow cells for various combinations of selling price per unit and material cost per unit.
- Please have Microsoft Excel fill in a green color for the various combinations of selling price per unit and material cost per unit that are profitable.
Microsoft Excel Intermediate Challenge 10
Supper Mix produces three varieties of energy products for athletes called ProMix, EnergyMix and VitaMix. The primary base products are almonds, peanuts and grapes. Each energy product must contain the minimum required calorie count. The maximum available quantities of almonds, peanuts and grapes are listed below and the minimum commitments for each product made to wholesalers are also provided. The calorie count for each pound of ingredient and its cost per lb is also provided.
Please provide the optimal mix of ProMix, EnergyMix and VitaMix that is to be made.
Congratulations on getting this far!
Please count how many of this set of 10 Excel challenge exercises you have been able to do successfully. Be generous to yourself. If you can tackle 8 of these Excel exercises completely, then you are firmly in the Microsoft Excel intermediate skills camp. If you can tackle 3 or more, we think you are beyond beginner level. If you can tackle less than 3 of these exercises, you can rate yourself as a beginner in Microsoft Excel.
Prepared for your dream job? Is it consulting, private equity or investment banking?
Different jobs or roles within each company may require different levels of Microsoft Excel skills. Job requirements list either intermediate Microsoft Excel skills or beginner Microsoft Excel skills as a requirement for the job. Candidates often do not know what constitutes intermediate level Microsoft Excel skills and what constitutes beginner level Microsoft Excel skills. Sometimes recruiters themselves do not know what constitutes intermediate level Excel skills and what constitutes beginner level Excel skills! We hope that this set of Microsoft Excel exercises will clarify what intermediate Microsoft Excel skills are and beginner Microsoft Excel skills are.
We believe that you need at least intermediate level Excel skills to start as an analyst or in a consulting, private equity or  investment banking role (of course this is in addition to the industry/domain specific skills you will need). So if you are gunning for any of these high profile jobs, get cracking on building your Microsoft Excel skills. Browse through this list of Microsoft Excel resources to kick-start your Excel skills training. Of course, we will be happy to provide you private tutoring in Microsoft Excel. We believe this is the fastest way to learn Excel.
PS: What constitutes advanced Microsoft Excel skills?
What about advanced Microsoft Excel skills? What constitutes advanced Microsoft Excel skills? We believe that you will be in the camp of those with advanced Excel skills if you are comfortable working with Excel Macros and VBA, combining Excel with other tools, understanding how to speed up Microsoft Excel models, protecting Excel worksheets, etc.
Relevant other skills: Programming
In addition to learning Microsoft Excel, also consider learning some programming languages. A large part of the use of Microsoft Excel was data analysis of different types and levels. A the volume of data increases, more of the data analysis is being done on programming languages such as R and Python. So do consider adding some programming skills if you believe your career could involve data analysis in the future.
Most Excel users know the basic functions like SUM, COUNT, AVERAGE etc. Therefore, in this tutorial I’m going to cover the 10 most important intermediate level Excel functions every Excel user should know. Watch the video for an introduction to each function, and then dive deeper by following the links below.
Note: there’s technically 17 functions covered in this tutorial, but a few of them do the same thing as other functions, or are very similar, so I’ve only counted 10 😉
Watch the Video

Download Workbook
Enter your email address below to download the sample workbook.
By submitting your email address you agree that we can email you our Excel newsletter.
Function 1: IF, Nested IFs and IFS
The IF functions belong to the logic group of functions and are a must for every Excel user to know.
Get started with the IF function and nested IFs. And if you have Excel 2019 or later, or Microsoft 365, check out the newer IFS function.
Function 2: IF(AND and IF(OR
The AND and OR functions extend the number and type of logical tests you can specify when nested in the IF function. A lot of people struggle with them, but once you master these functions you won’t look back.
Still stuck? Download our IF formula builder and have your IF formulas written for you.
Function 3: SUMIFS
The SUMIFS function is one of the ‘IFS’ family of functions which enables you to aggregate data that matches criteria you specify. Once you know one of these functions, the others are easy because they all have the same syntax, as you can see below:
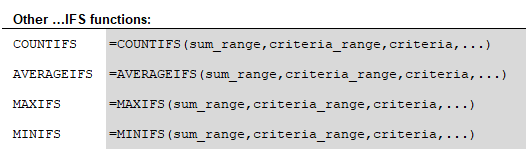
These functions treat all criteria as AND criteria, meaning each condition must be TRUE for the value to be included in the SUM/AVERAGE etc. If you need more flexibility, the SUMPRODUCT function can handle AND and OR criteria.
Function 4.1: SUBTOTAL
The SUBTOTAL function is great for working with data that contains…wait for it, subtotals, because it automatically ignores any SUBTOTAL formulas in the range being summed. Not only that, you can also use it to SUM, AVERAGE and more, as shown in the table below. And you can specify whether you want to include or ignore hidden rows.
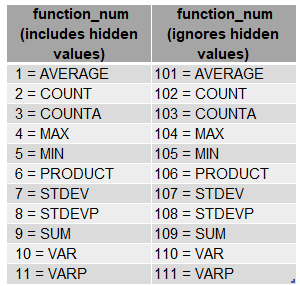
Function 4.2: AGGREGATE
The AGGREGATE function is what I like to call the Swiss Army Knife of functions because it can do so much. Similar to SUBTOTAL, AGGREGATE has a range of different aggregation options:
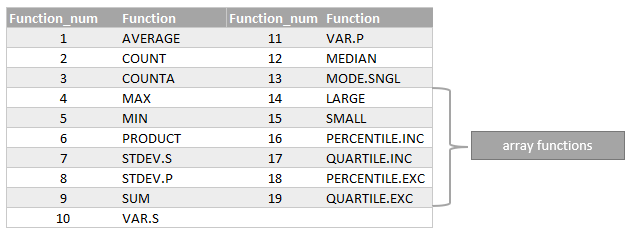
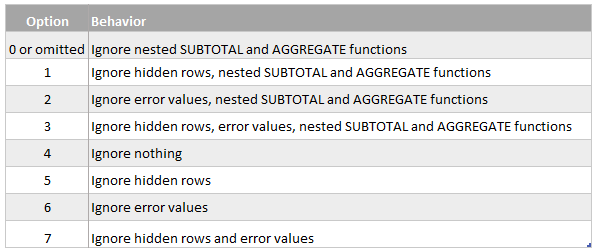
And like SUBTOTAL you can tell it to ignore hidden or filtered rows, but you can also choose from the following behaviours:
Function 5: XLOOKUP (or VLOOKUP)
The XLOOKUP function, available in Excel 2021 onward and Microsoft 365, is the new improved version of the much loved and sometimes hated VLOOKUP function. XLOOKUP gets around the limitations of VLOOKUP and removes the risk of inexperienced users inadvertently building formula errors into their work.
Function 6: INDEX & MATCH
INDEX and MATCH formulas can be scary for many users, but they get around the limitations of VLOOKUP. If you don’t have the XLOOKUP function in your version of Excel, then I encourage you to master INDEX & MATCH.
I’ll also go as far to say that the INDEX function is probably the MOST IMPORTANT EXCEL FUNCTION! If you’re already familiar with INDEX, then check out this tutorial that covers 5 things most people don’t know about the INDEX function:
Function 7: FILTER
The FILTER function is new in Excel 2021 and Microsoft 365. It’s one of the most important new functions we have in Excel. FILTER enables you to extract rows from a table of data based on criteria you specify. Not only that, you can extract some of the columns or all, or even extract the columns in a different order.
Function 8: IFERROR
The IFERROR function is a must for all report builders as it automatically hides errors returned by formulas ensuring a polished finish.
Function 9: EOMONTH and EDATE
The majority of Excel users work with date and time at some stage, especially accountants. The EOMONTH function, short for End of Month, and the EDATE Function, which I’m guessing is short for Extend Date, are super handy.
EOMONTH returns the last day of the month, n months before or after the specified date. It can even return the start of the month with a simple trick.
EDATE returns the same date of the month, n months before or after the specified date.
If you’d like to learn more about working with dates and times in Excel, check out my Excel Date & Time 101 and grab a copy of my eBook and examples file.
Function 10: GETPIVOTDATA
The GETPIVOTDATA function is often misunderstood and harshly judged, but it’s the secret weapon of PivotTable users who want to create a custom styled report without the bulk of a PivotTable and is super robust.
More Excel Functions
Now that you’ve mastered the above functions, you can find more resources here:
Advanced Excel Formulas course – get up to speed with advanced formulas in 5 hours.
Excel Function Library – Looking for help on a specific Function? Check out our Excel Function Library.
Absolute References Explained – Absolute references are a cornerstone of writing formulas and are therefore a must have skill for every Excel user.
Absolute References for Tables – Tables have their own absolute reference language which is not as obvious as it should be.
Writing Formulas Efficiently – In this post I share how to write formulas in such as way that it’s quick to write, and quick to maintain.
Named Ranges – Unlock some more advanced techniques with named ranges and make your formulas easier to read, write and maintain.
Time Calculations – Working with dates and time in Excel is tricky if you don’t know the fundamentals of how Excel handles date-time values.
Excel Forum – Have a specific question you need help with? Our forum volunteers are eager to help you.
The definitive guide to hiring an expert with advanced Excel skills

Share
![]()
![]()
![]()
Hiring an employee with advanced Excel skills can be challenging. Not only do you have to identify which advanced Excel skills their job will require, but you also have to find a way to test these skills in your candidates. Things get even more complicated if you’re not an Excel expert. Fortunately, there are ways to find these candidates, even if you’re not an Excel master, like using an Excel proficiency test.
Figuring out if a candidate has advanced Excel skills when you’re not an expert yourself may be tricky — but it’s not impossible. There are ways to check the expertise of candidates on the required skills.
In this article, we’ll talk about the Excel skills that are considered advanced, the combination of skills needed for certain job roles, and how to assess whether a candidate has the needed skills or not. Let’s dive right into it!
Table of contents:
- What are advanced Excel skills?
- 6 advanced Excel skills to look for
- 1. VLOOKUP
- 2. INDEX MATCH
- 3. Advanced conditional formatting
- 4. Pivot tables and reporting
- 5. Macros and VBA
- 6. Data simulations
- How can you assess candidates on their Excel skills?
- Testing spreadsheet acumen with screening questions
- Conducting Excel proficiency tests to assess skills
- Comparison between using screening questions and Excel proficiency tests
- What job roles require Excel skills?
- 1. Financial analyst
- 2. Business and market analyst
- 3. Data analyst
- 4. Cost estimator
- 5. Information clerk
- 6. Accountant or auditor
- Hire the right Excel expert
What are advanced Excel skills?
Advanced knowledge of Excel means possessing the ability to use spreadsheets, graphing, tables, calculations, and automation efficiently to process large quantities of data relevant to business tasks.
The way Excel is used depends on the needs and duties of specific departments or job roles.
Let’s take a look at the three tiers of Excel skills and then we’ll expand on the specific skills an advanced Excel user should have. After that we’ll cover Excel proficiency tests and other ways to assess Excel skills.
Basic Excel skills include common Excel keyboard shortcuts, using cell references, styles, and ranges with data. Different view options like zooming in or out and showing formulas, and basic spreadsheet formatting also belong to the basic skillset for Excel.
Intermediate Excel skills include more advanced formulas and functions like SUM, AVERAGE, and SUMPRODUCT for efficient use of spreadsheets. Intermediate users should also have a working knowledge of charts.
Advanced Excel skills are all about mastery over formulas, VBA (Visual Basic for Applications) programming, and other Excel features for handling complex tasks. Experts can use Excel for more advanced purposes like data analytics and simulation.
6 advanced Excel skills to look for
There are a lot of things you can do with Excel — but the following six skills are the ones that separate the real experts from the rest. Familiarizing yourself with these skills will help you determine which ones your ideal candidates should have. Then you can choose the right interview questions and Excel proficiency tests to be sure your candidates have what it takes to get the job done.

1. VLOOKUP
VLOOKUP (vertical lookup) is a function to look up a value in a table and retrieve data from a specific column. Basically, it retrieves data in a table vertically using a lookup value.
VLOOKUP is a valuable skill to have as it helps merge multiple sets of information into one — like a merger tool.
In practice, VLOOKUP is useful for:
- Coming up with the corresponding interest rate flow in a financial model with a debt schedule
- Looking up the quantity sold for a specific item
- Calculating sales bonuses
2. INDEX MATCH
The INDEX MATCH combination is made up of two Excel functions — INDEX and MATCH. The former returns the value of a cell at a given location in a list or table. The latter returns the position of a cell in a row or column.

Source: Ablebits
When combined, these functions allow a formula to become dynamic, like in the case of a two-way lookup. Its uses are similar to VLOOKUP although INDEX MATCH is more flexible.
In terms of usage, here are examples:
- Returning the sales figures for a specific month for a specific agent
- Creating a financial summary
- Making a purchase order with a price list
3. Advanced conditional formatting
Conditional formatting is a great way to design a spreadsheet as it gives a user a quick way to add a visual analysis layer on a data set. It can also be used to create advanced tools like heat maps and Harvey bubbles.
A heat map is a representation of data with values represented as colors, usually a warm-to-cool color spectrum, to show which values are larger or smaller than the others.

Source: Excel-Easy
Harvey balls are graphical representations of qualitative information to indicate the degree to which an item meets a specific criterion.

Source: Contextures Blog
Here’s more of what advanced conditional formatting can do:
- Flag data entry problems
- Show duplicates
- Highlight rows that have the most sales
4. Pivot tables and reporting
A pivot table is a powerful Excel feature used in creating reports of large data sets. In a sense, a pivot table is like an ordinary report table with one vital difference — you can look at the same data from different perspectives.

Source: Excel-Easy
A user can group data into categories, filter data to include/exclude categories, and even build charts with pivot tables.
In real life, pivot tables can be used to build:
- Employee database
- Product database
- Project sales record
5. Macros and VBA
A macro is a small computer program that will do an action or a set of actions once turned on. Macros are written using VBA (Visual Basic for Applications) language stored in modules. Using a macro needs a deep understanding of VBA.

Source: Spreadsheeto
VBA macros help automate tasks. However, because of its complexity, not every Excel user has this skill.
Advanced Excel users apply VBA Macro to:
- Cleanup and format data quickly
- Listing data on all sheets
- Automate properties and actions in pivot tables
- Create and modify user forms
- Creating systems to make, update, or change Excel files
6. Data simulations
A simulation usually entails making a mathematical model that will represent the characteristics of a system. While there are specialized software programs today for simulations, someone with advanced skills can use Excel tools for simulation.

Source: SpreadsheetWEB
To do a simulation in Excel, a user needs to know how to use features like:
- Random number generation functions
- Statistical functions
- Data tables
- What-if analysis tools
In terms of application, here are some use cases of data simulations:
- Simulate online ads activities to determine possible average sales for a period
- Find sales patterns based on recent data
- Model customer lifetime value based on their product-purchasing trajectory
How can you assess candidates on their Excel skills?
You may receive applications from a lot of candidates who consider themselves experts in Excel. After all, Excel skill is common considering that 16% of the world’s population use Excel.
To make sure you hire a candidate with the most applicable advanced Excel skills, you’ll need to test them. Let’s go through the different ways to scrutinize the competency of your candidates.
Testing spreadsheet acumen with screening questions
Screening questions help you manage the volume of incoming applications by showing you which applicants have the required skills.
This enables you to sift applicants from the start. However, you can also choose to screen during the application process or even after the selection process. But pre-screening applicants will definitely save time in the long run.
There are three types of screening questions:
- Text or open-ended
- Yes/No
- Multiple choice
For example, you may ask applicants:
- How many years of experience do you have in Excel?
- What do you consider your hardest project completed in Excel? Explain how you approached it and the results.
- Any experience with VBA macros? If so, tell us when and how you’ve used it to improve data processing.
- In what circumstances do you prefer VLOOKUP over INDEX MATCH?
Yes/No questions are helpful for getting a quick overview of candidates’ skills and comparing your candidates on clear parameters. Yes/No questions are much more specific than open-ended questions and allow to zoom into specific knowledge.
Sample questions include:
- VBA macros are used to automate the processing of data. True or false?
- VLOOKUP and INDEX MATCH are the same. Yes or no?
- You can create heat maps with advanced conditional formatting. Yes or no?
One of the best and commonly used types of screening questions is multiple choice. With the right questions and a timer, you’ll be able to test a candidate’s skills in Excel.
Here’s an example from TestGorilla’s very own Excel test:

TestGorilla has a massive test library. Explore the test library and search for specific tests and see test recommendations. You can also set up your own custom questions.
Conducting Excel proficiency tests to assess skills
An Excel proficiency test can show you how well a candidate applies advanced Excel skills.
Ideally, this should be done either after the initial screening right before the interview or after a round of interviews.
Opting for free exams found online means that your candidates may also be able to find the answers to these online. If you want to avoid this, it’s better to bring in an expert who can design an exam just for you. If that’s not an option, TestGorilla has a general Excel proficiency test, an advanced Excel proficiency test, and a test to gauge a candidate’s skill in financial modelling with Excel.
Here’s an example of a free advanced Excel practical exam from eExcel LTD:

General Excel proficiency test
TestGorilla’s general Excel test evaluates a candidate’s ability to read and interpret Excel spreadsheets, perform basic calculations, and manipulate tables. That way you can hire candidates who understand how to use Excel as part of the Microsoft Office suite.
This test is a good option if you’re looking to hire managerial assistants, executive assistants, or other job roles that require a good understanding of the basic functionality of Microsoft Excel.
You can take a look at some sample questions in our Test Library. If you like what you see, sign up for a free trial.
Advanced Excel proficiency test
The Advanced Excel proficiency test evaluates a candidate’s mastery of a wide range of Excel features and formulas to help you identify candidates who are skilled in using Excel to organize data and draw insights from them using Microsoft Excel.
This test is a good way to make better decisions when hiring finance professionals, marketers, salespeople, executives, data scientists, and other job roles that require an advanced command of Microsoft Excel.
If this is what you’re looking for take a look at some sample questions in our Test Library. If you like what you see, sign up for a free trial.
Financial modeling Excel proficiency test
The financial modeling Excel proficiency test evaluates a candidate’s essential finance and valuation skills and their ability to create and maintain financial models using Excel. It’s designed to help you hire finance professionals who need to work with Excel frequently.
Consider this test if you’re hiring finance professionals (controllers, analysts, consultants) who need to have solid financial modeling skills in Excel.
You can get a better feel for what this test looks like by reviewing some sample questions in our Test Library. If you like what you see, sign up for a free trial.
Comparison between using screening questions and Excel proficiency tests
Screening questions and practical exams offer different advantages and drawbacks.
Let’s look at each one in the following table:

With the right combination of assessment methods, you’ll be able to correctly determine if the candidate really has the required skills.
What job roles require Excel skills?
Excel has many uses — from generating pivot tables for accounting ledgers, to tracking sales data of a company.
Depending on the job role, you want to look for specific advanced Excel skills from candidates. Here’s a list of some of the job roles that require Excel skills and what skill set you should look for:
1. Financial analyst
Financial analysts study financial data to discover investment opportunities, lower operating costs, and write reports on the details of the information. Together with a sales manager, a financial analyst also suggests ways to increase the financial growth of the company.
The advanced Excel skills to look for in a financial analyst are:
- VLOOKUP
- INDEX MATCH
- Data simulations
Example job description text:
“For this role, you need to be familiar with accounting functions in Excel to be able to execute techniques in accounting. You should also have experience with forecast and sales trend tools in Excel. Knowing how to use data simulations and solver is a plus.”
2. Business and market analyst
A business analyst helps bridge the gap between IT and the business with data analytics, enabling business intelligence to be extracted from raw data. A market analyst follows it up by helping the business make informed decisions about the market based on the data.
The advanced Excel skills to look for in a business and market analyst are:
- Pivot tables
- Conditional formatting
- VBA
- Forecast and trend Excel tools
Example job description text:
“For this role, you need to have a strong understanding of Excel, with expert proficiency in pivot tables, conditional formatting, VBA, forecast & trend tools.”
3. Data analyst
A data analyst supports a company in decision-making by inspecting, transforming, and modeling data to discover useful information and come up with a conclusion. In addition, they also identify trends and make predictions about the future.
The advanced Excel skills to look for in a data analyst are:
- Pivot tables
- VLOOKUP, INDEX, and MATCH functions
- Forecast and trend Excel tools
Example job description text:
“For this role, you need to be an expert in Excel’s analysis tools. You should also have mastery over analysis functions and lookup functions like VLOOKUP, INDEX, and MATCH. It would also be great if you know how to create advanced charts and use forecast & trend tools.”
4. Cost estimator
A cost estimator is responsible for collecting and analyzing data to estimate the time and resources needed to manufacture a product. Naturally, a cost estimator has to be good at reading, analyzing, and maintaining records of estimated and actual costs.
The advanced Excel skills to look for in a cost estimator:
- Pivot tables
- VLOOKUP, INDEX, and MATCH functions
- Conditional formatting
Example job description text:
“For this role, you need to know how to create and modify pivot tables and report data from them. You should also be familiar with VLOOKUP, INDEX, and MATCH Excel functions. It will also be best if you have mastered conditional formatting in Excel.”
5. Information clerk
An information clerk performs clerical tasks like maintaining records, collecting data, and helping customers with data and information management.
The advanced Excel skills to look for in an information clerk:
- VLOOKUP, INDEX, and MATCH functions
- Conditional formatting
- Pivot tables
Example job description text:
“For this role, you need to have a strong understanding of Excel’s VLOOKUP, INDEX, and MATCH functions. You should also know how to use conditional formatting and advanced charts in Excel.”
6. Accountant or auditor
Accountants and auditors analyze financial statements and documents to make sure it’s accurate and up to date. They also file important financial data and submit tax returns.
The advanced Excel skills to look for in an accountant or auditor:
- Accounting functions
- VLOOKUP, INDEX, and MATCH functions
Example job description text:
“For this role, you need to have a strong understanding of Excel’s accounting functions. You should also know how to use VLOOKUP, INDEX, and MATCH functions in Excel.”
Hire the right Excel expert
As we’ve seen, different job roles require different advanced Excel skills. The good news is that you don’t need to be an Excel expert yourself to assess candidates on their expertise.
With a combination of pre-employment screening questions and tailored practical exams, you can assess whether a candidate has the advanced skills your open role requires. These objective results will help you evaluate each candidate individually and rank all your candidates based on expertise to make the right hiring decision for your role.
Hire the best candidates
with TestGorilla.
Create pre-employment assessments in minutes to screen candidates, save time, and hire the best talent.
Try for free