
На чтение 7 мин Просмотров 249к.
В статье подробно расскажем про дисконтирование денежных потоков, формулу расчета и анализа в Excel.
Содержание
- Дисконтирование денежных потоков. Определение
- Как рассчитать коэффициент дисконтирования?
- Дисконтирование денежных потоков. Формула расчета
- Расчет нормы дохода (r) для дисконтирования денежных потоков
- Пример расчета дисконтированного денежного потока в Excel
- Методы инвестиционного анализа, использующие дисконтированные денежные потоки
- Достоинства и недостатки показателя DCF дисконтирования денежных потоков
Дисконтирование денежных потоков. Определение
Дисконтирование денежных потоков (англ. Discounted cash flow, DCF, дисконтированная стоимость) – это приведение стоимости будущих (ожидаемых) денежных платежей к текущему моменту времени. Дисконтирование денежных потоков основывается на важном экономическом законе убывающей стоимости денег. Другими словами, со временем деньги теряют свою стоимость по сравнению с текущей, поэтому необходимо за точку отсчета взять текущий момент оценки и все будущие денежные поступления (прибыли/убытки) привести к настоящему времени. Для этих целей используют коэффициент дисконтирования.
Как рассчитать коэффициент дисконтирования?
★ Инвестиционная оценка в Excel. Расчет NPV, IRR, DPP, PI за 5 минут Коэффициент дисконтирования используется для приведения будущих доходов к текущей стоимости за счет перемножения коэффициента дисконтирования и потоков платежей. Ниже показана формула расчета коэффициента дисконтирования:  где: r – ставка дисконтирования, i – номер временного периода.
Дисконтирование денежных потоков. Формула расчета
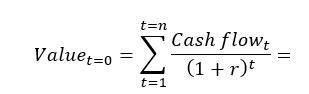
 где: DCF (Discounted cash flow) – дисконтированный денежный поток; CF (Cash Flow) – денежный поток в период времени I; r – ставка дисконтирования (норма дохода); n – количество временных периодов, по которым появляются денежные потоки. Ключевым элементов в формуле дисконтирования денежных потоков является ставка дисконтирования. Ставка дисконтирования показывает, какую норму прибыли следует ожидать инвестору при вложении в тот или иной инвестиционный проект. Ставка дисконтирования использует множество факторов, которые зависят от объекта оценки, и может в себя включать: инфляционную составляющую, доходность по безрисковым активам, дополнительную норму прибыли за риск, ставку рефинансирования, средневзвешенную стоимость капитала, процент по банковским вкладам и т.д.
Расчет нормы дохода (r) для дисконтирования денежных потоков
Существует достаточно много различных способов и методов оценки ставки дисконтирования (нормы дохода) в инвестиционном анализе. Рассмотрим более подробно достоинства и недостатки некоторых методов расчета нормы доходности. Данный анализ представлен в таблице ниже.
|
Методы оценки ставки дисконтирования |
Достоинства |
Недостатки |
| Модели CAPM | Возможность учета рыночного риска | Однофакторность, необходимость наличия обыкновенных акций на фондовом рынке |
| Модель Гордона | Простота расчета | Необходимость наличия обыкновенных акций и постоянных дивидендных выплат |
| Модель средневзвешенной стоимости капитала (WACC) | Учет нормы дохода как собственного, так и заемного капитала | Сложность оценки доходности собственного капитала |
| Модель ROA, ROE, ROCE, ROACE | Возможность учета рентабельности капиталов проекта | Не учет дополнительных макро, микро факторов риска |
| Метод E/P | Учет рыночного риска проекта | Наличие котировок на фондовом рынке |
| Метод оценки премий на риск | Использование дополнительных критериев риска в оценке ставки дисконтирования | Субъективность оценки премии за риск |
| Метод оценки на основе экспертных заключений | Возможность учесть слабоформализуемые факторы риска проекта | Субъективность экспертной оценки |
Вы можете более подробно узнать про подходы в расчете ставки дисконтирования в статье «Ставка дисконтирования.10 современных методов оценки».
Пример расчета дисконтированного денежного потока в Excel
Для того чтобы рассчитать дисконтированные денежные потоки необходимо по выбранному временному периоду (в нашем случае годовые интервалы) расписать подробно все ожидаемые положительные и отрицательные денежные платежи (CI – Cash Inflow, CO – Cash Outflow). За денежные потоки в оценочной практике берут следующие платежи:
- Чистый операционный доход;
- Чистый поток наличности за исключением затрат на эксплуатацию, земельного налога и реконструирования объекта;
- Облагаемая налогом прибыль.
В отечественной практике, как правило, используют период 3-5 лет, в иностранной практике период оценки составляет 5-10 лет. Введенные данные являются базой для дальнейшего расчета. На рисунке ниже показан пример ввода первоначальных данных в Excel.

На следующем этапе рассчитывается денежный поток по каждому из временных периодов (колонка D). Одной из ключевых задач оценки денежных потоков является расчет ставки дисконтирования, в нашем случае она составляет 25%. И была получена по следующей формуле: Ставка дисконтирования = Безрисковая ставка + Премия за риск За безрисковую ставку была взята ключевая ставка ЦБ РФ. Ключевая ставка ЦБ РФ на настоящий момент составляет 15% и премия за риски (производственные, технологические, инновационные и др.) была рассчитана экспертно на уровне 10%. Ключевая ставка отражает доходность по безрисковому активу, а премия за риск показывает дополнительную норму прибыли на существующие риски проекта. Более подробно узнать про расчет безрисковой ставки можно в следующей статье: «Безрисковая ставка доходности. 5 современных методов расчета» После необходимо привести полученные денежные потоки к первоначальному периоду, то есть умножить их на коэффициент дисконтирования. В результате сумма всех дисконтированных денежных потоков даст дисконтированную стоимость инвестиционного объекта. Формулы расчета будут следующие: Денежный поток (CF) = B6-C6 Дисконтированный денежный поток (DCF) = D6/(1+$C$3)^A6 Суммарный дисконтированный денежный поток (DCF) = СУММ(E6:E14)

В результате расчета мы получили дисконтированную стоимость всех денежных потоков (DCF) равную 150 981 руб. Данный денежный поток имеет положительное значение, это свидетельствует о возможности дальнейшего анализа. При проведении инвестиционного анализа необходимо сопоставить итоговые значения дисконтированного денежного потока по различным альтернативным проектам, это позволит проранжировать их по степени привлекательности и эффективности в создании стоимости.
Методы инвестиционного анализа, использующие дисконтированные денежные потоки
Следует заметить, что дисконтированный денежный поток (DCF) в своей формуле расчета сильно походит на чистый дисконтированный доход (NPV). Главное отличие заключается во включении первоначальных инвестиционных затрат в формулу NPV. Дисконтированный денежный поток (DCF) используется во многих методах оценки эффективности инвестиционных проектов. Из-за того, что данные методы используют дисконтирование денежных потоков, их называют динамическими.
- Динамические методы оценки инвестиционных проектов
- Чистый дисконтированный доход (NPV, Net Present Value)
- Внутренняя норма прибыли (IRR, Internal Rate of Return)
- Индекс прибыльности (PI, Profitability index)
- Эквивалент ежегодной ренты (NUS, Net Uniform Series)
- Чистая норма доходности (NRR, Net Rate of Return)
- Чистая будущая стоимость (NFV, Net Future Value)
- Дисконтированный срок окупаемости (DPP, Discounted Payback Period)
Более подробно узнать про методы расчета эффективности инвестиционных проектов вы можете в статье «6 методов оценки эффективности инвестиций в Excel. Пример расчета NPV, PP, DPP, IRR, ARR, PI». Помимо только дисконтирования денежных потоков существую более сложные методы, которые в дополнение учитывают реинвестирование денежных платежей.
- Модифицированная чистая норма рентабельности (MNPV, Modified Net Rate of Return)
- Модифицированная норма прибыли (MIRR, Modified Internal Rate of Return)
- Модифицированный чистый дисконтированный доход (MNPV, Modified Present Value)
Достоинства и недостатки показателя DCF дисконтирования денежных потоков
+) Использование ставки дисконтирования является несомненным достоинством данного метода, так как позволяет привести будущие платежи к текущей стоимости и учесть возможные факторы риска при оценке инвестиционной привлекательности проекта. -) К недостаткам можно отнести сложность прогнозирования будущих денежных потоков по инвестиционному проекту. К тому же трудно отразить в ставке дисконтирования изменения внешней среды. Резюме Дисконтирование денежных потоков является основой для расчета многих коэффициентов оценки инвестиционной привлекательности проекта. Мы разобрали на примере алгоритм расчета дисконтированных денежных потоков в Excel, их существующие достоинства и недостатки. С вами был Иван Жданов, спасибо за внимание.
Автор: к.э.н. Жданов Иван Юрьевич
What is a DCF Model?
The Discounted Cash Flow Model, or “DCF Model”, is a type of financial model that values a company by forecasting its cash flows and discounting them to arrive at a current, present value.
DCFs are widely used in both academia and in practice.
Valuing companies using a DCF model is considered a core skill for investment bankers, private equity, equity research and “buy side” investors.
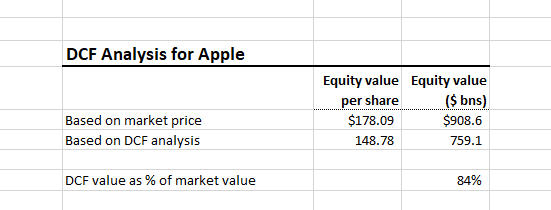
This DCF analysis suggests that Apple might be overvalued (or that our assumptions are wrong!)
A DCF model estimates a company’s intrinsic value (the value based on a company’s ability to generate cash flows) and is often presented in comparison to the company’s market value.
For example, Apple has a market capitalization of approximately $909 billion. Is that market price justified based on the company’s fundamentals and expected future performance (i.e. its intrinsic value)? That is exactly what a DCF seeks to answer.
In contrast with market-based valuation like a comparable company analysis, the idea behind the DCF model is that the value of a company is not a function of arbitrary supply and demand for that company’s stock. Instead, the value of a company is a function of a company’s ability to generate cash flow in the future for its shareholders.
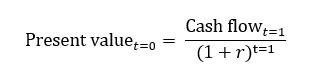
DCF Model Basics: Present Value Formula
The DCF approach requires that we forecast a company’s future cash flows and discount them to the present in order to arrive at a present value for the company. That present value is the amount investors should be willing to pay (the company’s value). We can express this formulaically as the follwoing (we denote the discount rate as r):
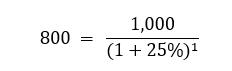
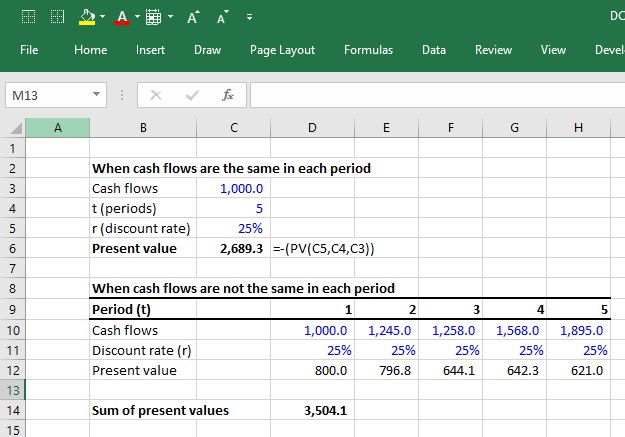
So, let’s say you decide you’re willing to pay $800 for the below. We can solve this as:
If I make the same proposition but instead of only promising $1,000 next year, say I promise $1,000 for the next 5 years.The math gets only slightly more complicated:
In Excel, you can calculate this using the PV function (see below). However, if cash flows are different each year, you will have to discount each cash flow separately:
Learn More → Investment Banking Primer
DCF Model in Excel – Sample Template Download
Use the form below to download our sample DCF model template:
How to Build a DCF Model: 6-Step Framework
The premise of the DCF model is that the value of a business is purely a function of its future cash flows. Thus, the first challenge in building a DCF model is to define and calculate the cash flows that a business generates. There are two common approaches to calculating the cash flows that a business generates.
- Unlevered DCF approach
Forecast and discount the operating cash flows. Then, when you have a present value, just add any non-operating assets such as cash and subtract any financing-related liabilities such as debt. - Levered DCF approach
Forecast and discount the cash flows that remain available to equity shareholders after cash flows to all non-equity claims (i.e. debt) have been removed.
Both should theoretically lead to the same value at the end (though in practice it’s actually pretty hard to get them to be exactly equal). The unlevered DCF approach is the most common and is thus the focus of this guide. This approach involves 6 steps:
Step 1. Forecasting unlevered free cash flows
- Step 1 is to forecast the cash flows a company generates from its core operations after accounting for all operating expenses and investments.
- These cash flows are called “unlevered free cash flows.”
Step 2. Calculating the terminal value
- You can’t keep forecasting cash flows forever. At some point, you must make some high-level assumptions about cash flows beyond the final explicit forecast year by estimating a lump-sum value of the business past the explicit forecast period.
- That lump sum is called the “terminal value.”
Step 3. Discounting the cash flows to the present at the weighted average cost of capital
- The discount rate that reflects the riskiness of the unlevered free cash flows is called the weighted average cost of capital.
- Because unlevered free cash flows represent all operating cash flows, these cash flows “belong” to both the company’s lenders and owners.
- As such, the risks of both providers of capital (i.e. debt vs. equity) need to be accounted for using appropriate capital structure weights (hence the term “weighted average” cost of capital).
- Once discounted, the present value of all unlevered free cash flows is called the enterprise value.
Step 4. Add the value of non-operating assets to the present value of unlevered free cash flows
- If a company has any non-operating assets such as cash or has some investments just sitting on the balance sheet, we must add them to the present value of unlevered free cash flows.
- For example, if we calculate that the present value of Apple’s unlevered free cash flows is $700 billion, but then we discover that Apple also has $200 billion in cash just sitting around, we should add this cash.
Step 5. Subtract debt and other non-equity claims
- The ultimate goal of the DCF is to get at what belongs to the equity owners (equity value).
- Therefore if a company has any lenders (or any other non-equity claims against the business), we need to subtract this from the present value.
- What’s left over belongs to the equity owners.
- In our example, if Apple had $50 billion in debt obligations at the valuation date, the equity value would be calculated as:
- $700 billion (enterprise value) + $200 billion (non-operating assets) – $50 (debt) = $850 billion
- Often, the non-operating assets and debt claims are added together as one term called net debt (debt and other non-equity claims – non-operating assets).
- You’ll often see the equation: enterprise value – net debt = equity value. The equity value that the DCF calculates is comparable to the market capitalization (the market’s perception of the equity value).
Step 6. Divide the equity value by the shares outstanding
- The equity value tells us what the total value to owners is. But what is the value of each share? In order to calculate this, we divide the equity value by the company’s diluted shares outstanding.
Calculating Unlevered Free Cash Flows (FCF)
Here is the formula for unlevered free cash flow:
FCF = EBIT x (1- tax rate) + D&A + NWC – Capital expenditures
- EBIT = Earnings before interest and taxes. This represents a company’s GAAP-based operating profit.
- Tax rate = The tax rate the company is expected to face. When forecasting taxes, we usually use a company’s historical effective tax rate.
- D&A = Depreciation and amortization.
- NWC = Annual changes in net working capital. Increases in NWC are cash outflows while decreases are cash inflows.
- Capital expenditures represent cash investments the company must make in order to sustain the forecasted growth of the business. If you don’t factor in the cost of required reinvestment into the business, you will overstate the value of the company by giving it credit for EBIT growth without accounting for the investments required to achieve it.
FCFs are ideally driven from a 3-statement model
Forecasting all these line items should ideally come from a 3-statement model because all of the components of unlevered free cash flows are interrelated: Changes in EBIT assumptions impact capex, NWC, and D&A. Without a 3-statement model that dynamically links all these components together, it is difficult to ensure that the changes in assumptions of one component correctly impact the other components.
Because this takes more work and more time, finance professionals often do preliminary analyses using a quick, back-of-the-envelope DCF model and only build a full DCF model driven by a 3-statement model when the stakes are high, such as when an investment banking deal goes “live” or when a private equity firm is in the later stages of the investment process.
The 2-stage DCF model
The 3-statement models that support a DCF are usually annual models that forecast about 5-10 years into the future. However, when valuing businesses, we usually assume they are a going concern. In other words, the assumption is that they will continue to operate forever.
That means that the 3-statement model only takes us so far. We also have to forecast the present value of all future unlevered free cash flows after the explicit forecast period. This is called the 2-stage DCF model. The first stage is to forecast the unlevered free cash flows explicitly (and ideally from a 3-statement model). The second stage is the total of all cash flows after stage 1. This typically entails making some assumptions about the company reaching mature growth. The present value of the stage 2 cash flows is called the terminal value.
Prefer video? To watch a free video lesson on how to build a DCF, click here.
Calculating the terminal value
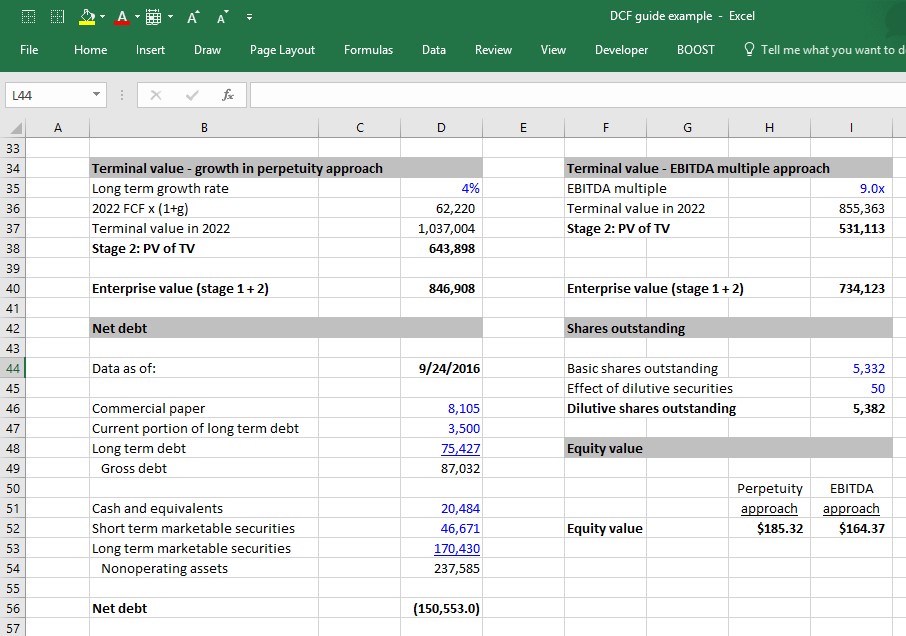
In a DCF, the terminal value (TV) represents the value the company will generate from all the expected free cash flows after the explicit forecast period. Imagine that we calculate the following unlevered free cash flows for Apple:
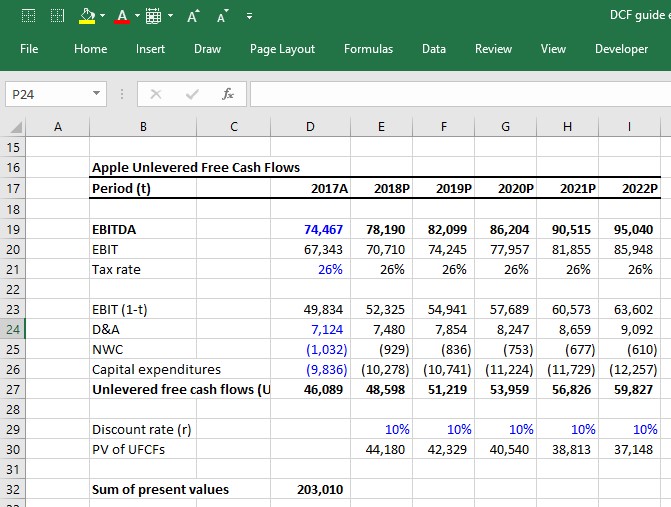
Apple is expected to generate cash flows beyond 2022, but we cannot project FCFs forever (with any degree of accuracy). So how do we estimate the value of Apple beyond 2022? There are two common approaches:
- Growth in Perpetuity
- Exit EBITDA Multiple Method
The growth in perpetuity approach
The growth in perpetuity approach assumes Apple’s UFCFs will grow at some constant growth rate assumption from 2022 to … forever. The formula for calculating the present value of a cash flow growing at a constant growth rate in perpetuity is called the “Growth in perpetuity formula”:
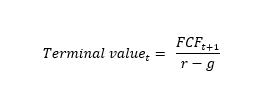
If we assume that after 2022, Apple’s UFCFs will grow at a constant 4% rate into perpetuity and will face a weighted average cost of capital of 10% in perpetuity, the terminal value (which is the present value of all Apple’s future cash flows beyond 2022) is calculated as:
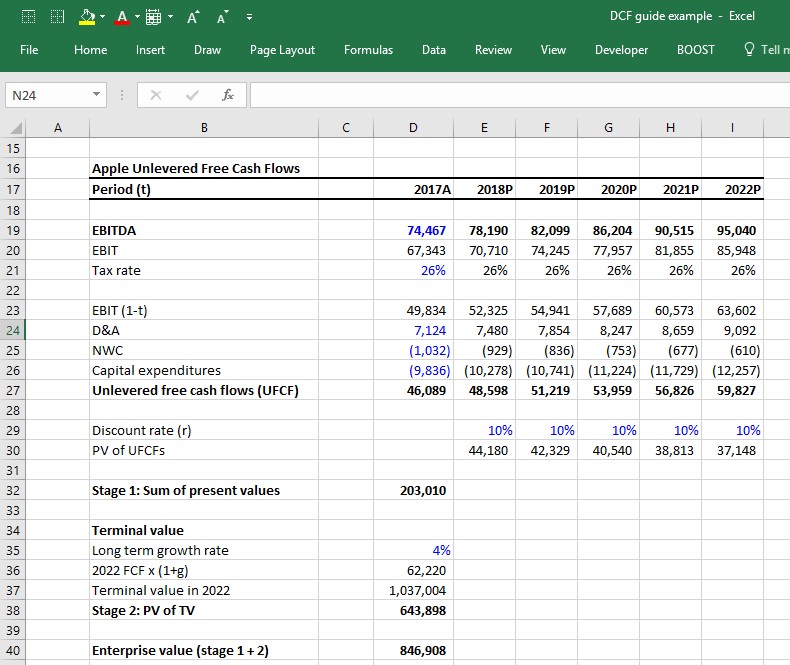
At this point, notice that we have finally calculated enterprise value as simply the sum of the stage 1 present value of UFCFs + the present value of the stage 2 terminal value.
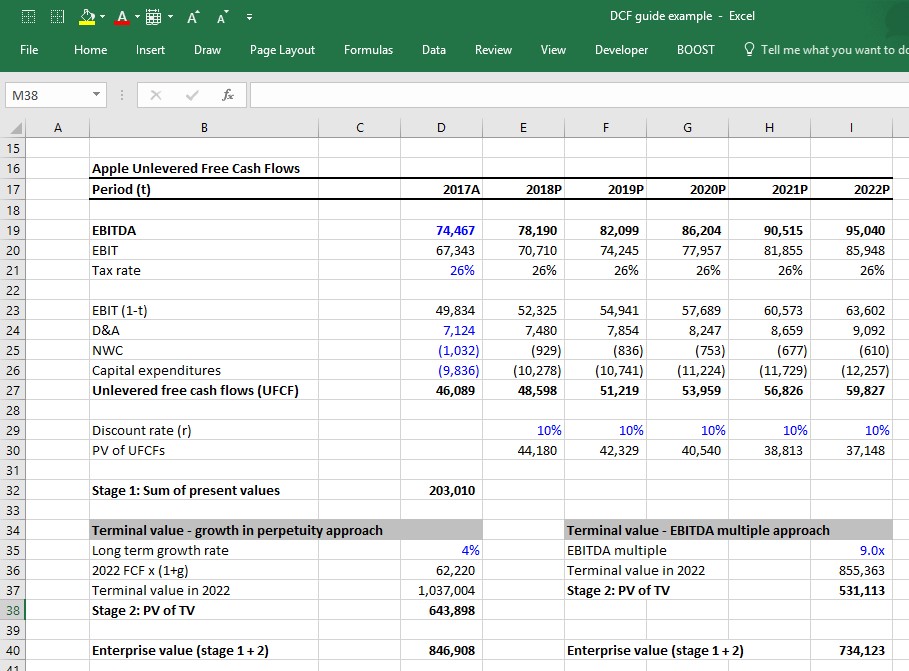
Exit EBITDA Multiple Method
The growth in perpetuity approach forces us to guess the long-term growth rate of a company. The result of the analysis is very sensitive to this assumption. A way around having to guess a company’s long term growth rate is to guess the EBITDA multiple the company will be valued at the last year of the stage 1 forecast.
A common way to do this is to look at the current EV/EBITDA multiple the company is trading at (or the average EV/EBITDA multiple of the company’s peer group) and assume the company will be valued at that same multiple in the future. For example, if Apple is currently valued at 9.0x its last twelve months (LTM) EBITDA, we can assume that in 2022 it will be valued at 9.0x its 2022 EBITDA.
Growth in perpetuity vs. exit EBITDA multiple method
Investment bankers and private equity professionals tend to be more comfortable with the EBITDA multiple approach because it infuses market reality into the DCF. A private equity professional building a DCF will likely try to figure out what he/she can sell the company for 5 years down the road, so this arguably provides a valuation via an EBITDA multiple.
However, this approach suffers from a significant conceptual problem: It incorporates current market valuations within the DCF, which arguably defeats the whole purpose of the DCF. Making matters worse is the fact that the terminal value often represents a significant pecentage of the value contribution in a DCF, so the assumptions that go into calculating the terminal value are all the more important.
Getting to enterprise value: Discounting the cash flows by the WACC
Up to now, we’ve been assuming a 10% discount rate for Apple, but how is that actually quantified? Quantifying the discount rate, which in this case is the weighted average cost of capital (WACC), is a critical field of study in corporate finance. You can spend an entire college semester learning about it. We’ve written a complete guide to WACC here, but below are the basic elements for how it is typically calculated:
The WACC formula
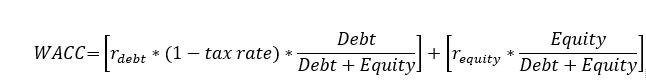
Where:
- Debt = market value of debt
- Equity = market value of equity
- rdebt = cost of debt
- requity = cost of equity
Getting to equity value: Adding the value of non-operating assets
Many companies have assets not directly tied to operations. Assets such as cash obviously increase the value of the company (i.e. a company whose operations are worth $1 billion but also has $100 million in cash is worth $1.1 billion). But up to now, the value is not accounted for in the unlevered free cash flow calculation. Therefore, these assets need to be added to the value. The most common non-operating assets include:
- Cash
- Marketable securities
- Equity investments
Below is Apple’s 2016 year-end balance sheet. The non-operating assets are its cash and equivalents, short-term marketable securities and long-term marketable securities. As you can see, they represent a significant portion of the company’s balance sheet.
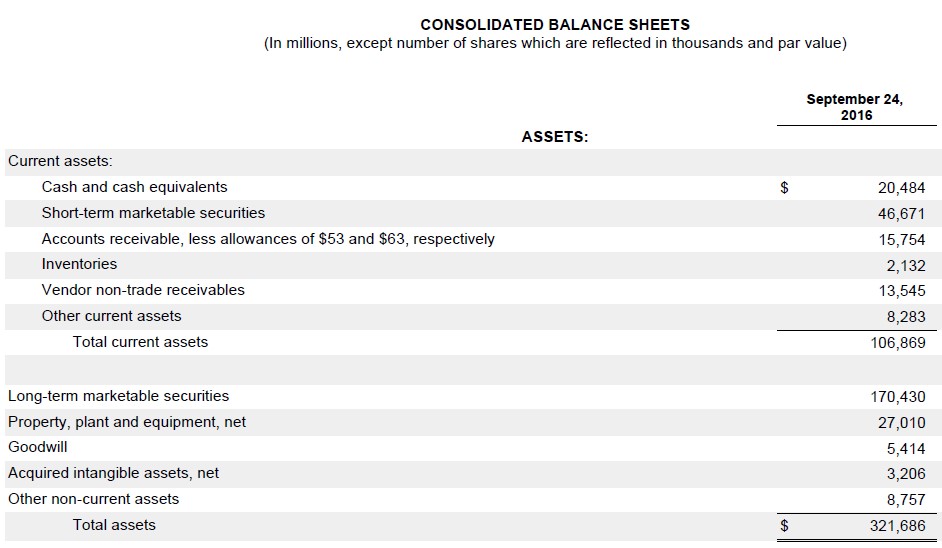
Unlike operating assets such as PP&E, inventory and intangible assets, the carrying value of non-operating assets on the balance sheet is usually fairly close to their actual value. That’s because they are mostly comprised of cash and liquid investments that companies generally can mark up to fair value. That’s not always the case (equity investments are a notable exception), but it’s typically safe to simply use the latest balance sheet values of non-operating assets as the actual market values.
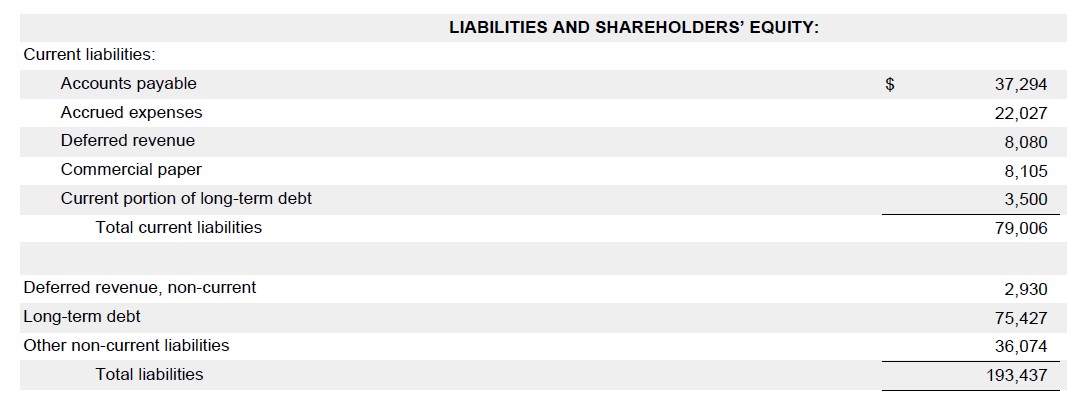
Getting to equity value: Subtracting debt and other non-equity claims
At this point, we need to identify and subtract all non-equity claims on the business in order to arrive at how much of the company value actually belongs to equity owners. The most common non-equity claims you’ll encounter are:
- All debt (short term, long term, bonds, loans, etc..)
- Capital Leases
- Preferred stock
- Non-controlling (minority) interests
Below are Apple’s 2016 year-end balance sheet liabilities. You can see it includes commercial paper, current portion of long term debt and long term debt. These are the three items that would make up Apple’s non-equity claims.
As with the non-operating assets, finance professionals usually just use the latest balance sheet values of these items as a proxy for their actual values. This is usually a safe approach when the market values are fairly close to the balance sheet values. The market value of debt doesn’t usually deviate too much from the book value unless market interest rates have changed dramatically since the issue or if the company’s credit profile has changed dramatically (i.e. a company in financial distress will have its debt trading at pennies on the dollar).
One place where the book value-as-proxy-for-market-value can be dangerous is with “non-controlling interests.” Non-controlling interests are usually understated on the balance sheet. If they are significant, it is preferable to apply an industry multiple to better reflect their true value.
The bad news is that we rarely have enough insight into the nature of the non-controlling interests’ operations to figure out the right multiple to use. The good news is that non-controlling interests are rarely large enough to make a significant difference in valuation (most companies don’t have any).
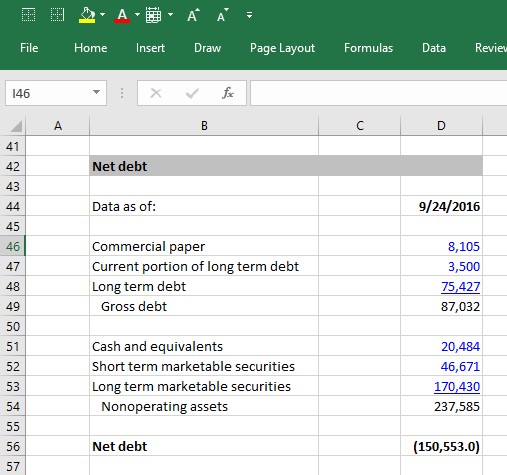
Net debt formula
When building a DCF model, finance professionals often net non-operating assets against non-equity claims and call it net debt, which is subtracted from enterprise value to arrive at equity value:
Enterprise value – net debt = Equity value
The formula for net debt is simply the value of all nonequity claims less the value of all non-operating assets:
- Gross Debt (short term, long term, bonds, loans, etc..)
- + Capital Leases
- + Preferred stock
- + Non-controlling (minority) interests
- – Cash
- – Marketable securities
- – Equity investments
- Net debt
Using Apple’s 2016 10K, we can see that it has a substantial negative net debt balance. For companies that carry significant debt, a positive net debt balance is more common, while a negative net debt balance is common for companies that keep a lot of cash.
From equity value to equity value per share
Once a company’s equity value has been calculated, the next step is to determine the value of each individual share. In order to figure this out, we have to determine the number of shares that are currently outstanding. We have written a thorough guide to calculating a company’s current shares but will summarize the key steps here:
1. Take the current actual share count from the front cover of the company’s latest annual (10K) or interim (10Q) filing. For Apple, it is:
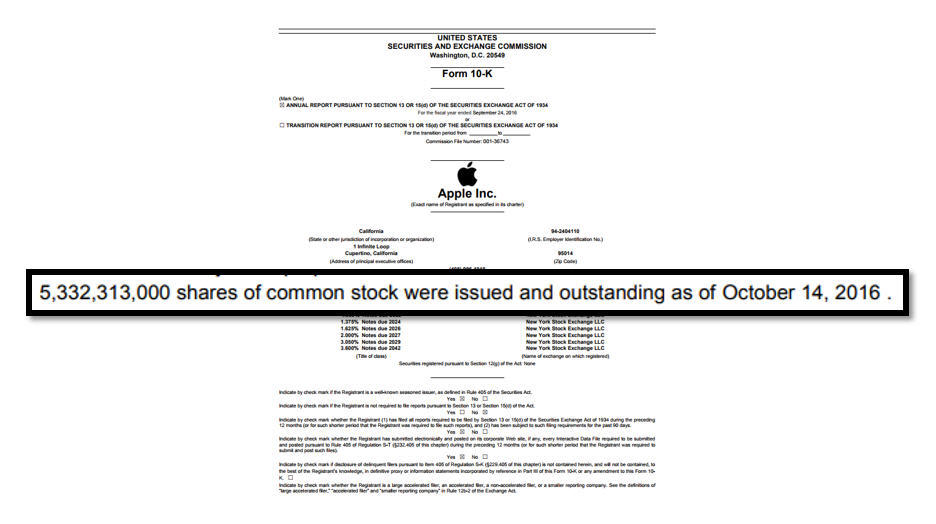
2. Next, add the effect of dilutive shares. These are shares that aren’t quite common stock yet, but that can become common stock and thus be potentially dilutive to the common shareholders (i.e. stock options, warrants, restricted stock and convertible debt and convertible preferred stock).
Assuming that we calculated 50 million dilutive securities for Apple, we can now put all the pieces together and complete the analysis:
Key DCF Assumptions
We have now completed the 6 steps to building a DCF model and have calculated the equity value of Apple.
What were the key assumptions that led us to the value we arrived at?
The three key assumptions in a DCF model are:
- The operating assumptions (revenue growth and operating margins)
- The WACC
- Terminal value assumptions: Long-term growth rate and the exit multiple
Each of these assumptions is critical to getting an accurate model. In fact, the DCF model’s sensitivity to these assumptions, and the lack of confidence finance professionals have in these assumptions, (especially the WACC and terminal value) are frequently cited as the main weaknesses of the DCF model.
Nonetheless, the DCF model is one of the most common models used by investment bankers and other finance professionals, and the DCF output is almost always presented using a range of terminal value and WACC assumptions, as well as in context to other valuation methodologies. A common way this is presented is using a football field valuation matrix.
We wrote this guide for those thinking about a career in finance and those in the early stages of preparing for job interviews. This guide is quite detailed, but it stops short of all corner cases and nuances of a fully-fledged DCF model.

Step-by-Step Online Course
Everything You Need To Master Financial Modeling
Enroll in The Premium Package: Learn Financial Statement Modeling, DCF, M&A, LBO and Comps. The same training program used at top investment banks.
Enroll Today
Do you need to calculate the present value of future cash flows or assess two options that will impact your cash flow over many years? Excel’s a great place to do that and below I’ll show you how you can easily set up a template to calculate discounted cash flow that you can adjust for changes in the discount rate and cash flow. And if you don’t want to create your own template, you can download mine at the bottom of this post.
In this example, I’ll compare a lump sum lottery win versus a scenario where you receive an annual amount for 25 years. Step one is knowing to calculate present value, which is what I’ll cover next:
Calculating the preset value
To calculate the present value of future cash flow, you need to know what discount rate to use. What you can use is the rate that you can earn on a typical investment. For instance, if you invest in stocks and assume you can make 5% per year, on average, then you might want to use that as your discount rate. If you want to be more conservative, you could use a rate of 2%. Below, you’ll see how the discount rate can play a big impact in your calculations.
That’s because when calculating today’s present value, you have to use the discount rate to bring the future value back to what it would be worth today. For example, suppose you were to receive a $10,000 payment a year from now, and your discount rate was 5%. An easy way to calculate this is as follows:
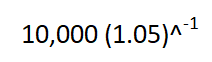
You might see other formulas on the web involving fractions to calculate present value but just using a negative power does the trick. This calculation yields a result of $9,523.81. Because you’re not getting the payment today, the value of that money is worth less than the full amount. Consider that if you were to receive $10,000 today and invest it and earn 5%, then a year from now it would be worth $10,500 — more than if you were to receive the $10,000 in a year.
Now, suppose you used a discount rate of just 2%. In that scenario, the $10,000 payment a year from now would be worth $9,803.92 today. Since the discount rate is lower, there’s less of a cost associated with waiting for your payment. If the discount rate was 0%, then there would be no incentive for you to invest your money since a year from now it would still be worth the same value it is today. That’s why when interest rates fall and get closer to zero, people will be less inclined to keep their money at the bank and there’s more demand for gold — since that can be a better way to store wealth at that point.
Creating a template to calculate discounted cash flow in Excel
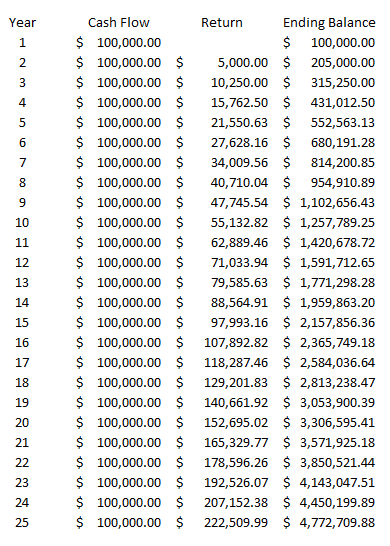
Now that we’ve gone over how to calculate discounted cash flow in Excel, we can set up the template. All that’s really necessary here is to map out the payment schedule, including how much cash you’ll receive every year. Here’s an example scenario of receiving $100,000 for 25 years:
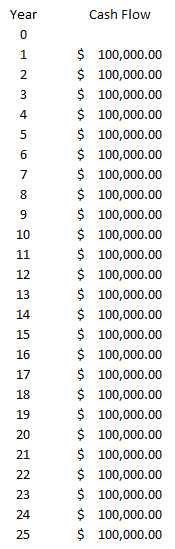
All the payments don’t have to be the same, but for the lottery example, I’m going to keep them that way. What I can do is create another column that will tell me the present value of each one of those payments. To do that, I’ll use a formula that takes the cash flow value, multiples it by the discount rate (I’ll use 5%) raised to a negative power (the year). Here’s how that looks:
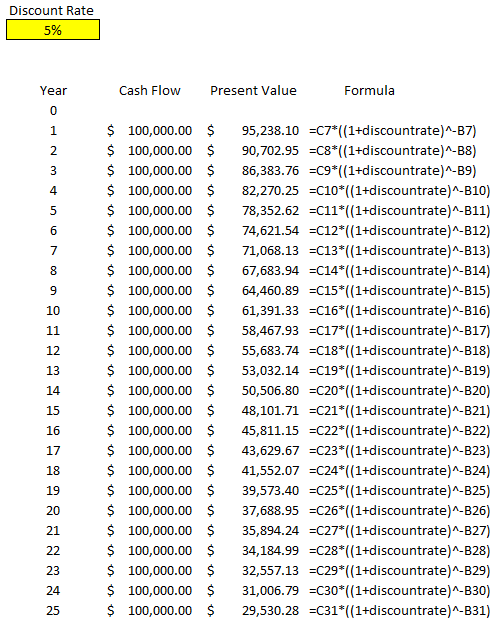
I created a discount rate named range so that it’s easy to reference the percentage and to change it. The only thing left here is to calculate the total of all these payments, to arrive at the present value of all of them:
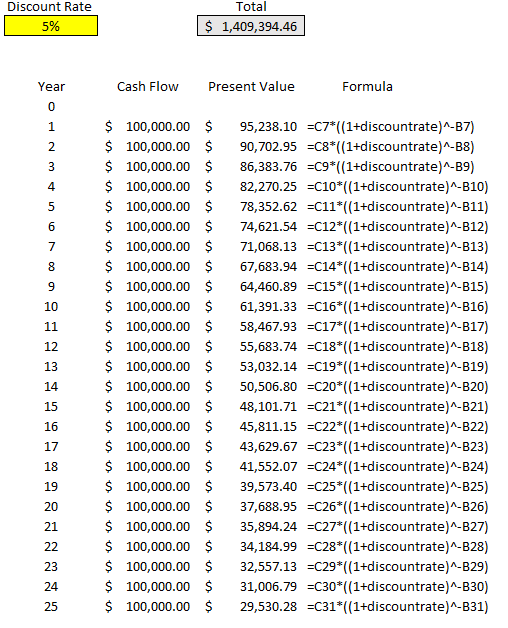
The total present value of the payments comes in at just over $1.4 million. Even though the total of all the payments over 25 years is $2.5 million, we’re losing a lot of that value because of the time value of money, at a rate of 5% per year.
However, let’s prove this out, and to do that let’s look at the future value of all these payments. Let’s assume that these funds will be reinvested and earning a rate of 5% every year. Here’s how much we’d have by the end of year 25:
In this situation, we’re benefitting from compounding and earning 5% on each year’s ending balance, which includes the prior-year return. By the end of year 25, if we were to invest all of these $100,000 payments at a rate of 5%, we’d have a future ending value of $4,772,709.88.
Now, remember, the equivalent of these annual payments is a present value of $1,409,394.46. Let’s assume that rather than receiving annual payments of $100,000, we simply receive a lump sum payment of this and invest it and also earn 5% every year. Here’s how that will look like:
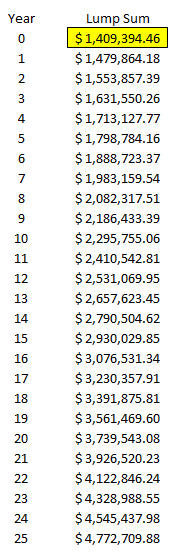
The ending value after 25 years is the same, $4,772,709.88. This tells us that if you’re given the option of 25 annual payments of $100,000 or a lump sum of $1,409,394.46 today, there’s no difference to you (if the discount rate you’re using is 5%). If the discount rate is 2%, then the present value climbs to $1,952,345.65.
As you can see, depending on which discount rate you use, it can have a significant impact on your present value calculations. This template will allow you to quickly change the discount rate and see how the calculation looks under different scenarios. You can also add more years to this calculation by just extending the formulas down. The amounts also don’t need to be identical, they were only set up this way purely for the purpose of comparing lottery winnings in a scenario where you earn one lump sum amount versus equal payments over multiple decades.
If you’d like to download this template to follow along, the free version is available here, which goes up to year 15. For the full and unlocked version, which has no ads and goes up to 30 years, please refer to the product page here.
If you liked this post on how to calculate discounted cash flow in Excel, please give this site a like on Facebook and also be sure to check out some of the many templates that we have available for download. You can also follow us on Twitter and YouTube.
We’ve compiled the most useful free discounted cash flow (DCF) templates, including customizable templates for determining a company’s intrinsic value, investments, and real estate based on expected future cash flows.
Included on this page, you’ll find many helpful discounted cash flow templates with sample data, such as a simple discounted cash flow template, an unlevered cash flow calculation template, and a real estate discounted cash flow template.
Discounted Cash Flow Template
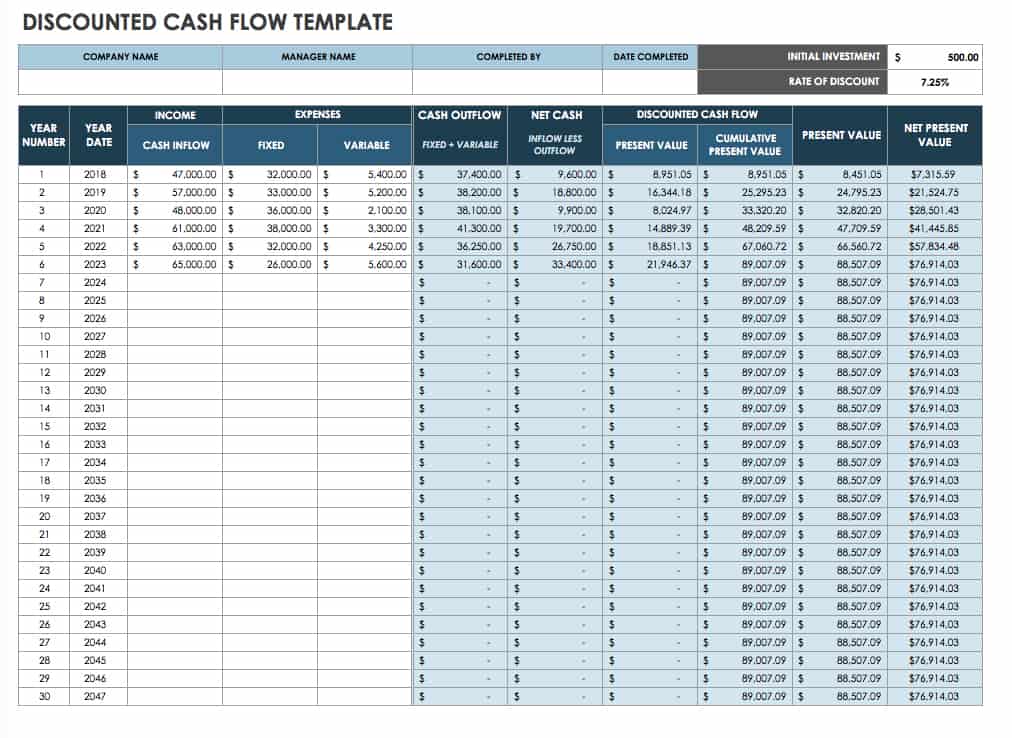
Use this simple, easy-to-complete DCF template for valuing a company, a project, or an asset based on future cash flow. Enter year-by-year income details (cash inflow), fixed and variable expenses, cash outflow, net cash, and discounted cash flow (present value and cumulative present value) to arrive at the net present value of your company, project, or investment. This reusable template is available in Excel and as a Google Sheets template that you can easily save to your Google Drive account and share with others.
Download Discounted Cash Flow Template — Excel
Looking for more information on regular cash flow templates? Visit our article on cash flow statement templates.
Discounted Cash Flow Model Template
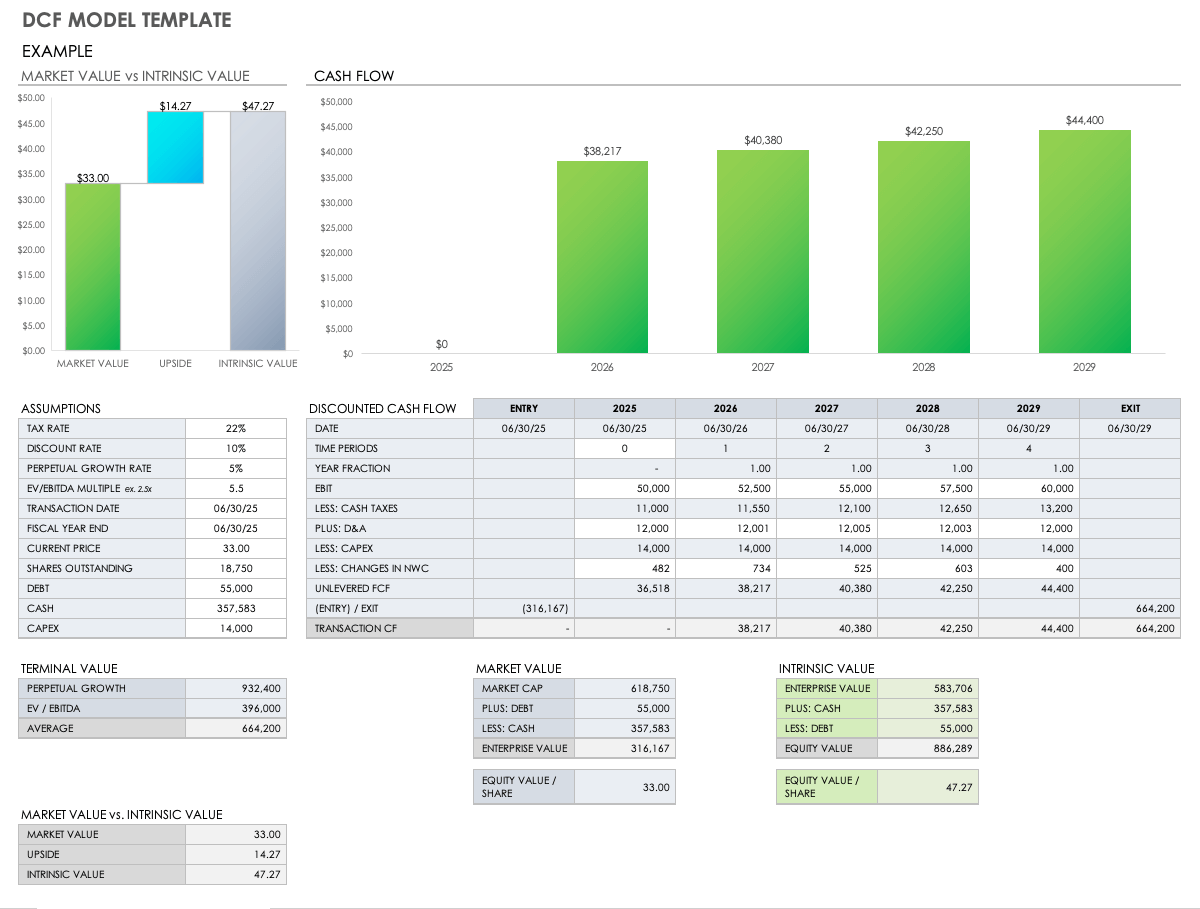
This DCF model template comes with pre-filled example data, which you can replace with your own figures to determine its value today based on assumptions about how it will perform in the future. Enter year-by-year cash flows, assumptions (e.g., tax rate and perpetual growth rate), discounted cash flow data, terminal value (e.g., perpetual growth), and rate of return. The template will then generate a dashboard view of your company or investment’s market value as compared to its intrinsic value. (Market value is the current value of your company with its stock price factored in; intrinsic value is an estimate of the true value of your company, regardless of its market value.)
Download DCF Model Template — Excel
Discounted Cash Flow Analysis Template
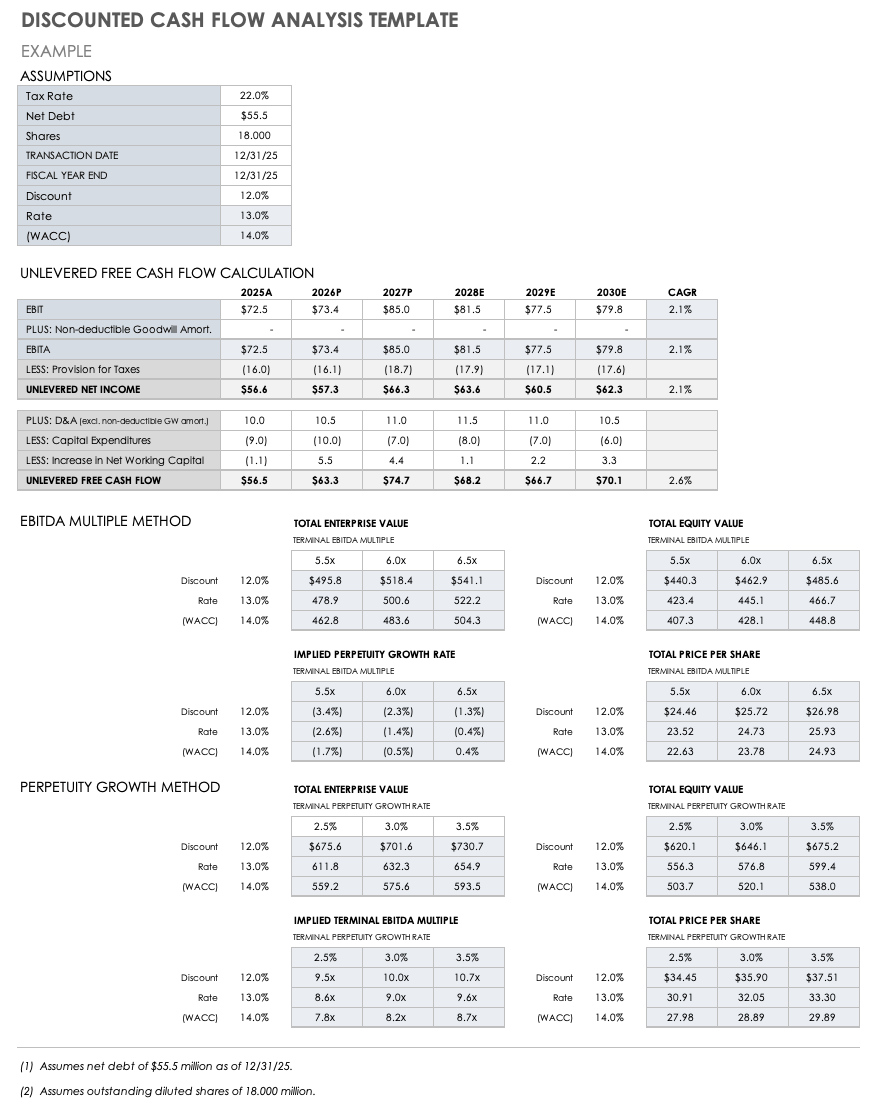
Designed to accurately estimate your company’s intrinsic value compared to its market value, this unique analysis template provides you with the ability to determine whether the market value is justified, based on your company’s fundamentals and projected future performance.
This template includes unlevered free cash flow (UFCF) calculation, which refers to your company’s cash flow prior to accounting for financial obligations. Additionally, it calculates earnings before interest taxes, depreciation and amortization (EBITDA), and a perpetuity growth method, which accounts for the value of free cash flows that grow at an assumed constant rate in perpetuity. In tandem, these three sections provide insight into the true value of your company as a result of projected cash flows.
Download Discounted Cash Flow Analysis Template — Excel
Discounted Cash Flow Valuation Template
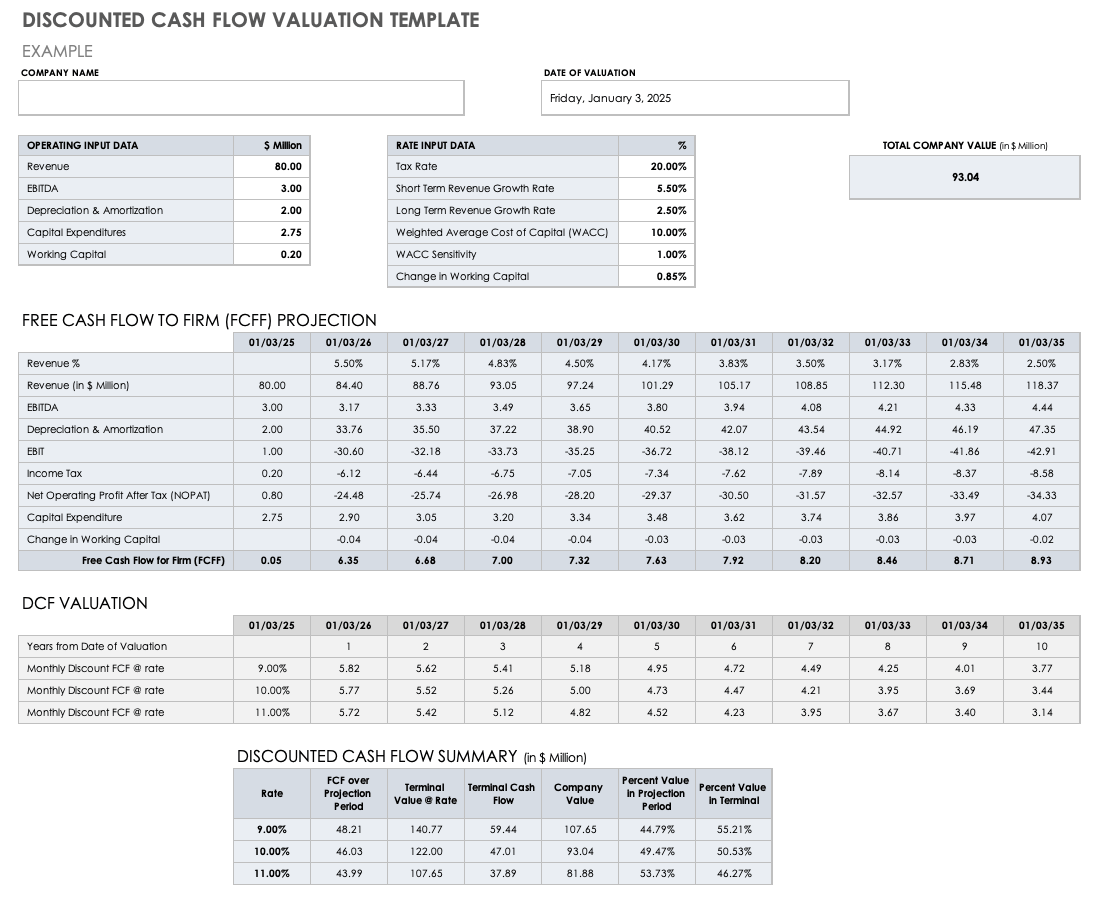
Get an accurate picture of your company’s true value — with projected future cash flows factored in — by using this streamlined DCF valuation template. The template incorporates your company’s future cash generation capacity as compared to current cash flow and allows you to compare your present holdings based on projected cash flows generated over future periods. You can then enter a discount rate (also called cost of capital) to determine your company’s present actual value.
Download Discounted Cash Flow Valuation Template — Excel
Sample Discounted Cash Flow Excel Template
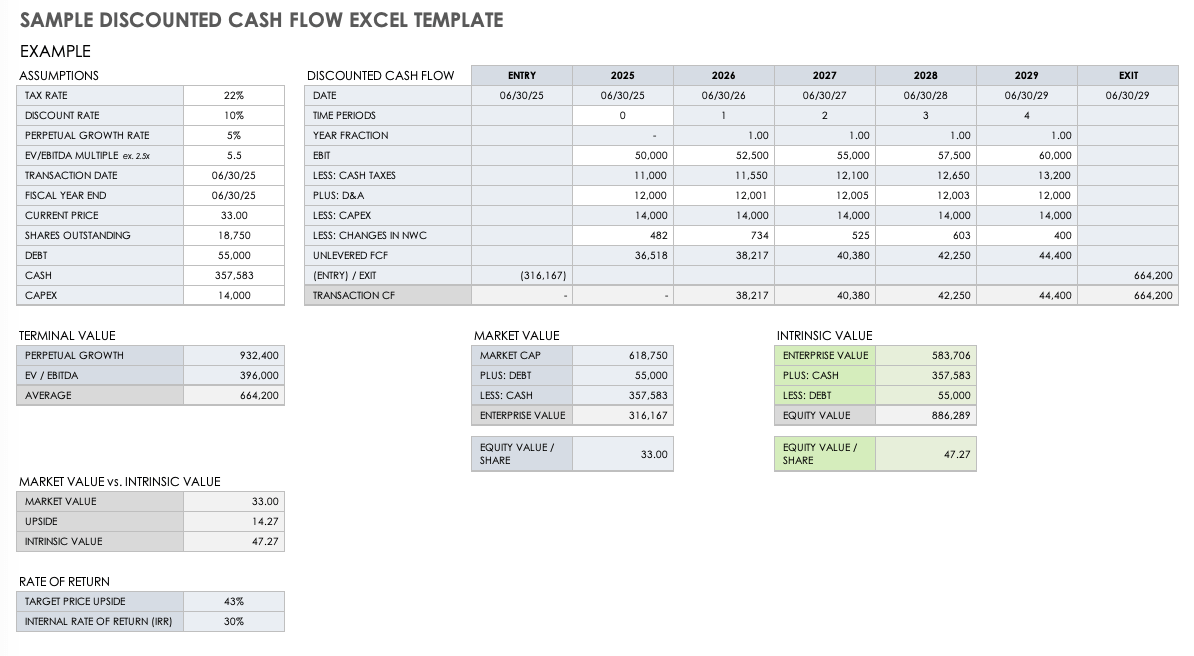
This sample DCF Excel template provides you with an easily scannable view of your company’s or investment’s true value by using the time value of money (TVM), which refers to the preferred benefit of receiving money presently rather than a similar sum at a future date. Net operating loss, free flow, and unlevered free cash flow factors give you an accurate picture of your company’s DCF actual valuation to ensure your company or investment is represented with an accurate financial projection.
Download Sample Discounted Cash Flow Excel Template — Excel
Unlevered Free Cash Flow Calculation Template
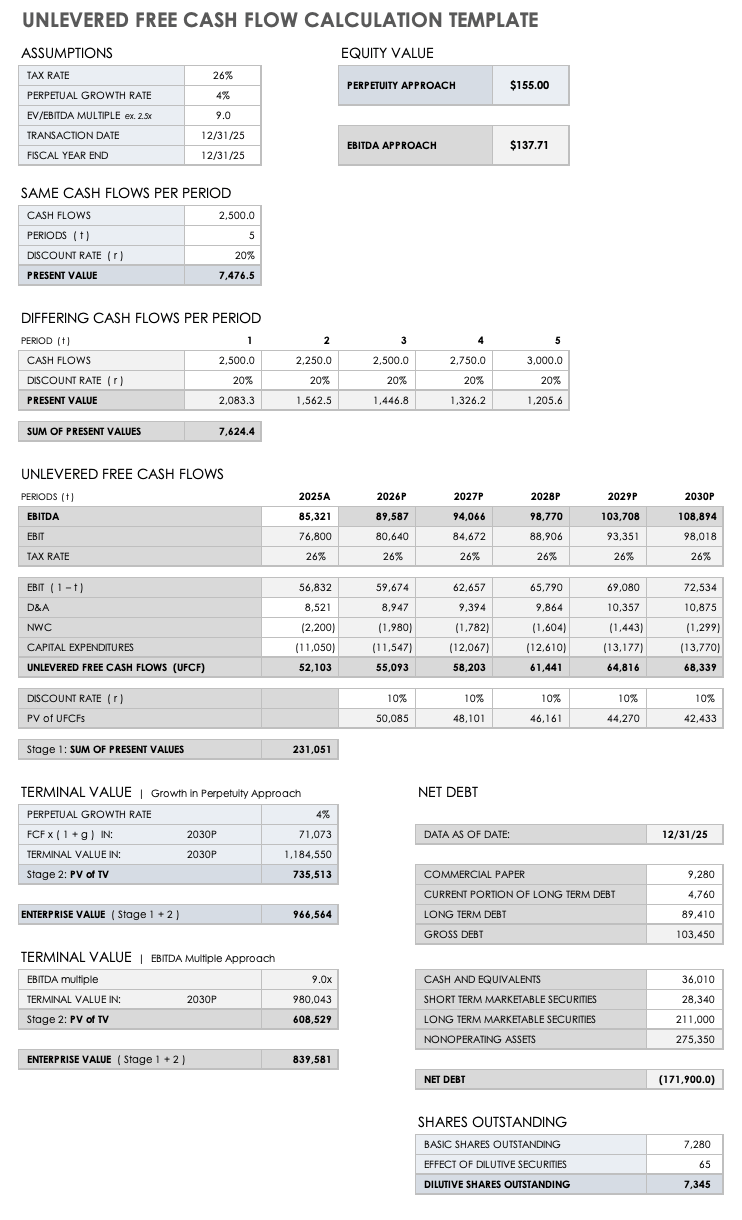
This UFCF calculation template provides you with insight into the tangible and intangible assets generated by your business that are available for distribution to all capital providers. UFCF includes revenue, cost of goods sold (COGS), taxes, depreciation and amortization, alterations in working capital, and capital disbursement. This template includes year-over-year columns intersecting with the following rows: revenue, operating income, earnings before interest and taxes (EBIT), and net operating profit after taxes (NOPAT) — all to pinpoint your business’s UFCF and actual value.
Download Unlevered Free Cash Flow Calculation Template — Excel
Discounted Cash Flow Valuation Model Template
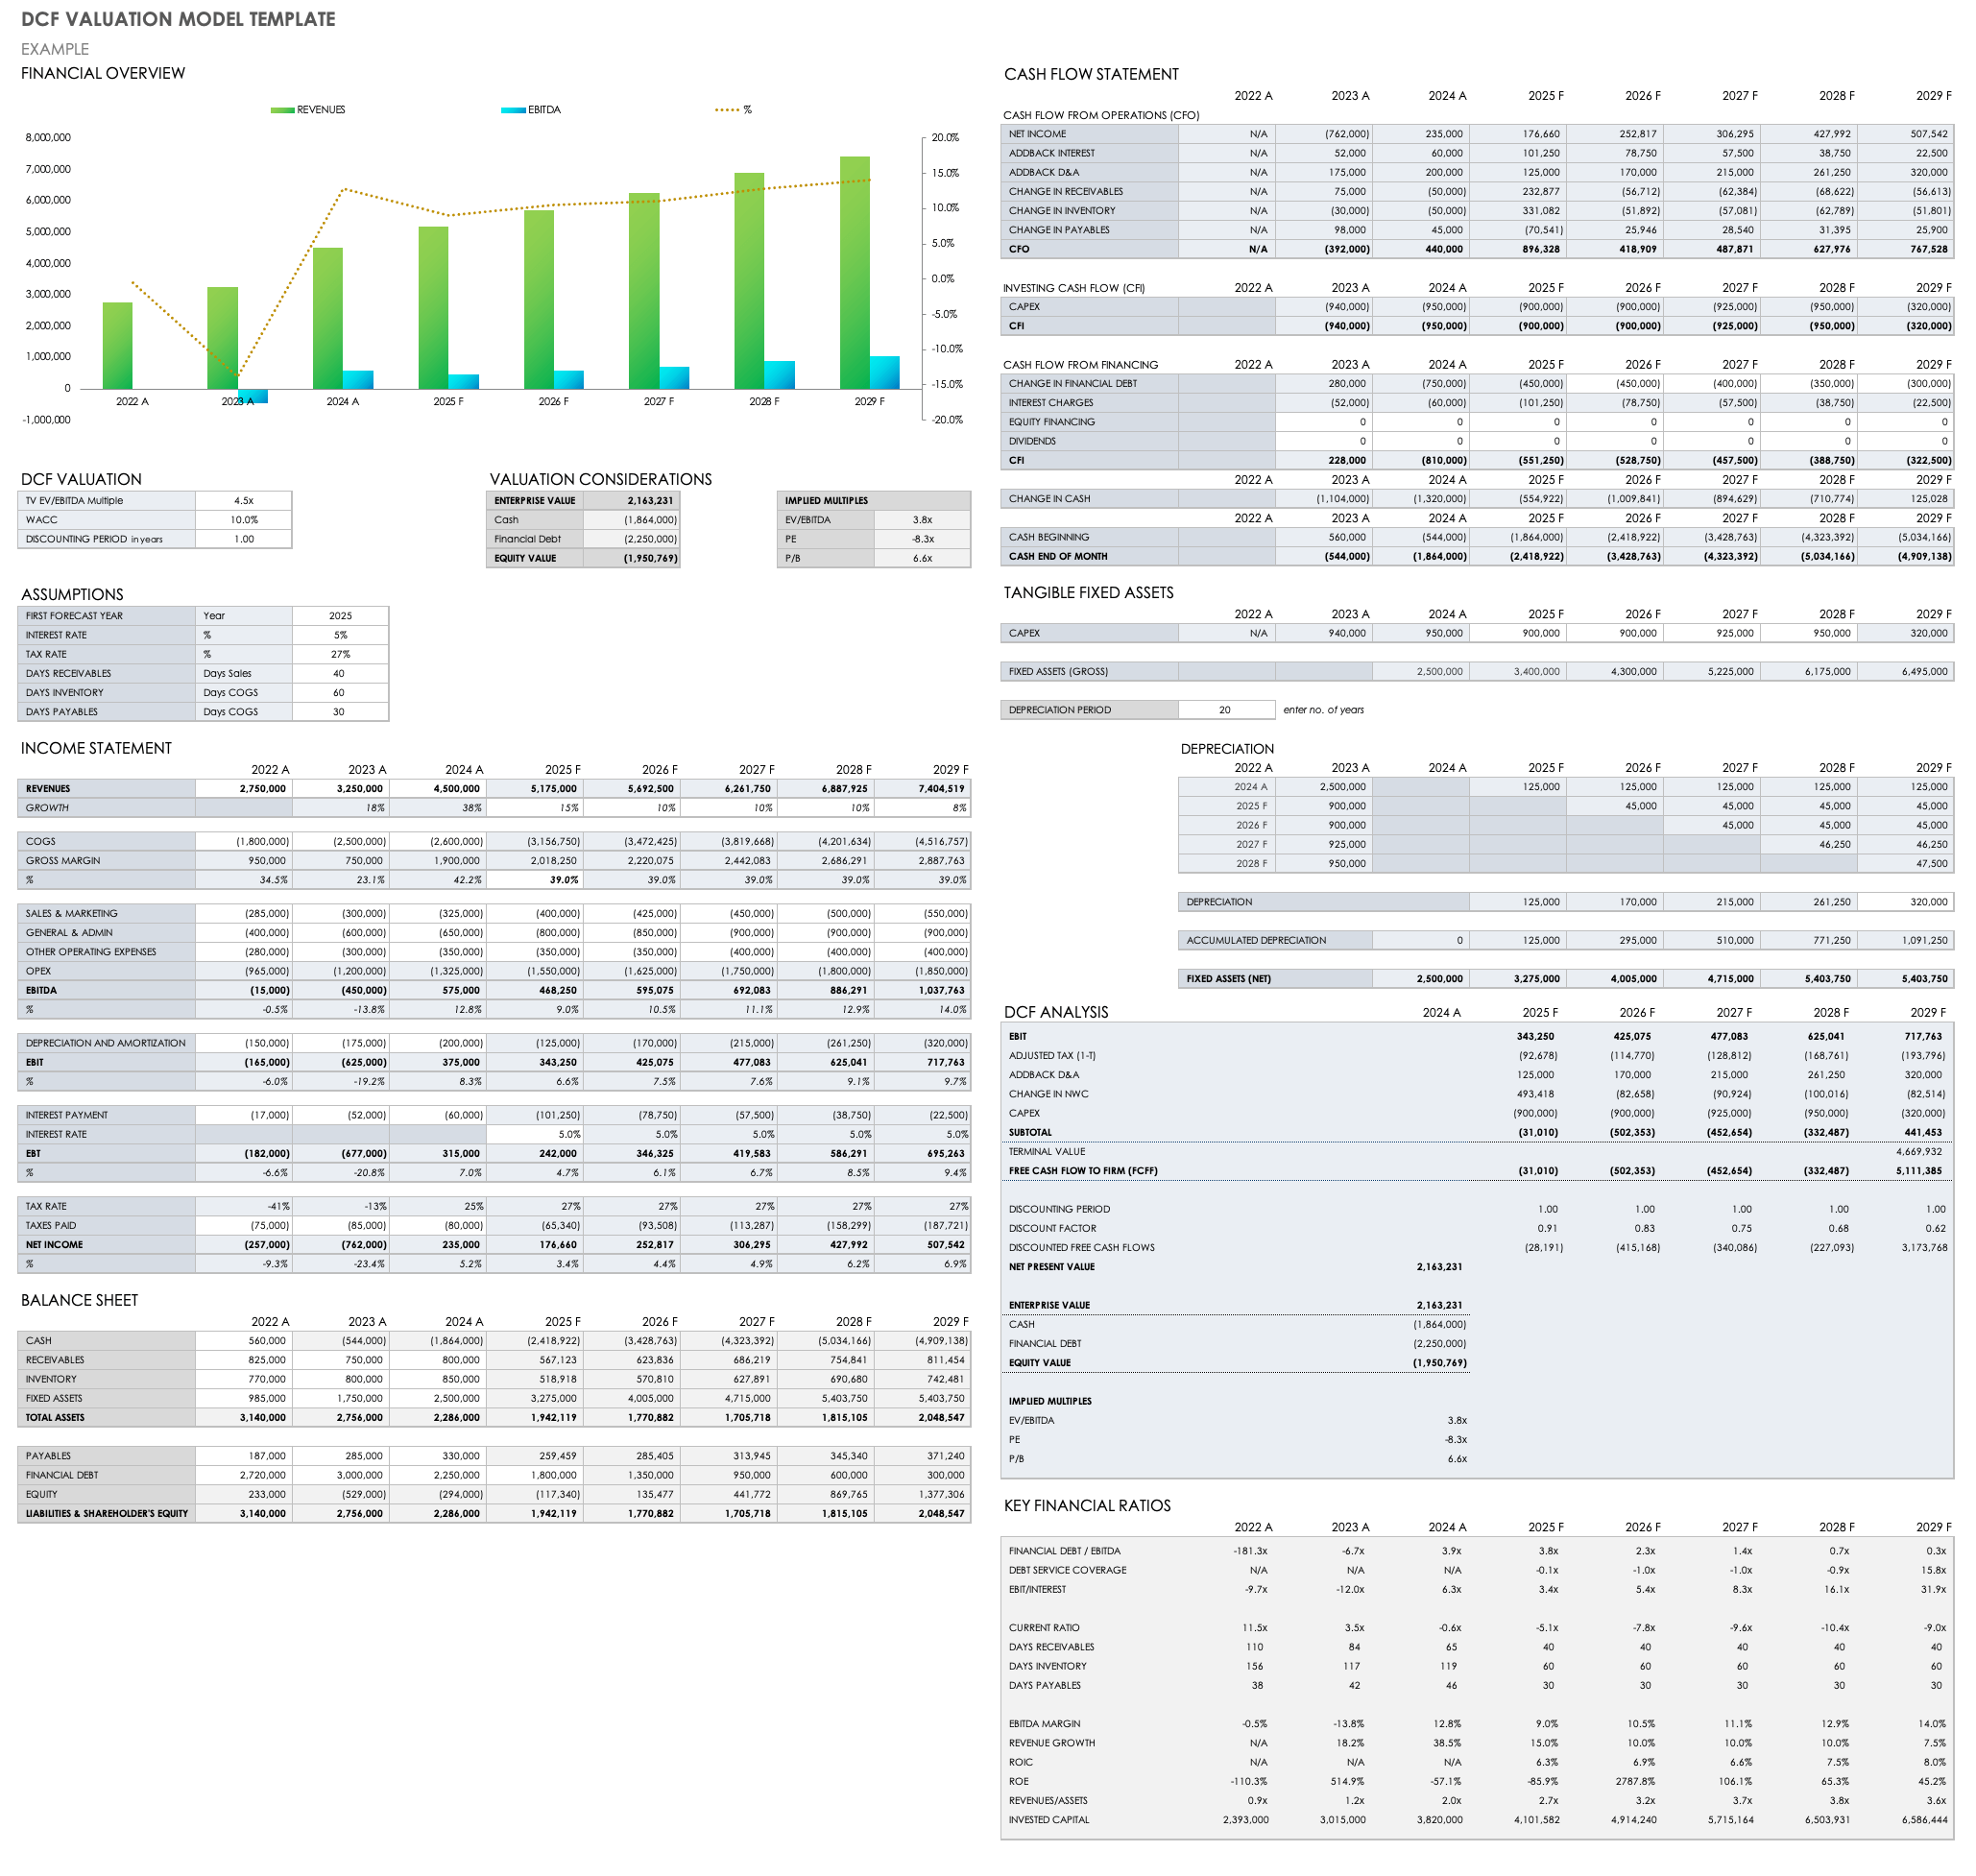
Keep apprised of your company’s valuation based on expected cash flow streams with this DCF valuation model template. The customizable template includes annual DCF analysis columns, as well as sections to factor in valuation considerations, assumptions, income statement, balance sheet, cash flow statement, key financial ratios, and tangible fixed assets — culminating in an auto-generating financial overview chart. This template is the perfect tool to determine the value a company using the DCF valuation method.
Download Discounted Cash Flow Valuation Model Template — Excel
Basic Discounted Cash Flow Valuation Template
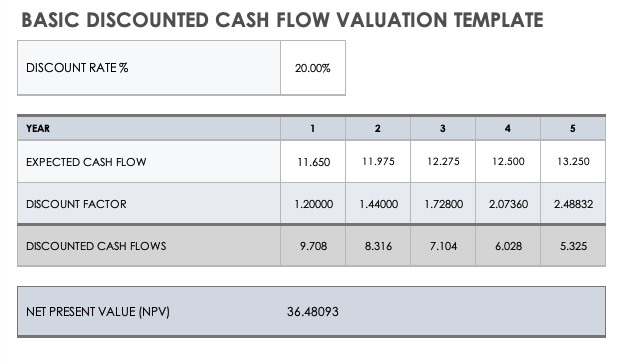
Get an overview of your company’s or investment’s intrinsic value with the simple equations in this basic DCF valuation template. To calculate intrinsic value, take the present value of future free cash flows and add it to cash proceeds from your company’s or investment’s eventual sale. Enter year, cash flow, discount factor, discount rate, DCF, and net present value (NPV) to gain exact valuation. You can save this basic DCF valuation template as an individual file — with customized entries — or as a template for other applications, where you might need to provide details of other assets’ true value and respective discounted cash flows.
Download Basic Discounted Cash Flow Valuation Template — Excel
Discounted Cash Flow Model with Company Valuation Template
This template is ideal for companies that want to determine their value based on future cash flow projections. A forecasting tab allows you to enter forecasting variables (e.g., revenue growth factor) and valuation model outputs (e.g., gross profit margin) to provide you with the present value (PV), as well as the market value of the company’s assets. A DCF tab provides you with the ability to adjust revenue, gross profit, EBITDA, EBIT, and NOPAT details. In tandem, these two tabs’ calculations provide you with an exact account of the total present value of company operations and the total market value of the company’s assets.
Download DCF Model with Company Valuation Template — Excel
Real Estate Discounted Cash Flow Template
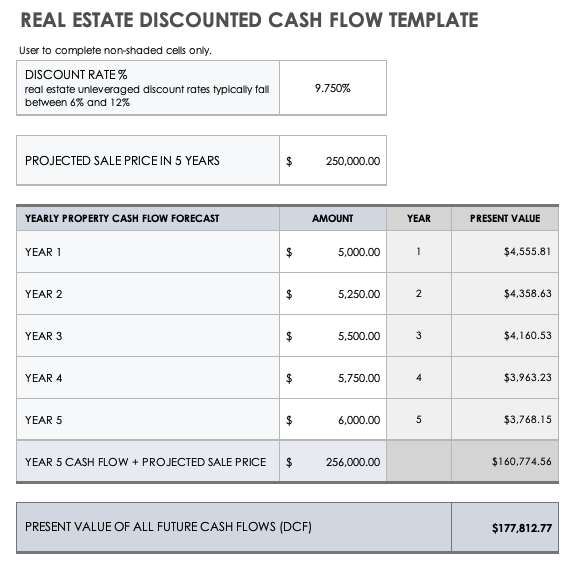
Make sound real estate investments with this unique template, which offers a holistic picture of the true year-over-year value of any given property investment. This real estate-specific DCF template allows you to enter all relevant information about a certain property, including projected cash flows, discount rate, and sale price, which total the sum of all future DCFs that the investment is expected to produce. This provides you with the intrinsic value of your property.
Download Real Estate Discounted Cash Flow Template — Excel
Manage Discounted Cash Flow Projections and Finance Operations Better with Smartsheet
Empower your people to go above and beyond with a flexible platform designed to match the needs of your team — and adapt as those needs change.
The Smartsheet platform makes it easy to plan, capture, manage, and report on work from anywhere, helping your team be more effective and get more done. Report on key metrics and get real-time visibility into work as it happens with roll-up reports, dashboards, and automated workflows built to keep your team connected and informed.
When teams have clarity into the work getting done, there’s no telling how much more they can accomplish in the same amount of time. Try Smartsheet for free, today.
Any articles, templates, or information provided by Smartsheet on the website are for reference only. While we strive to keep the information up to date and correct, we make no representations or warranties of any kind, express or implied, about the completeness, accuracy, reliability, suitability, or availability with respect to the website or the information, articles, templates, or related graphics contained on the website. Any reliance you place on such information is therefore strictly at your own risk.
These templates are provided as samples only. These templates are in no way meant as legal or compliance advice. Users of these templates must determine what information is necessary and needed to accomplish their objectives.

A Discounted Cash Flow (DCF) analysis is one of the most important tools an investor can use to determine the intrinsic value of a stock. This guide will teach you how to get and use a free DCF template in Excel. We’ll also review how to use the template to make informed investment decisions. Let’s get started!
What is the DCF template, and what is it used for?
The DCF template is an Excel spreadsheet that allows you to input data and perform calculations to determine the intrinsic value of a stock. The template uses the Discounted Cash Flow (DCF) method, which discounts future cash flows back to present value.
By simply changing the company along with different assumptions, you can quickly get a good idea of what that company is worth. This guide will teach you how to get and use a free DCF template in Excel.
Downloading the free DCF template on Excel
You can download the free DCF Excel template by clicking this link.
Once you have downloaded the template, open it in Excel and familiarize yourself with the input cells. The input cells are located across the «Company Comparison», «Statements Model», and «DCF». You can spot them by the yellow fill color applied to them.
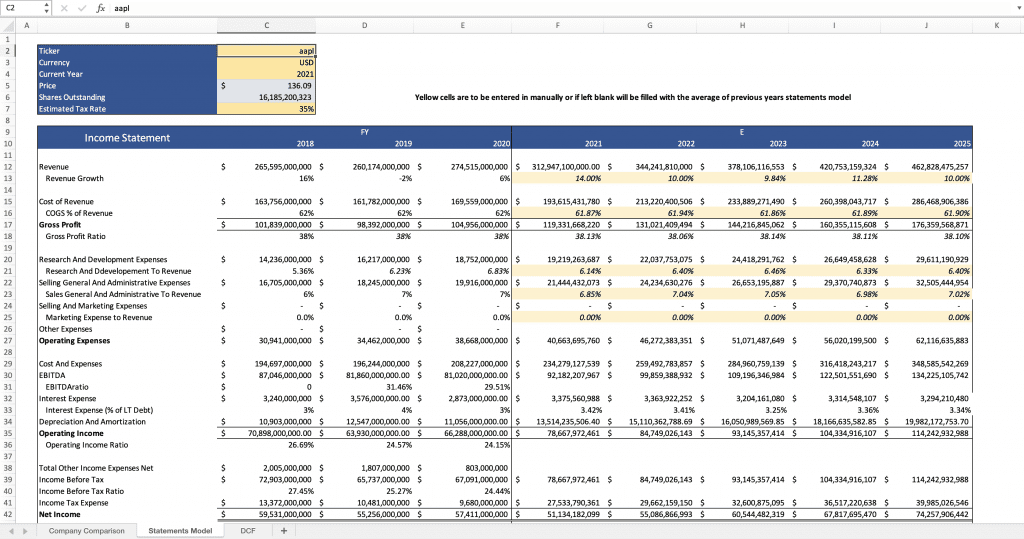
On the «Statements Model» tab, you can see how at the top, you have the ability to change fields like the company ticker, estimated tax rate, and year of analysis. By changing these cells, you will notice how the rest of the spreadsheet will provide you with the data, such as historical and real-time financials, as well as any automatic calculations performed on this data.
*Note that in order to use the template and automatically get all the data, you need to get a Wisesheets account which you can get for free here. More on how to use the DCF template below.
How to use the DCF template to calculate a company’s value?
Now that you have downloaded and opened the DCF template let’s review how to use it.
The first thing you need to do is create a free Wisesheets account. After you have to install the Wisesheets add-in in Excel and log in with the account, you have created.
If you skip this step, you won’t be able to automatically retrieve the template’s stock data, but you can enter it manually if you’d like.
Once you are fully set up, the next step is to make any changes you’d like across the various tabs on the input cells, which are colored in yellow.
The most important parts to change are:
- The ticker
- Current year
- Estimated tax rate
- Discount rate
- Terminal growth rate
- Beta
- Risk-free rate
- Statements assumptions like revenue growth etc.
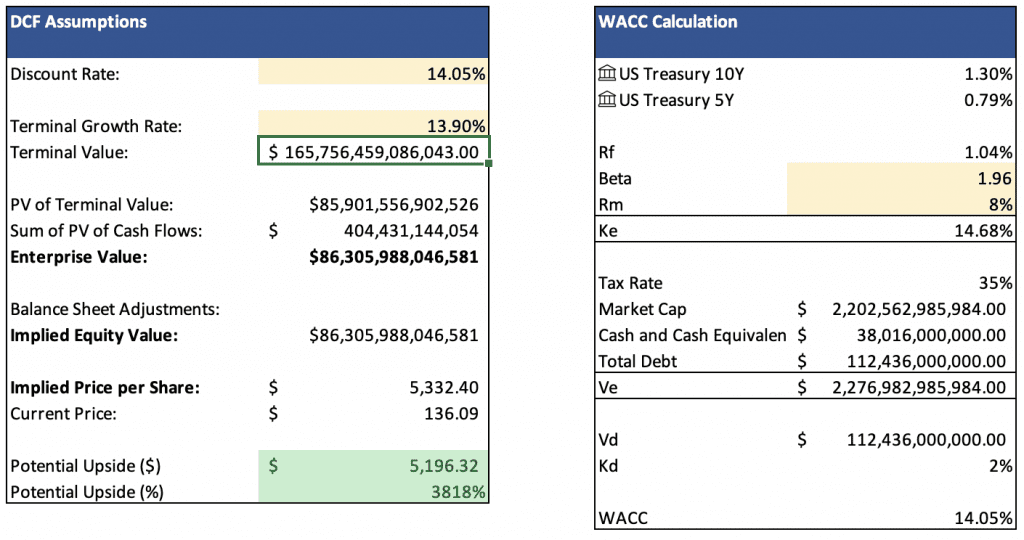
With all these inputs complete, the company’s intrinsic value will be computed and available in cell M19 of the DCF tab. Remember that this number will change depending on the assumptions you enter in your model.
If you are wondering how this value can be computed, the assumptions you enter provide calculations for the expected future cash flow of the company across 5 years. These cash flows are then discounted to the current value using the discount rate you entered.
Things to keep in mind when using the DCF template
Forecast

The forecast rates you use on the «Statement Model» tab in terms of the revenue growth, gross profit percentage, inventory, depreciation as a percentage of revenue, etc., play a significant role in the final value of the company. Therefore, make sure to use reasonable assumptions to keep your model realistic.
As Warren Buffet says, «it’s better to be approximately right than precisely wrong.»
Terminal value
The terminal value is the value you believe the company will have when you sell the stock. There are many ways to calculate the expected terminal value of a stock. The DCF template uses the perpetual growth method, where the final free cash flow is expected to grow by the terminal growth rate and brought back to the present using the discount rate.
You can adjust the template to your preference and change the terminal value calculation as you wish. For more methods on stock valuation, check out this post.
The different tabs in the DCF template
The Excel DCF template has different tabs with a unique purpose. Here is the breakdown of each one.
Company comparison
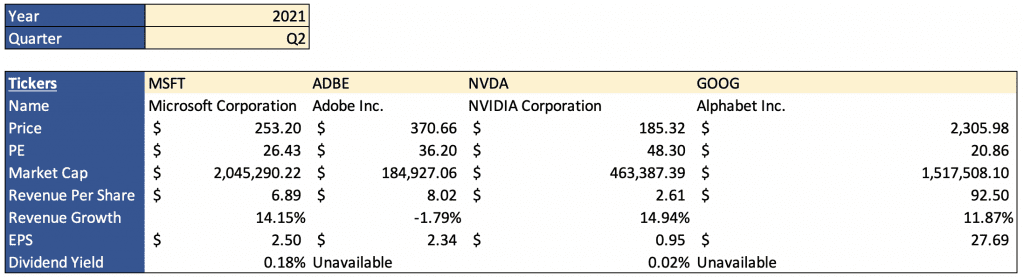
This tab is designed to be able to quickly compare similar companies across various key metrics such as EPS, Dividend yield, PE ratio, etc., which you can then reference when you make your assumptions.
Statements model
This is the most essential part of the model. Here is where you select the company you are looking to do the discount cash flow and enter your assumptions that will dictate the intrinsic value of the stock.
DCF
This is where you can see how your assumptions affect the projected free cash flow as well as change essential assumptions like the discount rate and terminal growth value. In the end, you will see the implied price per share in cell M19 and the potential upside based on the company’s current stock price.
Conclusion
Discounted cash flow is a powerful tool that can be used to value a company. The DCF template provided by Wisesheets makes it easy to get started with DCF and understand how it works. Then, with a few clicks, you can change assumptions and see how they affect the intrinsic value of a stock. Finally, try it out yourself and see how it can help you make better investment decisions.
To your investing success!
К наиболее типичным методам финансового анализа можно отнести анализ затрат, период окупаемости инвестиций, денежный поток и внутрифирменный коэффициент окупаемости инвестиций. Каждый из этих методов мы рассмотрим далее.
Анализ затрат
Анализ затрат является довольно простым методом. В этом случае вы определяете стоимость производства продукта (которым в нашем случае является проект) и сопоставляете ее с ожидаемыми выгодами. Если выгоды перекрывают затраты, то, скорее всего, данный проект будет принят к исполнению.
При выполнении этого анализа не забывайте включить все затраты. Обычно сюда входит совокупная стоимость таких процессов, как практическая реализация проекта, текущая поддержка, сопровождение (техобслуживание), содержание соответствующего персонала, устранение проблем, которые не удалось решить в ходе выполнения проекта, и т.д. В этой методике полная стоимость проекта рассчитывается не по факту выполненных работ, а на основании результатов, полученных в итоге выполнения этого проекта, и только после того, как они будут внедрены в данной организации.
Период окупаемости инвестиций
Период окупаемости инвестиций — это количество времени, которое требуется для того, чтобы окупились первоначальные инвестиции в данный проект. Совокупная стоимость проекта сравнивается с получаемыми доходами и вычисляется время, которое требуется для того, чтобы полученные доходы превысили затраты на реализацию данного проекта. Когда выполняется сравнение двух или большего числа проектов сходного масштаба и сложности, как правило, выбирается проект с наименьшим периодом окупаемости инвестиций. У этого метода нет «универсальной» формулы, которая позволяла бы быстро найти требуемое решение. Если, например, себестоимость проекта равняется 100 000 долл., а ожидаемые доходы составляют 25 000 долл. в квартал, то период окупаемости инвестиций составит один год.
Дисконтированные (приведенные) денежные потоки
Если вам предложат 1 000 долл. сегодня или те же 1 000 долл. через два года, какой вариант вы предпочтете? Ответ предсказуем, поскольку вложив сейчас эту сумму в банк или какое-либо предприятие, через два года вы будете иметь с нее прибыль. Например, под 6% годовых такая инвестиция на двухлетний период составит 1 123,60 долл. (в нынешних долларах, разумеется).
Метод дисконтированного (приведенного) денежного потока сравнивает стоимость будущих денежных потоков с нынешними долларами. Иными словами, он выполняет операцию, противоположную той, которую мы только что объяснили. Зная, что ваш проект принесет через два года сумму, равную 1 123,60 долл. (это так называемая будущая стоимость — Future Value, или FV), вы бы смогли с помощью метода дисконтированного (приведенного) денежного потока определить нынешнюю стоимость этой суммы. Ответ, конечно же, таков: 1 000 долл.
Чтобы иметь представление о дисконтированных денежных потоках, вы должны знать стоимость соответствующих инвестиций в нынешних долларах, иначе говоря, приведенную стоимостью (Present Value, или PV), которая вычисляется следующим образом: PV=FV/(1+i)n. Эта формула говорит о том, что приведенная стоимость равняется будущей стоимости инвестиций, деленной на один, плюс процентная ставка, возведенная в степень, равную количеству периодов, на которые мы инвестируем нашу сумму.
Вам не нравится математика? Но это же так просто! В Excel предусмотрена встроенная функция для вычисления приведенной стоимости (наряду со множеством других функций, позволяющих выполнять финансовые расчеты). На рисунке ниже показана группа Function Library (Библиотека функций), предусмотренная на вкладке Formulas (Формулы), и часть списка финансовых функций, встроенных в Excel.

Рис. 1. Финансовые функции, представленные в библиотеке функций и перечень финансовых функций
Вернемся, однако, к нашей формуле для вычисления приведенной стоимости инвестиций. Выберите в списке функций элемент PV (в русифицированной версии Excel — ПС (Приведенная стоимость)). На экране появится диалоговое окно Function Arguments (Аргументы функции), показанное на рис. 2.

Рис. 2. Диалоговое окно Function Arguments для функции PV
Диалоговое окно Function Arguments предназначено для ввода значений отдельных элементов выбранной вами функции, которые необходимы для вычисления приведенной стоимости. В текстовом поле Rate (Ставка) этого диалогового окна следует ввести величину процентной ставки за определенный временной период. Вы можете ввести 6% или 0,06 (предполагается, что процент начисляется ежегодно по методу сложных процентов). Если бы процент начислялся ежеквартально (по тому же методу), тогда вам нужно было бы разделить указанную величину процентной ставки на 4, а затем ввести полученный результат в поле Rate (Ставка).
Ниже находится поле Nper (Кпер), в котором вводят количество временных периодов. Мы инвестируем нашу сумму на два года. Величина выплаты (поле Pmt (Плт)) равняется 0, поскольку мы не производим выплат по этой инвестиции, а просто хотим знать величину всей этой суммы в нынешних долларах. Далее находится поле FV (Бс), в котором вводят значение будущей стоимости. В нашем примере будущая стоимость инвестиции равняется -1 123,60 долл. Если в поле FV (Бс) ввести положительное число, то результат вычисления этой функции будет отрицательным. На рис. 3. показано диалоговое окно Function Arguments со значениями аргументов функции PV (Приведенная стоимость), введенных в соответствующие поля.

Рис. 3. Аргументы функции PV
Вместо числовых значений в полях диалогового окна Function Arguments (Аргументы функции) можно дать адрес ячейки, в которой введено нужное вам значение. Предположим, например, что в ячейке С1 введено число 0,06. В этом случае в текстовом поле Rate (Процентная ставка) диалогового окна Function Arguments достаточно указать только адрес упомянутой выше ячейки, т.е. С1. Непосредственно под текстовыми полями диалогового окна Function Arguments представлен результат наших вычислений функции PV (Приведенная стоимость). В нашем случае PV=1000. Помимо диалогового окна Function Arguments аргументы данной функции отображены в строке формул программы Excel, а также в активизированной ячейке (А1 в данном случае) (см. рис. 3.).
Как видите, сначала следует значение процентной ставки, затем количество периодов и будущая стоимость. Обратите внимание, что в данной функции отсутствует значение между двумя запятыми. Это означает, что один из аргументов функции равен нулю (в нашем случае величина выплаты (поле Pmt (Плт)). (В русифицированной версии программы Excel аргументы функций следует отделять друг от друга точкой с запятой (;)) Как только вы
щелкнете на кнопке ОК, в ячейке А1 появится результат вычисления функции, в нашем случае — 1 000 долл.
Для того чтобы воспользоваться функцией PV (ПС), не обязательно перебирать ряд интерфейсных элементов программы. Для этого достаточно просто ввести =pv() в ячейке А1. В результате ваших действий на экране появится экранная подсказка, в которой приведен синтаксис данной функции, т.е. сокращенные названия и очередность ее аргументов (рис. 4).

Рис. 4. Всплывающая подсказка с перечнем аргументов функции PV
Если вы не знаете точно, какие значения следует вводить в качестве аргументов функции, откройте окно справочной системы Excel. В единственном текстовом поле этого окна введите PV (ПС для русифицированной Excel) и нажмите клавишу Enter. Справочная система немедленно отобразит всю необходимую информацию по интересующей вас функции.
Если вы, как и большинство других пользователей, раздражаетесь из-за того, что окно справочной системы Excel время от времени скрывается за вашей электронной таблицей (когда вы пытаетесь выполнять пошаговые инструкции, приведенные в этом окне), выполните следующее: скопируйте, а затем вставьте информацию, представленную в окне справки, в электронную таблицу, а затем, когда вы введете нужные значения в формулу, удалите эту информацию.
Допустим, что ваш комитет по отбору проектов рассматривает три проекта, из которых необходимо выбрать самый подходящий. Ожидается, что проект А принесет через два года 130 000 долл. прибыли; проект В — 140 000 долл. через три года; а проект С — 148 000 долл. через четыре года. Какому из этих проектов должен отдать предпочтение комитет, если свое решение он основывает лишь на использовании метода дисконтированного (приведенного) денежного потока, полагая, что процентная ставка равняется 8%? Самую высокую прибыль обеспечивает проект А. На рис. 5 показаны расчетные формулы по каждому проекту и полученные с их помощью результаты.
 денежного потока")
Рис. 5. Сравнение проектов с помощью метода дисконтированного (приведенного) денежного потока
Formula & Definition

Discounted Cash Flow is a term used to describe what your future cash flow is worth in today’s value. This is also known as the present value (PV) of a future cash flow.
Basically, a discounted cash flow is the amount of future cash flow, minus the projected opportunity cost. Your cash flow is always more valuable to you in the present because you can invest it and increase the amount you have.
Calculating a discounted cash flow is a little like calculating your savings account’s compound interest. Let’s say you put money into a savings account and leave it alone for a year to let it earn interest. After that year is up, you have your original money (your principle) plus the interest that money earned throughout the year. At the end of the second year, your principle and your interest combine to earn compounded interest.
By calculating your discounted cash flow, you can make an educated guess at what the value of your cash flow in a particular time in the future is worth to you in the present, similar to how you can calculate how much interest you’ll earn on the money you put in your savings account by factoring the compound interest.
However, by calculating your compound interest, you can tell how the value is increasing. With a discounted cash flow, you can calculate the rate at which the value is decreasing. To summarize, the value of your money decreases when it’s not immediately accessible by you. And discounted cash flows show how much that decrease is.
Knowing the present value of an income property is vital to smart money management. Income properties’ main way of producing value is through cash flows. As you operate your income property and when you sell it, you are generating cash flows. Your goal is to find the total value of all these future cash flows in present-day dollars, because that’s what your investment is worth at a given rate of return (also known as the discount rate). This is also part of the calculation of Net Present Value, which is explained on a separate page.
Zilculator helps real estate professionals calculate discounted cash flow easily. Never use a spreadsheet again! Analyze your own property or create investment reports for your clients.
- Professional-grade branded investment reports
- Loading data from MLS®, Zillow®, and Rentometer Pro®
- Sales and Rental comps
Create your report in 2 minutes

How to Calculate Discounted Cash Flow (DCF)
- Determine the particular cash flow for each year in the future until the sale of the property
- Determine your discount rate as your opportunity cost. It is common to use the weighted average cost of capital (WACC) in this case.
- Apply the DCF formula below to calculate the present value of all future cash flows:

- Calculation of Discounted Cash Flow (Present Value) manually is pretty complex. Instead you can use the Microsoft Excel spreadsheet calculator below.

Excel Spreadsheet Example
We prepared a simple example and calculation of a real estate Discounted Cash Flow in an excel spreadsheet file. You can download the file, input your own numbers and calculate results in no time. The only thing we ask in return is for you to like our facebook page or follow us on twitter.
Download Excel Spreadsheet Example
*DISCLAIMER* This post, the DCF valuation model, and the company DCF excel examples that you can download are NOT investment advice. Do not use any of this article or the example in the model as investment advice. Microcap.co and I am not liable for any decisions you make based on this article, the DCF model, or the company examples.
Discounted Cash Flow valuation method (or better known as “DCF”) is simply one of many ways to value a company.
It’s a method that values a company based on its future promised cash flows, and is often the primary valuation method used when a company is bought / sold.
DCF valuation should be done in conjunction with other valuation methods, such as:
- Public company comparables (or “Comps”)
- Past transaction comps
- Net book value or net asset value
Now let’s get right into how to perform a discounted cash flow valuation.
Discounted Cash Flow Valuation Concept Summary
DCF valuation is simply a way to add up all the cash flow a company will make over the life of the company. That’s it.
To emphasize how simple of a concept DCF valuation is, let me re-type that. DCF valuation is:
A way to add up all the cash flow a company will make over the life of the company
For example, this year after you pay for all the expenses and pay back any interest, let’s say you make $100k.
And next year, you make $100k. And every year after that, you expect to make $100k every year.
When you add up all this cash flow every year for the next 50 years that you operate your company, you make $5 million ($100k x 50 years).
So then, you can say that the company is worth $5 million.
It’s as simple as this except there’s just one more thing to take into account and apply.
We know that one dollar 50 years ago was not the same value as a dollar today.
Similarly, $100k this year is not worth the same amount as $100k in 50 years. In 50 years, $100k will be worth much less.
So, to account for the money not being worth as much later on and because what good is $100k 50 years later when we might not even be around to see it (bleak…), you apply a discount to the cash flow you expect to get in future years.
This concept is called the time value of money (TVM).
So, instead of your company being worth $5 million, it will be worth less than that. Let’s see what that number is in the table below:
| Year 1 | Year 2 | Year 3 | Year 4 to 49 | Year 50 | |
| Cash Flow | $100k | $100k | $100k | $100k/year | $100k |
| If you add it up before discounting: | $5 million | ||||
| Discount for TVM | No discount b/c $100k today is worth $100k | 10% | 10% again | 10% again every year | 10% 50 times |
| Discounting Calculation | 100k / (1.1) | 100k / [(1.1)*(1.1)] | 100k / [(1.1)*(1.1)*
(1.1)] |
100k / (1.1^n) | 100k / (1.1^50) |
| Discounted Cash Flow (Cash Flow after the discounting calculation) | $100k | $91k | $83k | $75k in year 4 to $1k in year 49 | $0.9k |
| Add up the discounted cash flow | $1.1 million |
In the table above, you see that the $100,000 in year 50 is only worth $900 today.
So, instead of the company being worth $50 million, when you add up the discounted cash flow, it’s worth $1.1 million today.
In the next section, we’re going to delve a little deeper with technique and use two real life company examples.
Above was an illustrated summary. Now we’ll perform the DCF valuation with real company examples.
The 4 simple steps to do a DCF valuation are:
- Step 1) Calculate the cash flow
- a) For the last 5 years
- b) For Projected Years 1 – 5
- c) For Projected Years 6 – 50 combined into something called a Terminal Value
- Step 2) Apply Discount
- Step 3) Add it up all up to get the valuation
Step 1) Calculate the Cash Flow
In the above example, we assumed that the hypothetical company would make $100k every year for 50 years. Obviously, this is unrealistic.
Realistically, the cash flow that a company will make this year, next year, and every year after that forever is not known with certainty.
But we need to make this assumption based on what we do know in order to be able to calculate the discounted cash flow and subsequently the company’s valuation.
In order to do that, we calculate the historical free cash flow for the last 5 years, so that we can see the trend and make best guess assumptions.
So, set up the free cash flow calculation for the last 5 years.
a) Calculate Cash Flow for the Last 5 Years
I wrote a post on how to calculate free cash flow, so I won’t repeat it here, but if you need a refresher on how to calculate free cash flow, then pause here and go read that post first.
As a reminder from that post, a simplified illustrative step by step line items to calculate free cash flow is as follows:
| Revenue | $1,000,000 |
| Cost of Goods Sold | ($500,000) |
| Gross Margin | $500,000 |
| G&A | ($300,000) |
| Earnings Before Interest, Taxes, Depreciation & Amortization (EBITDA) | $200,000 |
| Subtract Depreciation & Amortization | ($50,000) |
| Earnings Before Interest, Taxes (EBIT) | $150,000 |
| Deduct Interest | ($10,000) |
| Earnings Before Taxes (EBT) | $140,000 |
| Deduct Taxes (let’s say 35% of EBT) | ($49,000) |
| Earnings After Taxes (EAT) | $91,000 |
| Add back Depreciation & Amortization | $50,000 |
| EAT Before DA | $141,000 |
| Subtract Changes in NWC | $10,000 |
| Subtract CAPEX | ($30,000) |
| Free Cash Flow | $101,000 |
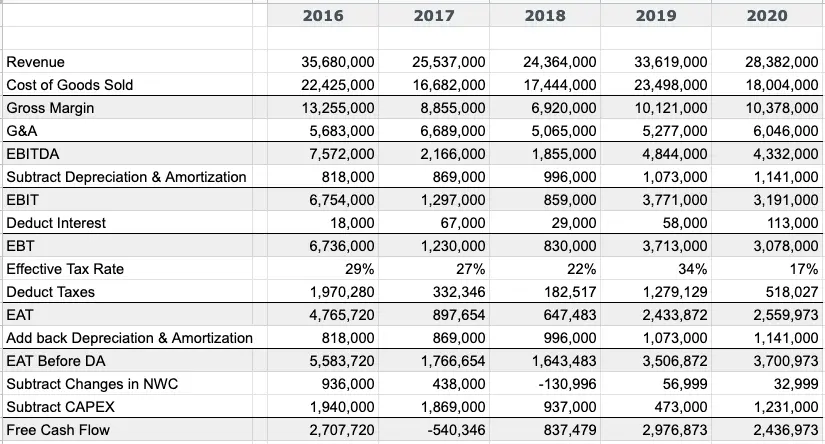
In that post, we looked at 2 real life examples and calculated the free cash flow for 2020 in the case of Taylor Devices and for 2019 in the case of Liberated Syndicated.
Now, in this first step to perform DCF, we’re going to repeat the free cash flow calculation for the last 5 years. That is, 2016 – 2020 for Taylor Devices and 2015 – 2019 for Liberated Syndicated.
Example of the last 5 year free cash flow:
b) Project Cash Flow for Years 1 – 5
After you’ve set up the historical 5 years, you project the next 5 years.
Based on what we know happened, we will make reasonable assumptions for each row that’s an input (not a calculation output), starting at the top with Revenue.
- Revenue Growth: There are 3 things you look at to determine revenue growth. The first is the historical trend of revenue growth (usually average of last 3 or 5 years). The second is internal events that will impact revenue; for example, sales pipeline, new client wins/losses, partnerships, etc. The third is external events that will impact revenue; for example, a pandemic!!! Once you pick a reasonable revenue growth assumption, apply it to the most recent year’s revenue. Apply the same growth rate to the next 5 years, unless you know there will be an increase or a slowdown in growth.
- Cost of Goods Sold as a % of Revenue: Calculate the last 5 years’ cost of goods sold as a % of revenue. Since COGS is a direct cost, meaning it varies with revenue, we should get a pretty level % in this calculation.
- G&A: The last 5 years’ G&A should be pretty stable since operating costs don’t tend to change much unless there are major changes in the company such as layoffs, new business segments or product lines launched, development, etc.
- Depreciation & Amortization: Companies will have a separate Depreciation table that calculates the annual Depreciation & Amortization. If there weren’t any purchases of items to be capitalized (like equipment), then D&A should be similar to last year’s.
- Interest: Interest should also be known in a separate debt / interest table.
- Taxes: Every year’s actual taxes paid will fluctuate based on tax deductions. For future projection purposes, it’s a reasonable assumption to use the corporate tax rate (both federal & state tax) and apply that to EBT.
- Changes in Net Working Capital: There are several ways to make this assumption. In one place I worked at, I was taught to make an assumption as a 1% of revenue. In another place I worked at, I was taught to create a separate working capital schedule and make assumptions on the “Days of Receivables”, “Days of Inventory”, and “Days of Payables” and then derive the working capital based on revenue projection. And at another place I worked at, which I think is probably the more robust way to do it, is this:
- First, calculate the historical cash-free, debt-free working capital as a % of revenue.
- Then take the average of this % of revenue and use it to project the cash-free, debt-free net working capital for future years.
- As the last step, take the change in the net working capital projection. The change is going to be taking THIS period’s net working capital MINUS LAST period’s net working capital.
- CAPEX: The last input to make an assumption is capital expenditure (CAPEX). This assumption is going to be different based on the nature of the business. If the company is in a very heavy machinery industry and the business requires new investments in machinery every 2 years, then CAPEX will be high and predictable. If the business is in software as a service, and the company is heavily investing in developing intellectual property in the next 5 years, then there will be high CAPEX in the form of capitalized R&D in the initial years. The best way to gather information to make a reasonable assumption for CAPEX is to look at historical trend as well as knowing what the company is working on and what their plan is.
Using our company example, this is how I made a reasonable assumption for each input row after considering the historical trend averages.
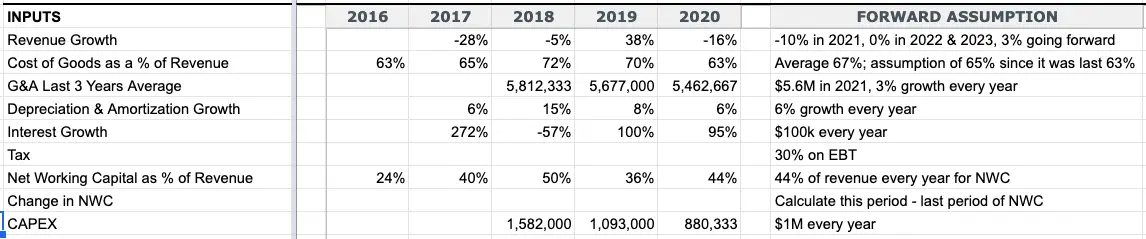
And using these forward assumptions, the projected 5 year cash flow looks like this:
When you’re first building DCF models, it might get a little discouraging when it comes to making the forward assumptions. But it becomes second nature after a lot of practice, so keep going.
And if you’re trying to value your own business, take the time to dig into the operation and ledgers to understand each input and make a robust assumption.
The factors that contribute to making these decisions include the nature of the business, whether you want to be more conservative in your assumption, external and internal factors, etc.
B) Project Cash Flow for Years 6 to Forever (i.e. “Terminal” Cash Flow)
In the illustrated example at the beginning of this post, we assumed $100k every year for 50 years. But who are we kidding; it’s impossible to predict cash flow that far out.
So, instead, we group years 6 onwards into one, which we call the terminal value.
At this point, assumptions you make don’t have that great of a certainty that they will occur since we have no idea what will happen 6 years onwards.
The formula to calculate the Terminal Value, which captures all the cash flow in the future years, is:
- (Free Cash Flow in Year 5 * Terminal Value growth rate) / (discount rate – Terminal Value growth)
- We know the free cash flow from Year 5 in the previous section.
- The terminal growth rate is the long term growth rate that you assume for every year forever. The industry standard for the terminal value growth rate is 3%, because it’s the closest to what the historical trend for inflation every year has been. But for an industry that’s very mature and won’t grow much, it might be 2%. For a very fast growing industry, it might be 5%. But 3% is a safe assumption to use if you don’t know the state of the industry.
- We haven’t talked about the discount rate yet. That’s in the next section. For now, we’re going to use 7.5%. To read more about this discount rate, keep reading on to the next section and then come back to this section.
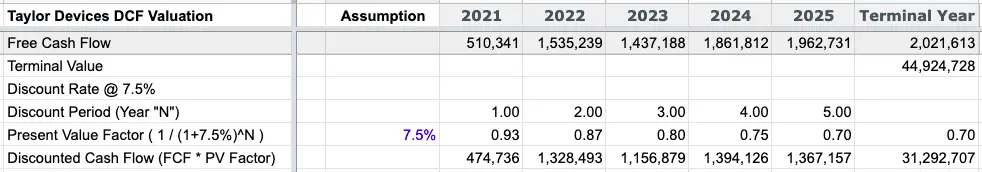
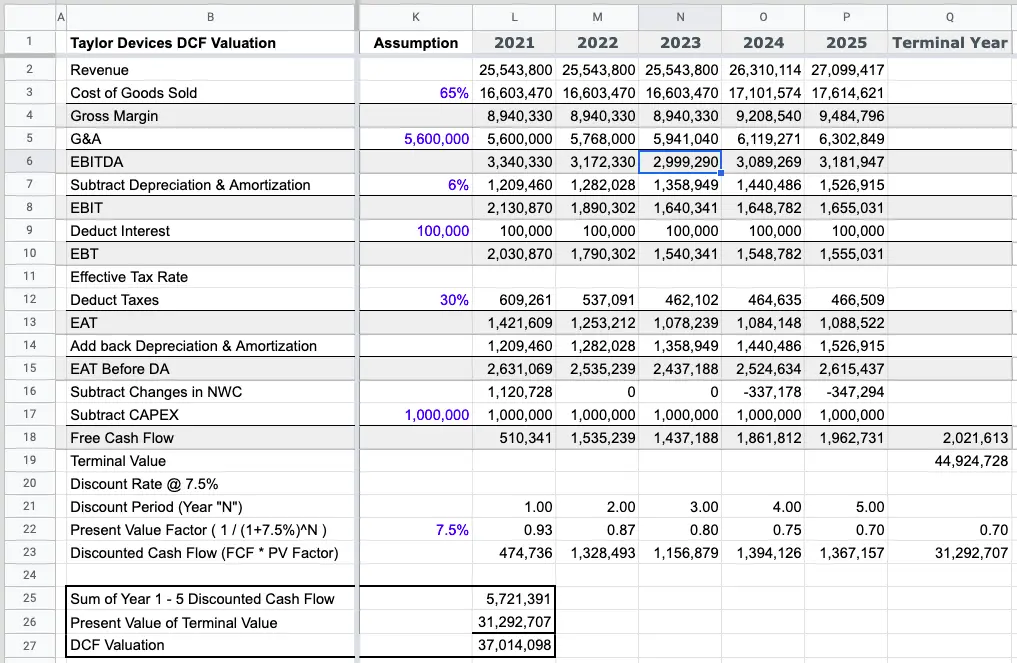
Below, you can see that the free cash flow for the Terminal Year is Year 5’s free cash flow multiplied by the Terminal Value growth rate of 3% – which is the numerator of the Terminal Value formula. And then we divide this by (discount rate – Terminal Value growth rate), which is (7.5% – 3.0%), which is the denominator of the TV formula. We get ~$44.9M.

Step 2) Apply Discount
Now that you have the free cash flow for Years 1 – 5 projected and the Terminal Year, the next step is to apply the discount; i.e. the “discounted” in Discounted Cash Flow.
To do this, you need the appropriate discount rate and the formulas.
What Discount Rate Should You Use?
The discount rate in the industry is called the Weighted Average Cost of Capital (or WACC).
WACC calculates each company’s cost in % per year for borrowing money or getting investors’ money.
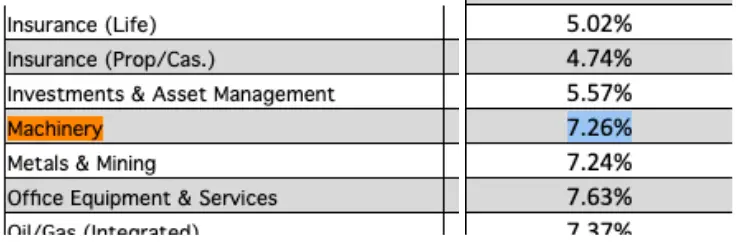
We won’t worry about WACC now, because this is more technical than practical. Instead, I would encourage the use of Professor Damodaran’s regularly updated discount rates by industry, because he does the research and calculation for us. =)
On his NYU webpage, look up the industry in which the company you’re valuing operates in.
At the very far right column, you’ll see “Cost of Capital”. That’s the discount rate we’re going to use.
Our example company operates in heavy industrial machinery. The cost of capital in the table is 7.26%. As a simplified discount rate, we’ll round up and use 7.5%.
Apply Discount Rate to Cash Flow in Years 1 – 5
Assuming today is Year 0:
- In Year 1, we’re going to divide the cash flow by (1+ discount rate).
- In Year 2, we’re going to divide the cash flow by (1+discount rate) twice.
- In Year 3, we’re going to divide the cash flow by (1+discount rate) three times.
You see the pattern.
So, the formula is cash flow in a given year is
- Free Cash Flow / (1 + discount rate)^(year N).
If we’re assuming that Year 1 has already started, then we get into a “partial period”, which for the purpose of a simplified understanding of DCF, we don’t have to get into yet.
I like to break the formula up into simpler rows:
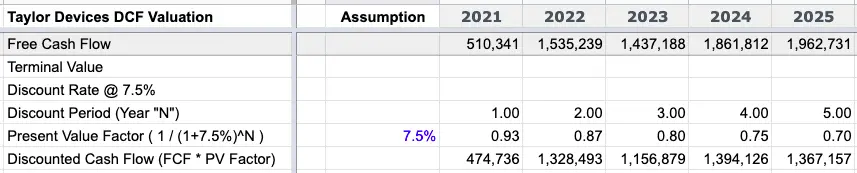
- “N”; i.e. the period being discounted: Count the # of years from Year 1 to the given year.
- Present Value Factor is the denominator of the discounting formula.
- Present Value is now bringing in the numerator of the discounting formula which is the free cash flow; i.e. the Discounted Cash Flow.
Apply Discount Rate to Terminal Value
Discounting the Terminal Value is exactly the same. Since the Terminal Value adds up Year 6 to infinity, it doesn’t belong to any year. We use Year 5’s present value factor to discount it.
- I.e. $44.9M * 0.70, which is $34.0M
Step 3) Add It All Up
Finally, the best part. We add up all the discounted cash flows to get the company’s valuation.
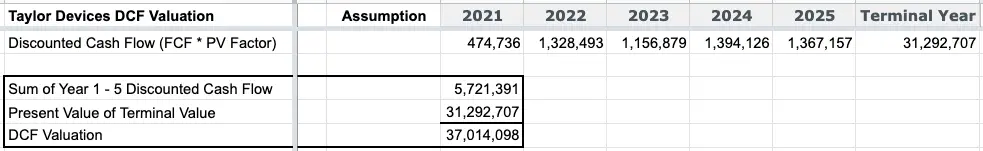
The valuation of this company using DCF valuation method is $37.0M.
Congratulations, you’ve just built a DCF model and valued a company based on projected cash flow. Here’s a star.
Download Discounted Cash Flow Excel Examples
In the Excel model examples that you’re about to download, you will find Taylor Devices and Liberated Syndicated.
The 2 companies are good varying examples because of some differences you’ll notice. For example, LibSyn is a podcast hosting company, so it doesn’t normally spend CAPEX unlike Taylor Devices which has a relatively high amount of CAPEX every year since it’s a heavy machinery company.
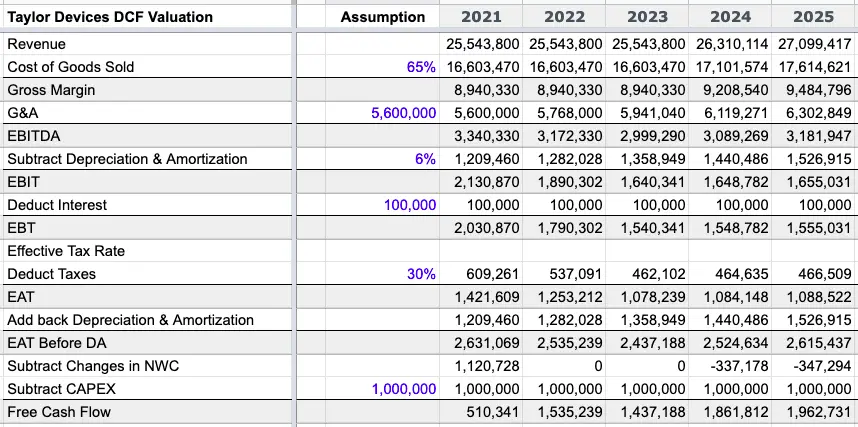
You’ll find a simple DCF model for Taylor Devices like this:
And a DCF model for Liberated Syndication like this.
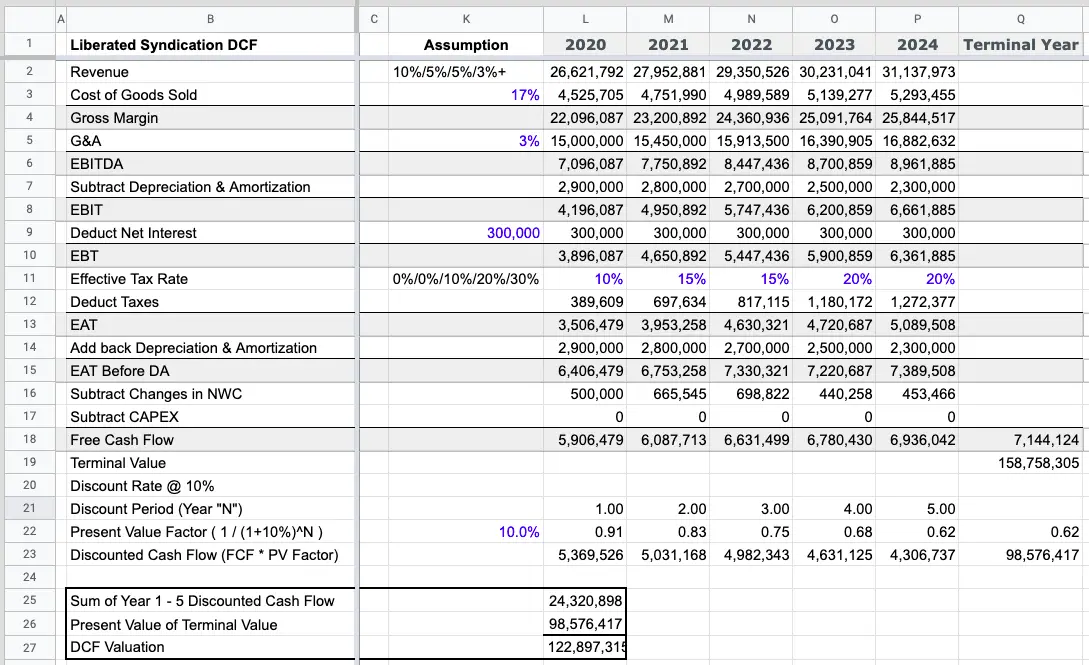
Note that there may be some mistakes as I am human and there might be human error that I didn’t catch. (Also, I created it in Google Sheets as opposed to my beloved Excel, because I am currently using a different laptop than I normally do to create models. So, if you find any mistakes, forgive me.)
Finally, here is the model. Enter your email below to download the Discounted Cash Flow model with real company examples. The model with the 2 company DCF examples will be sent to your email directly.
As always, thanks for being a reader of microcap.co and leave a comment and share with friends and colleagues who want to value a business.
*DISCLAIMER REPEATED* This post and the excel examples are by NO means investment advice. Assumptions made are purely my opinion and the valuation is created using the widely used DCF valuation technique. Do not use any of this article or the example in the model as investment advice.

Click to See Full Template
- Version
- 7’667 Downloads
- 300KB File Size
- January 3, 2022 Updated
- 0 Number of comments
- Rating
As an investor, it is important to be able to evaluate the worth of current investments and future investment opportunities.
The profit that can be materialized as an investor/business owner is not restricted to dividends/profits. The final sale value of the asset is a major part of your overall return.
There are numerous methods of valuation currently being used in the market:
- relative valuation,
- net assets value,
- discounted cash flows, and
- market comps.
Discounted cash flow is a widely used method of valuation, often used for evaluating companies with strong projected future cash flow.
This is the only method which assigns more importance to the future cash generation capacity of the company – not the current cash flow.
Our Discounted Cash Flow Valuation Template is designed to assist you through the journey of valuation. The template comes with various scenarios along with sensitivity analysis.
Read this Excel tutorial to find out how you can easily estimate the net present value of your holdings with our free template, step by step.
Discounted cash flows allows you to value your holdings today based on cash flows to be generated over the future period. These cash flows are then discounted using a discount rate, termed ‘cost of capital,’ to arrive at the present value of investment.
The reason behind discounting the cash flows is that the value of $1 to be earned in the future may not be the same as the value today.
The value calculated through this method is then compared to the cost of investment today to evaluate whether the same is profitable or not. Higher value in comparison to its cost of acquisition denotes that a profitable opportunity can be materialized by the investor.
The elements that are part of the net present value (NPV formula) are:
A single value is estimated at the end of 5 or 10 years which is the representative of the total value over the future period. The same is then discounted at the cost of capital to arrive at the net present value (NPV).
There are multiple formulas to calculate the terminal value. The top methods are:
- Exit multiple (EBITDA or sales or PE multiple),
- Perpetual growth rate, and
- No growth formula.
To learn about the above formulas in detail, click here.

How to Use The Template
You can execute your own DCF valuation model by inserting some basic data into the template. In this article, we break down the entire procedure into simple steps.
To use the template, you will need to replace data that is in blue with your own information.
Contents of the Template

The main elements of this template are:
- Date of Valuation: Enter the date of the valuation. The valuation date determines the period for which the cash flows will be discounted.
In our template, the estimates have been prepared for a period of 10 years and the cash flows are discounted on a yearly basis. The input affects the field highlighted in the screenshot below:


- Revenue: Revenue for the previous year acts as a base for projecting the future revenue. You can check the previous year’s financial statements to ascertain the total revenue earned.

After you enter the revenue, future revenue will automatically be calculated based on short-term and long-term revenue growth rate.
- EBITDA: You have to fill this section with the EBITDA earned in the previous year. This should be extracted from previous year’s financial statements. After having filled EBITDA, the template will automatically convert the amount of EBITDA to a percentage of revenue based rate.
The rate calculated above is applied to the projected revenue (calculated in the previous section) to arrive at the EBITDA figures in the future years. This will further be adjusted to arrive at the net cash flows.

- Depreciation and Amortization: In order to calculate the tax on projected profits of the company, you need to first deduct the depreciation (and/or amortization) figure from the EBITDA calculated above.
After you have entered the depreciation (and/or amortization) figure, the template will automatically convert it as a percentage of revenue and will apply to the projected revenue figures to arrive at future estimates.
After having calculated the tax, figure of depreciation and amortization will again be added back to the cash flow, as this is a non-cash item.

- Capital Expenditures: It denotes the amount spent by the company on acquisition of fixed assets.
You can view the capital expenditure figure from the cash flow statement of the previous year and that is taken as the basis for future projections. The amount will then be converted as a percentage of sales and applied to the future revenue figures to arrive at the projected capital expenditure figures.

- Working Capital: Working capital is the difference between current assets and current liabilities. Net changes in working capital are adjusted in the free cash flow projections to arrive at the free cash flow figure.
You can ascertain the figure from the previous year’s balance sheet.

Similarly, the change in operating assets and liabilities represents non-cash current assets and liabilities like accounts receivables and inventory and are treated in the same way as changes in working capital.
- Discount Rate: The Discount rate is the required rate of return below which the investment opportunity is considered as a non-optimal use of cash. Sources of capital (including equity, preference shares, debentures, debt, etc.) are considered while calculating the discount rate or weighted average cost of capital. The discount rate is a weighted average of cost of equity and cost of debt. It basically is the return sought by the investor in lieu of the financial risk taken for investing in the project. You can also consider IRR (internal rate of return) as discount rate for valuing an investment.

- Discount Rate Sensitivity: The future is uncertain. In order to determine the valuation of investment in the case of adverse or favorable changes in the economy, you can manipulate the figures using the sensitivity analysis option in the template.
The sensitivity factor will then be applied to the discount rate showcasing the three different scenarios.
This can be illustrated using an example. If the discount rate estimates for your business is 12% and the discount rate sensitivity is 1%, the discount rate in different scenarios will be:
- Case 1 = 12%
- Case 2= (12%+1%) = 13%
- Case 3 = (12%-1%) = 11%
The resultant present value multiplier will be depicted in the template as follows:

To learn more, click here.
- Tax Rate: You have to input the corporate tax rate in case of company valuation or individual tax rate in case of natural persons.

- Short-term and Long-term Revenue Growth Rate: Used in calculating growth rate of revenue for the projected period. Short-term growth rate represents the increase in sales for the projected period.
Long-term growth rate represents the assumption that the company will grow perpetually at this particular rate and is used for calculating terminal value.
Advantages of Discounted Cash Flow Valuation
- Use of the core aspects of business operations including growth rate, discount rate, free cash flows from operations etc. will allow you to calculate the intrinsic value of an investment.
- You can use the method to value the whole company or just some components of it.
- It correctly assigns weight to the cash flows based on the period under projections and takes into account the time value of money.
- It allows you to compare cost of capital to the projected rate of return, which is not possible in other valuation methods.
- The method makes the use of pure cash flows rather than earnings that can be manipulated by accounting policies and amortization rules.
- It is the only method which calculates the value of business based on future outcomes rather than applying multiples on historical results.
- The method can also take into account levered and unlevered valuations. Levered DCF measures the value of the equity alone whereas the unlevered DCF values the company as a whole including debt. You can just deduct net debt from unlevered DCF value to come up with the equity value.
Limitations of the Method
- One of the main elements of discounted cash flow valuation, i.e. discount rate, is an assumption and can be different for different sets of investors, and can change over the course of time. The cost of equity and cost of debt are never static as the financial risk keeps on evolving for a company.
- The method might not be applicable to cases where projects are heavily complicated and cash flows are highly erratic.
- DCF methodology can’t be used for many technology startups whose focus is growth in user base as compared to growing free cash flows.
- Under the method, capital expenditure is projected considering a constant rate, while that may not be the case in real life. For instance, if you are thinking of expanding your business in year 5, the capital expenditure may be higher in year 5 as compared to other years.
- Share of terminal value in overall valuation figure can be much higher than that of the operating cash flows. Thus valuation is largely dependent on the terminal value.
These factors do not disqualify the discounted cash flow model; just that you need to carefully analyze the final values and assumptions taken.
Comparison with Other Valuation Methods
There is no single valuation model that you can apply to all situations. The choice of appropriate method will depend upon the availability and accuracy of basic inputs, nature of the industry, characteristics of the investment, and the development stage of the company.
Discounted cash flows model is also suitable for companies not paying dividends or making irregular dividend payments, or companies having multiple revenue streams. It is best suited for companies having a detailed operational history.
For the detailed analysis of different methods, click here.
Conclusion
Although the method is widely used by investors, sometimes it may produce misleading figures. It may happen in the case where the company sells its assets to inflate the cash flows, while the actual earnings of the company may be zero or negligible.
On the other hand, if you use it wisely, especially by considering each minor detail that has been used in the calculation of cash flows, the method is considered to be the most reliable valuation model.
When you use DCF in combination with other valuation methods, most of the individual shortfalls of different methods are eliminated and you get a fair valuation.