
How Many Rows and Columns in Excel (2003, 2007, 2010, 2016)
The common question you can expect in an interview is the requirement of Excel skills. However, not many of us not may even look at the last row or last column in a worksheet. That could be because we have never faced a situation where we needed to go to the last row or column. But it is important to know these things. Not only the last row or last column when we work with data, the actual last row or column will not be the end of the actual row or column but is the end of the data row or column. So, in this article, we will show you how many rows and columns in ExcelA cell is the intersection of rows and columns. Rows and columns make the software that is called excel. The area of excel worksheet is divided into rows and columns and at any point in time, if we want to refer a particular location of this area, we need to refer a cell.read more?
- How Many Rows and Columns in Excel (2003, 2007, 2010, 2016)
- Example #1 – Rows & Columns in Excel
- Example #2 – Traveling with Rows & Columns
- Example #3 – Show Minimal Number of Rows & Columns to Users
- Example #4 – Restrict User’s Action to Minimal Rows & Columns
- Things to Remember
- Recommended Articles
You can download this How Many Rows and Columns Excel Template here – How Many Rows and Columns Excel Template
Example #1 – Rows & Columns in Excel
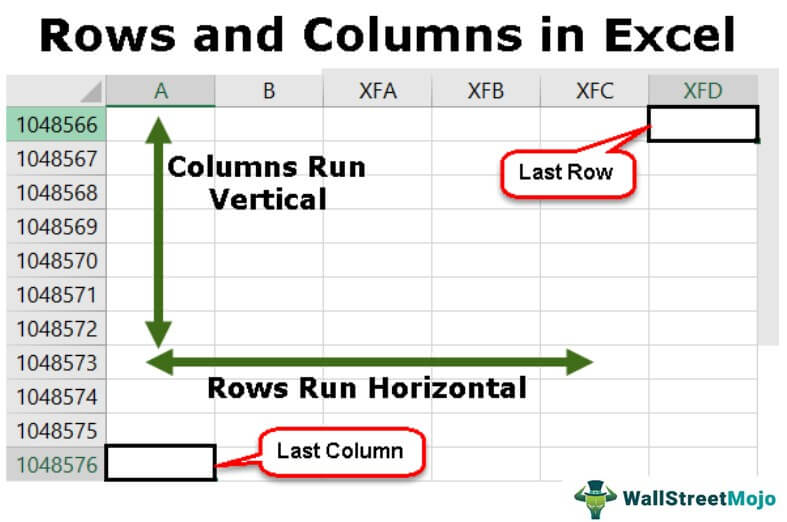
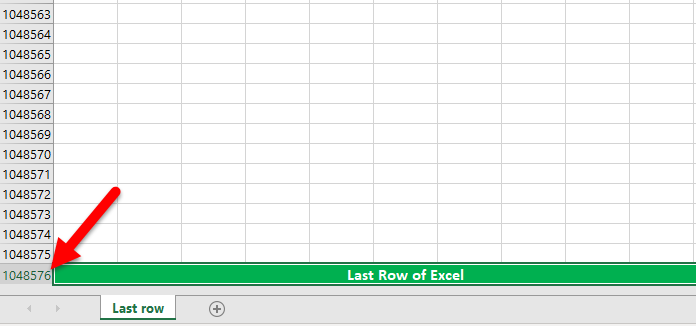
- From Excel 2007 onwards (2010, 2016, etc) we have exactly 10,48,576 rows and 16,384 columns.
- But with the Excel 2003 version, we have only 65,000 rows and 255 columns. So, in this cowardly data world, this will never be enough.
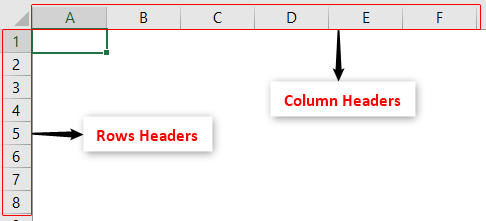
- We have headers for rows and columns in Excel for both of them. For row headersExcel Row Header is the grey column on the left side of column 1 in the worksheet that contains the numbers (1, 2, 3, etc.). To hide or reveal row and column headers, press ALT + W + V + H.read more, we have numerical headers like 1, 2, and 3. We have alphabetic headers like A, B, and C regarding columns.
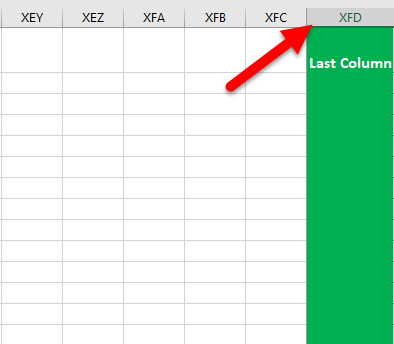
- By looking at the row number, we can say that this is the last row. But when it comes to columns, this iis not straightforward because of alphabetical headings. (we can change the column heading to numbers as well). So, the column header “XFD” is the last column in the worksheet.
Anyway, we know how many rows there are and how many columns there are. So, now we need to look at how to travel with these rows and columns in Excel.
Example #2 – Traveling with Rows & Columns
When it comes to excelling worksheets, our productivity and efficiency are decided by how well we work with rows and columns of Excel. Because when we work with data, we need to navigate through these rows and columns. So, it is important to learn about these rows and columns’ navigation.
When the worksheet is empty, it is easy to go to its last row and last column. For example, look at the below screenshot of the worksheet.

In this worksheet, the active cell is A1. Therefore, from this cell, if we want to go to the last row of the worksheet, we need to scroll down. Rather, we need to press the shortcut key “Ctrl + Down Arrow” to go to the last row in the worksheet.

Similarly, if we want to travel to the last column of the worksheet, we need to press the shortcut key “Ctrl + Right Arrow.”

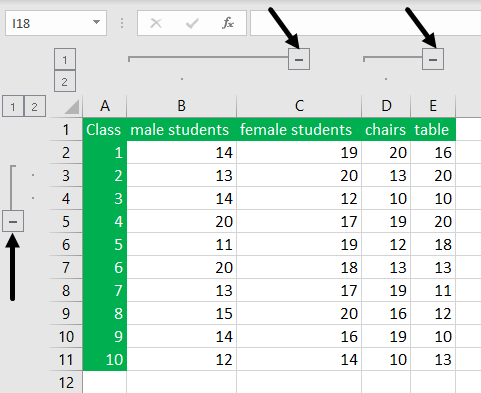
Example #3 – Show Minimal Number of Rows & Columns to Users
Often, we do not use all the rows and columns. So we may want to restrict the user’s action to minimal rows and columns.
For example, assume we need to show only 10 rows and 10 columns to show minimal rows and columns by hiding other rows. So, first, we will hide rows, and then we will hide columns.
- Select other rows except for the first ten rows to select quickly. First, select the 11th row.

- After selecting the 11th row, press the shortcut key “Ctrl + Shift + Down Arrow”; it will select all the remaining rows below.

- Right-click on the row header and choose “Hide,” or we can press the shortcut key “Ctrl + 9.” It will hide all the selected rows.

Now, users can access only 10 rows, but all the 16,000+ columns. - Similarly, we must select all the columns except the first ten columns.

- Now, right-click on the column header and choose “Hide” or press the shortcut key “Ctrl + 0” to hide all the selected columns.

They can access only ten rows and ten columns, as we can see above.


Example #4 – Restrict User’s Action to Minimal Rows & Columns
If we follow the hide method, they can unhide rows and columns and access them. But using one more way, we can restrict their actions.
For example, assume we need to limit the user action to the range of cells from A1 to G10, right-click on the worksheet and choose the “View Code” option.
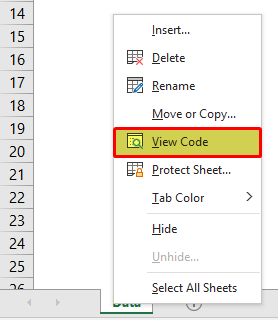
It will open up the “Visual Basic Editor” window.

Select the worksheet that we want to restrict the user’s action. In our case, the worksheet is “Data” after selecting the worksheet. Next, press the “F4” key to open the “Properties” window.
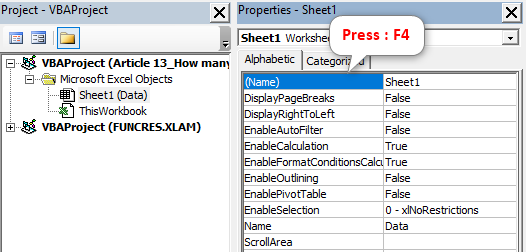
In the “Properties” window, we have an option called “Scroll Range.” In this, we must insert the range of cells that we want to give access to the users.

Now, users can access only cells from A1 to G10.
Things to Remember
The number of rows and columns from Excel 2007 onwards is 10,48,576 rows and 16,384 columns.
Recommended Articles
This article has been a guide to How Many Rows and Columns in Excel. Here, we discuss how to show the minimal number of rows and columns to users, practical examples, and a downloadable Excel template. You may learn more about Excel from the following articles: –
- Rows vs. Columns in Excel
- Rows to Columns in Excel
- Convert Columns to Rows in Excel
Excel for Microsoft 365 Excel for Microsoft 365 for Mac Excel for the web Excel 2021 Excel 2021 for Mac Excel 2019 Excel 2019 for Mac Excel 2016 Excel 2016 for Mac Excel 2013 More…Less
If you need a quick way to count rows that contain data, select all the cells in the first column of that data (it may not be column A). Just click the column header. The status bar, in the lower-right corner of your Excel window, will tell you the row count.
Do the same thing to count columns, but this time click the row selector at the left end of the row.
The status bar then displays a count, something like this:

If you select an entire row or column, Excel counts just the cells that contain data. If you select a block of cells, it counts the number of cells you selected. If the row or column you select contains only one cell with data, the status bar stays blank.
Notes:
-
If you need to count the characters in cells, see Count characters in cells.
-
If you want to know how many cells have data, see Use COUNTA to count cells that aren’t blank.
-
You can control the messages that appear in the status bar by right-clicking the status bar and clicking the item you want to see or remove. For more information, see Excel status bar options.
Need more help?
You can always ask an expert in the Excel Tech Community or get support in the Answers community.
Need more help?
Up there amongst the big questions for Excel newbies is
’How big is Excel?
‘How many rows does an Excel worksheet have?’
‘How many columns in an Excel worksheet?’
Quick Answer: 1,048,576 rows and 16,384 columns!
That’s more than you’ll ever use. Keep reading to find how to see this for yourself.
Handy shortcuts to get around your spreadsheet in a flash
How to resize columns and rows without going one-by-one
1. How columns and rows are referenced
All the columns are lettered and all the rows are numbered.

Fig 01: Columns are lettered and rows are numbered
If you were to scroll across the page you reach column Z, then the letters start doubling up with AA, AB and so on. It’s fair to say that if you started scrolling across or down the page now, you would still be scrolling this time tomorrow!

Fig 02: Column Z moves to column AA
2. How many rows and columns are there in Excel
Try this.
1. Open a blank spreadsheet.
2. Hold down CTRL and press the right arrow key (cursor key) on the keyboard. You are taken to the right-most column. In the modern versions of Excel this is column XFD, which is 16,384 columns. In older versions of Excel (2003 and prior) the last column was IV which is 256 columns. Which is still plenty!

Fig 03: The last column is labelled XFD
3. Hold down CTRL and press the down arrow key (cursor key) on the keyboard. You are taken to the bottom row. In the modern versions of Excel there are 1,048,576 rows. In older versions of Excel (2003 and prior) there were 65,536 rows.

Fig 04: Last column in Excel is 1, 048, 576
4. To return to cell A1, press CTRL and HOME together. This shortcut works in most programs. For example, in Microsoft Word, pressing CTRL HOME will take you to the top of page 1. In Microsoft PowerPoint, pressing CTRL HOME will return you to slide 1.
So as you can see there are more than enough columns and rows.
Several years ago, I met somebody who did run out of rows! Okay, his situation was unusual.
He ran an energy company. Live energy price data was fed into his system every couple of seconds and filtered through to his spreadsheets. His software used this data to buy low and sell high on autopilot. But every couple of weeks he ran out of rows.
But I’m sure you’ll be fine!
What do you think?
How to write your first formula and ensure it works!
3. What next?
I hope you found plenty of value in this post. I’d love to hear your biggest takeaway in the comments below together with any questions you may have.
Have a fantastic day.


About the author
Jason Morrell
Jason loves to simplify the hard stuff, cut the fluff and share what actually works. Things that make a difference. Things that slash hours from your daily work tasks. He runs a software training business in Queensland, Australia, lives on the Gold Coast with his wife and 4 kids and often talks about himself in the third person!
SHARE
In Microsoft Excel, a column runs vertically in the grid layout of a worksheet. Vertical columns are numbered with alphabetic values such as A, B, C. Horizontal rows are numbered with numeric values such 1, 2, 3.
Contents
- 1 What are the rows and columns in Excel?
- 2 What is column with example?
- 3 What is row and column?
- 4 What comes first row or column?
- 5 What is row and?
- 6 What are columns used for?
- 7 What column means?
- 8 How do I use columns in Excel?
- 9 What is column in Table?
- 10 Is a column across or down?
- 11 What is Cell of MS Excel?
- 12 What is the difference between row and column in a table?
- 13 What is the matrix called?
- 14 Why is Julia column-major?
- 15 What is column article?
- 16 How many column are there in Excel?
- 17 How can you split a table?
- 18 What are the 3 main parts of a column?
- 19 Why are columns so strong?
- 20 What is difference between column and columns in Excel?
What are the rows and columns in Excel?
Row and Column Basics
MS Excel is in tabular format consisting of rows and columns. Row runs horizontally while Column runs vertically. Each row is identified by row number, which runs vertically at the left side of the sheet. Each column is identified by column header, which runs horizontally at the top of the sheet.
What is column with example?
A column is a vertical series of cells in a chart, table, or spreadsheet. Below is an example of a Microsoft Excel spreadsheet with column headers (column letter) A, B, C, D, E, F, G, and H. As you can see in the image, the last column H is the highlighted column in red and the selected cell D8 is in the D column.
What is row and column?
A row is a series of data put out horizontally in a table or spreadsheet while a column is a vertical series of cells in a chart, table, or spreadsheet. Rows go across left to right. On the other hand, Columns are arranged from up to down.
What comes first row or column?
By convention, rows are listed first; and columns, second. Thus, we would say that the dimension (or order) of the above matrix is 3 x 4, meaning that it has 3 rows and 4 columns. Numbers that appear in the rows and columns of a matrix are called elements of the matrix.
What is row and?
1 : a number of objects arranged in a usually straight line a row of bottles also : the line along which such objects are arranged planted the corn in parallel rows. 2a : way, street.
What are columns used for?
Columns are frequently used to support beams or arches on which the upper parts of walls or ceilings rest. In architecture, “column” refers to such a structural element that also has certain proportional and decorative features.
What column means?
Definition of column
1a : a vertical arrangement of items printed or written on a page columns of numbers. b : one of two or more vertical sections of a printed page separated by a rule or blank space The news article takes up three columns. c : an accumulation arranged vertically : stack columns of paint cans.
How do I use columns in Excel?
To insert columns:
- Select the column heading to the right of where you want the new column to appear. For example, if you want to insert a column between columns D and E, select column E.
- Click the Insert command on the Home tab. Clicking the Insert command.
- The new column will appear to the left of the selected column.
What is column in Table?
A column is collection of cells aligned vertically in a table. A field is an element in which one piece of information is stored, such as the eceived field. Usually, a column in a table contains the values of a single field.
Is a column across or down?
Columns run vertically, up and down.Rows, then, are the opposite of columns and run horizontally.
What is Cell of MS Excel?
Cells are the boxes you see in the grid of an Excel worksheet, like this one. Each cell is identified on a worksheet by its reference, the column letter and row number that intersect at the cell’s location. This cell is in column D and row 5, so it is cell D5. The column always comes first in a cell reference.
What is the difference between row and column in a table?
Rows are a group of cells arranged horizontally to provide uniformity. Columns are a group of cells aligned vertically, and they run from top to bottom.
What is the matrix called?
A matrix (whose plural is matrices) is a rectangular array of numbers, symbols, or expressions, arranged in rows and columns. A matrix with m rows and n columns is called an m×n m × n matrix or m -by-n matrix, where m and n are called the matrix dimensions.
Why is Julia column-major?
Probably because most numeric libraries were originally written in Fortran, which uses column-major storage, which then mimics the fact that vectors in math are by convention columns. Same applies to Matlab, which started as a convenient way to speak to some Fortran linear algebra packages.
What is column article?
A column is a recurring piece or article in a newspaper, magazine or other publication, where a writer expresses their own opinion in few columns allotted to them by the newspaper organisation. Columns are written by columnists.
How many column are there in Excel?
Worksheet and workbook specifications and limits
| Feature | Maximum limit |
|---|---|
| Open workbooks | Limited by available memory and system resources |
| Total number of rows and columns on a worksheet | 1,048,576 rows by 16,384 columns |
| Column width | 255 characters |
| Row height | 409 points |
How can you split a table?
Split a table
- Put your cursor on the row that you want as the first row of your second table. In the example table, it’s on the third row.
- On the LAYOUT tab, in the Merge group, click Split Table. The table splits into two tables.
What are the 3 main parts of a column?
Classical columns traditionally have three main parts:
- The base. Most columns (except the early Doric) rest on a round or square base, sometimes called a plinth.
- The shaft. The main part of the column, the shaft, may be smooth, fluted (grooved), or carved with designs.
- The capital.
Why are columns so strong?
Columns are vertical structural members designed to pass through a compressive load.Engineers have to design columns that are very strong under compression in order to keep buildings safe.
What is difference between column and columns in Excel?
Each row has a unique number that identifies it. A column is a vertical line of cells. Each column has a unique letter that identifies it.
Comparative Table.
| Basis | Excel Rows | Excel Columns |
|---|---|---|
| Range | Rows are ranging from 1 to 1,048,576 | Columns are ranging from A to XFD. |
Содержание
- Rows and Columns in Excel
- Rows and Columns in Excel
- Examples of Rows and Columns in Excel
- Example #1 – Rows of Excel
- Example #2 – Column of Excel
- Example #3 – Cell of Excel
- Example #4 – Deleting a Row
- Example #5 – Deleting a Column
- Example #6 – Inserting a Row
- Example #7 – Inserting a Column
- Example #8 – Hiding a Row
- Example #9 – Hiding a Column
- Example #10 – Increasing the Width of the Row
- Example #11 – Increasing the Width of the Column
- Example #12 – Moving a Row
- Example #13 – Moving a Column
- Example #14 – Copying a Row
- Example #15 – Copying a Column
- Example #16 – Autofit Height of the Row
- Example #17 – Autofit Width of the Column
- Example #18 – Grouping Rows
- Example #19 – Grouping Columns
- Example #20 – Setting Default Width of Rows and Columns in Excel
- How to use Rows and Columns in Excel?
- Things to Remember
- Recommended Articles
- What Are Columns In Excel?
- What are the rows and columns in Excel?
- What is column with example?
- What is row and column?
- What comes first row or column?
- What is row and?
- What are columns used for?
- What column means?
- How do I use columns in Excel?
- What is column in Table?
- Is a column across or down?
- What is Cell of MS Excel?
- What is the difference between row and column in a table?
- What is the matrix called?
- Why is Julia column-major?
- What is column article?
- How many column are there in Excel?
- How can you split a table?
- What are the 3 main parts of a column?
- Why are columns so strong?
- What is difference between column and columns in Excel?
- How many sheets, rows, and columns can a spreadsheet have?
- How to get to the last row of a worksheet
- How to get to the last column of a worksheet
- How many sheets are there in an Excel workbook?
- How many characters can fit into a single cell?
- How are rows and columns labeled?
Rows and Columns in Excel


Rows and Columns in Excel
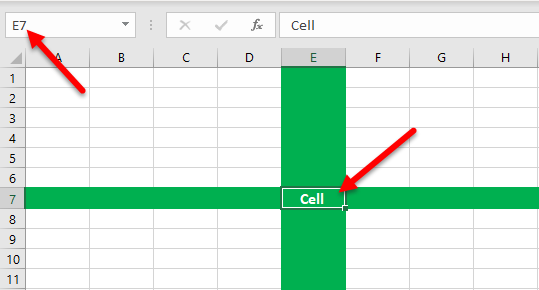
Rows and columns make the software that is called Excel. The area of the Excel worksheet is divided into rows and columns. At any point in time, if we want to refer to a particular area’s location, we need to refer to a cell. A cell is the intersection of rows and columns.
Table of contents
Examples of Rows and Columns in Excel
Example #1 – Rows of Excel
There are a total of 10,48,576 rows that are currently available in Microsoft Excel. The rows are aligned horizontally and are ranked as 1,2,3,4…….10,48,576. Therefore, if we have to move from one row to another, we need to move downward or upward.
Example #2 – Column of Excel
There are a total of 16,384 columns that are available in Excel currently. The first column is called “A,” and the last is called “XFD.”
The columns are aligned from left to right. It means that if we need to go to another column, we must move from left to right.
The columns are vertically placed.
Example #3 – Cell of Excel
The intersection of rows and columns is called a cell. The cell location combines the column number and the row number. Hence, a cell is called “A1”,”A2,” and so on.
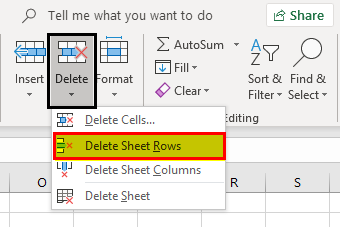
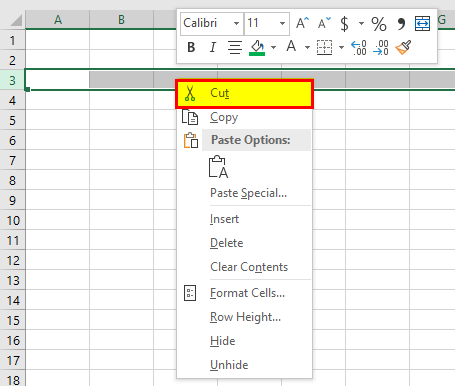
Example #4 – Deleting a Row
We can delete a row by using the keyboard shortcut that is Ctrl+”-. “
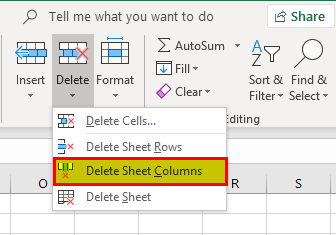
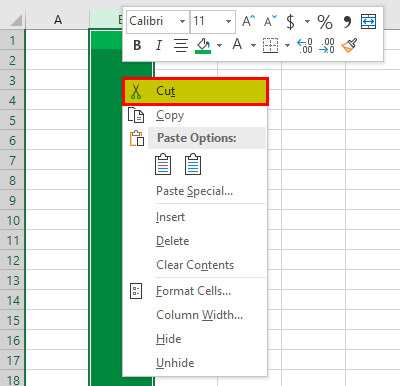
Example #5 – Deleting a Column
Example #6 – Inserting a Row
We can insert a row by using the option of Ctrl+ ”+.”

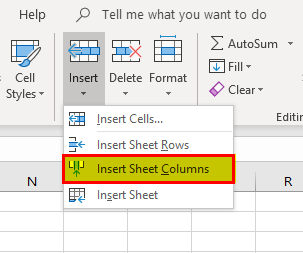
Example #7 – Inserting a Column
We can insert a column by using the option of Ctrl+ ”+.”
Example #8 – Hiding a Row
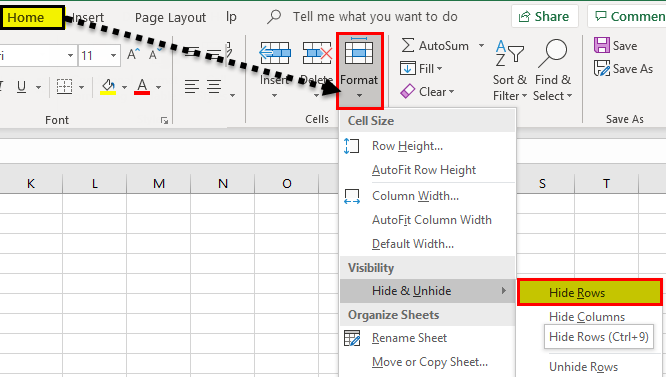
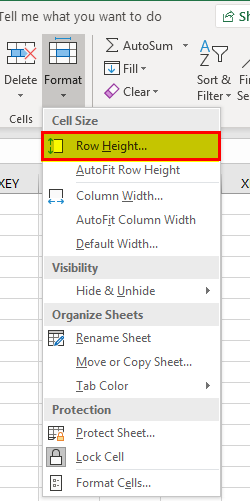
A row can be set to hide by using the menu option. First, go to the “Home” tab, select “Format,” and click on “Hide Rows.”
Example #9 – Hiding a Column
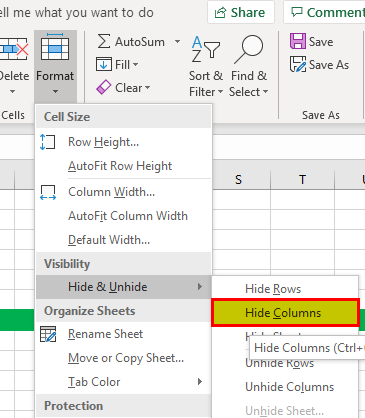
We can also hide a column by using the menu option. Go to the “Home” tab, select “Format,” and click on “Hide Columns” from the “Hide & Unhide” option.
Example #10 – Increasing the Width of the Row
Sometimes the width is also required to be increased if we have more data in the row.
Example #11 – Increasing the Width of the Column
The width of the column needs to increase if the text’s length is more than that column’s width.

Example #12 – Moving a Row
We can also move a row to another location.
Example #13 – Moving a Column
We can also move a column to another location.
Example #14 – Copying a Row
The row’s data can be copied and pasted into another row.
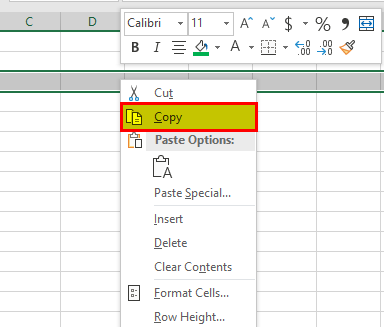
Example #15 – Copying a Column
The data of the column can also be copied into any other column.

Example #16 – Autofit Height of the Row
This feature will adjust the row height as per the text length.

Example #17 – Autofit Width of the Column
We can also adjust the column’s width per the text’s length.

Example #18 – Grouping Rows
We can also group the rows and make the data easier to understand.
Example #19 – Grouping Columns
We can group the columns and make them one cluster column.

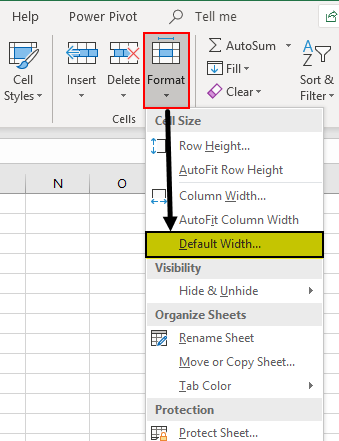
Example #20 – Setting Default Width of Rows and Columns in Excel
We can use this option if we want the height and width of the Excel column and rows to be again restored to one specific defined measure.
How to use Rows and Columns in Excel?
#1 – To delete a row and column
To delete any row or column, we need to select that row or column and right-click from the mouse. Then, we need to choose the option of “Delete.”
#2 – Inserting a row and columns
To insert a row and columns, we first need to select the location and select the option of “Insert.”
#3 – Hiding a row or column
We can also hide the row and column using the menu option of hiding.
#4 – Increasing the width
If we need to increase the width of the row and column, we can select that row or column and drag the width.
#5 – Copying
To copy a row or column, select that row, click on copy, and then paste at the required location.
#6 – Autofit
#7 – Grouping
If we need to group the rows or columns, we need to select the rows and choose the option of “Group” from the “Data” tab.
Things to Remember
- The count of available rows and columns in excelCount Of Available Rows And Columns In ExcelSince Excel 2007 to date, we have 1,048, 576 rows & 16, 384 columns. This is a great surge in the numbers compared to the 65, 536 rows & 256 columns for Excel 2003.read more cannot be increased but can be reduced as needed.
- We cannot change the sequence in which the rows are ranked. Therefore, the count will always start from 1 and increase by one.
- We cannot insert a column to the left of column “A.”
- If a column is inserted to the right of a column, then all the formatting is also copied from the left cell.
- Rows are numbered. However, the columns are arranged alphabetically.
Recommended Articles
This article is a guide to Rows and Columns in Excel. Here, we discuss how to delete, insert, hide, and copy Excel rows and columns, examples, and download Excel templates. You may learn more about Excel from the following articles: –
Источник
What Are Columns In Excel?
In Microsoft Excel, a column runs vertically in the grid layout of a worksheet. Vertical columns are numbered with alphabetic values such as A, B, C. Horizontal rows are numbered with numeric values such 1, 2, 3.
What are the rows and columns in Excel?
Row and Column Basics
MS Excel is in tabular format consisting of rows and columns. Row runs horizontally while Column runs vertically. Each row is identified by row number, which runs vertically at the left side of the sheet. Each column is identified by column header, which runs horizontally at the top of the sheet.
What is column with example?
A column is a vertical series of cells in a chart, table, or spreadsheet. Below is an example of a Microsoft Excel spreadsheet with column headers (column letter) A, B, C, D, E, F, G, and H. As you can see in the image, the last column H is the highlighted column in red and the selected cell D8 is in the D column.
What is row and column?
A row is a series of data put out horizontally in a table or spreadsheet while a column is a vertical series of cells in a chart, table, or spreadsheet. Rows go across left to right. On the other hand, Columns are arranged from up to down.
What comes first row or column?
By convention, rows are listed first; and columns, second. Thus, we would say that the dimension (or order) of the above matrix is 3 x 4, meaning that it has 3 rows and 4 columns. Numbers that appear in the rows and columns of a matrix are called elements of the matrix.
What is row and?
1 : a number of objects arranged in a usually straight line a row of bottles also : the line along which such objects are arranged planted the corn in parallel rows. 2a : way, street.
What are columns used for?
Columns are frequently used to support beams or arches on which the upper parts of walls or ceilings rest. In architecture, “column” refers to such a structural element that also has certain proportional and decorative features.
What column means?
Definition of column
1a : a vertical arrangement of items printed or written on a page columns of numbers. b : one of two or more vertical sections of a printed page separated by a rule or blank space The news article takes up three columns. c : an accumulation arranged vertically : stack columns of paint cans.
How do I use columns in Excel?
To insert columns:
- Select the column heading to the right of where you want the new column to appear. For example, if you want to insert a column between columns D and E, select column E.
- Click the Insert command on the Home tab. Clicking the Insert command.
- The new column will appear to the left of the selected column.
What is column in Table?
A column is collection of cells aligned vertically in a table. A field is an element in which one piece of information is stored, such as the eceived field. Usually, a column in a table contains the values of a single field.
Is a column across or down?
Columns run vertically, up and down.Rows, then, are the opposite of columns and run horizontally.
What is Cell of MS Excel?
Cells are the boxes you see in the grid of an Excel worksheet, like this one. Each cell is identified on a worksheet by its reference, the column letter and row number that intersect at the cell’s location. This cell is in column D and row 5, so it is cell D5. The column always comes first in a cell reference.
What is the difference between row and column in a table?
Rows are a group of cells arranged horizontally to provide uniformity. Columns are a group of cells aligned vertically, and they run from top to bottom.
What is the matrix called?
A matrix (whose plural is matrices) is a rectangular array of numbers, symbols, or expressions, arranged in rows and columns. A matrix with m rows and n columns is called an m×n m × n matrix or m -by-n matrix, where m and n are called the matrix dimensions.
Why is Julia column-major?
Probably because most numeric libraries were originally written in Fortran, which uses column-major storage, which then mimics the fact that vectors in math are by convention columns. Same applies to Matlab, which started as a convenient way to speak to some Fortran linear algebra packages.
What is column article?
A column is a recurring piece or article in a newspaper, magazine or other publication, where a writer expresses their own opinion in few columns allotted to them by the newspaper organisation. Columns are written by columnists.
How many column are there in Excel?
Worksheet and workbook specifications and limits
| Feature | Maximum limit |
|---|---|
| Open workbooks | Limited by available memory and system resources |
| Total number of rows and columns on a worksheet | 1,048,576 rows by 16,384 columns |
| Column width | 255 characters |
| Row height | 409 points |
How can you split a table?
Split a table
- Put your cursor on the row that you want as the first row of your second table. In the example table, it’s on the third row.
- On the LAYOUT tab, in the Merge group, click Split Table. The table splits into two tables.
What are the 3 main parts of a column?
Classical columns traditionally have three main parts:
- The base. Most columns (except the early Doric) rest on a round or square base, sometimes called a plinth.
- The shaft. The main part of the column, the shaft, may be smooth, fluted (grooved), or carved with designs.
- The capital.
Why are columns so strong?
Columns are vertical structural members designed to pass through a compressive load.Engineers have to design columns that are very strong under compression in order to keep buildings safe.
What is difference between column and columns in Excel?
Each row has a unique number that identifies it. A column is a vertical line of cells. Each column has a unique letter that identifies it.
Comparative Table.
Источник
How many sheets, rows, and columns can a spreadsheet have?
The number of cells, columns, rows, and sheets supported by a spreadsheet depend on the software used, and the data contained in the spreadsheet. Below is a list of the maximum number of rows, columns, cells, and individual sheets supported by various spreadsheet software.
The below values are the theoretical limits. Other factors, including how much memory the computer has, determine how many rows, columns, and cells are supported.
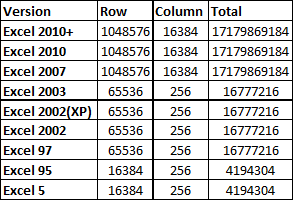
| Version | Rows | Columns | Cells | Sheets |
|---|---|---|---|---|
| Excel 2019 | 1,048,576 | 16,384 XFD | 17,179,869,184 | * |
| Excel 2016 | 1,048,576 | 16,384 XFD | 17,179,869,184 | * |
| Excel 2013 | 1,048,576 | 16,384 XFD | 17,179,869,184 | * |
| Excel 2007 | 1,048,576 | 16,384 XFD | 17,179,869,184 | * |
| Excel 2003 and earlier | 65,536 | 256 | 16,777,216 | * |
| Google Sheets | 256 | 400,000 | 200 | |
| OpenOffice Calc 3 | 1,048,576 | 16,384 | 17,179,869,184 | 256 |
| OpenOffice Calc 2 | 65,536 | 256 | 16,777,216 | 256 |
| Gnumeric | 65,536 | 256 | 16,777,216 | * |
| KSpread | 32,767 | 32,767 | 1,073,676,289 | * |
| Lotus 1-2-3 | 65,536 | 256 | 16,777,216 | 256 |
| LibreOffice Calc | 1,048,576 | 1,024 | 1,073,741,824 | 10,000 |
* Dependent on memory
How to get to the last row of a worksheet
Press and hold down Ctrl and press the down arrow key.
How to get to the last column of a worksheet
Press and hold down Ctrl and press the right arrow key.
How many sheets are there in an Excel workbook?
By default, there are three sheets in a new workbook in all versions of Excel, though users can create as many as their computer memory allows. These three worksheets are named Sheet1, Sheet2, and Sheet3.
How many characters can fit into a single cell?
The total number of characters a cell can contain is 32,767.
How are rows and columns labeled?
In all spreadsheet programs, including Microsoft Excel, rows are labeled using numbers (e.g., 1 to 1,048,576). All columns are labeled with letters A through Z, then AA through ZZ, etc. For example, after the letter Z, the next column is AA, AB, AC, . AZ and then incrementing to BA, BB, BC, etc.
To identify a cell, give both the column and the row. For example, the first cell is always located in column A, on row 1, so the cell is labeled A1.
Источник
Updated: 06/30/2019 by
The number of cells, columns, rows, and sheets supported by a spreadsheet depend on the software used, and the data contained in the spreadsheet. Below is a list of the maximum number of rows, columns, cells, and individual sheets supported by various spreadsheet software.
Note
The below values are the theoretical limits. Other factors, including how much memory the computer has, determine how many rows, columns, and cells are supported.
| Version | Rows | Columns | Cells | Sheets |
|---|---|---|---|---|
| Excel 2019 | 1,048,576 | 16,384 XFD | 17,179,869,184 | * |
| Excel 2016 | 1,048,576 | 16,384 XFD | 17,179,869,184 | * |
| Excel 2013 | 1,048,576 | 16,384 XFD | 17,179,869,184 | * |
| Excel 2007 | 1,048,576 | 16,384 XFD | 17,179,869,184 | * |
| Excel 2003 and earlier | 65,536 | 256 | 16,777,216 | * |
| Google Sheets | 256 | 400,000 | 200 | |
| OpenOffice Calc 3 | 1,048,576 | 16,384 | 17,179,869,184 | 256 |
| OpenOffice Calc 2 | 65,536 | 256 | 16,777,216 | 256 |
| Gnumeric | 65,536 | 256 | 16,777,216 | * |
| KSpread | 32,767 | 32,767 | 1,073,676,289 | * |
| Lotus 1-2-3 | 65,536 | 256 | 16,777,216 | 256 |
| LibreOffice Calc | 1,048,576 | 1,024 | 1,073,741,824 | 10,000 |
* Dependent on memory
How to get to the last row of a worksheet
Press and hold down Ctrl and press the down arrow key.
How to get to the last column of a worksheet
Press and hold down Ctrl and press the right arrow key.
How many sheets are there in an Excel workbook?
By default, there are three sheets in a new workbook in all versions of Excel, though users can create as many as their computer memory allows. These three worksheets are named Sheet1, Sheet2, and Sheet3.
How many characters can fit into a single cell?
The total number of characters a cell can contain is 32,767.
How are rows and columns labeled?
In all spreadsheet programs, including Microsoft Excel, rows are labeled using numbers (e.g., 1 to 1,048,576). All columns are labeled with letters A through Z, then AA through ZZ, etc. For example, after the letter Z, the next column is AA, AB, AC, …, AZ and then incrementing to BA, BB, BC, etc.
To identify a cell, give both the column and the row. For example, the first cell is always located in column A, on row 1, so the cell is labeled A1.
Jan 11, 2020 • edited Jan 12, 2020
it depends on the Excel version you are using.
The number of cells, columns, rows, and sheets supported by a spreadsheet depend on the software being used, and the data contained in the spreadsheet. Below is a list of the maximum number of rows, columns, cells, and individual sheets supported by various spreadsheet software.
| Version | Rows | Columns | Cells | Sheets |
|---|---|---|---|---|
| Excel 2019 | 1,048,576 | 16,384 XFD | 17,179,869,184 | * |
| Excel 2016 | 1,048,576 | 16,384 XFD | 17,179,869,184 | * |
| Excel 2013 | 1,048,576 | 16,384 XFD | 17,179,869,184 | * |
| Excel 2007 | 1,048,576 | 16,384 XFD | 17,179,869,184 | * |
| Excel 2003 and earlier | 65,536 | 256 | 16,777,216 | * |
| Google Sheets | 256 | 400,000 | 200 | |
| OpenOffice Calc 3 | 1,048,576 | 16,384 | 17,179,869,184 | 256 |
| OpenOffice Calc 2 | 65,536 | 256 | 16,777,216 | 256 |
| Gnumeric | 65,536 | 256 | 16,777,216 | * |
| KSpread | 32,767 | 32,767 | 1,073,676,289 | * |
| Lotus 1-2-3 | 65,536 | 256 | 16,777,216 | 256 |
| LibreOffice Calc | 1,048,576 | 1,024 | 1,073,741,824 | 10,000 |
For MS Excel 2010, Row numbers ranges from 1 to 1048576; in total 1048576 rows, and Columns ranges from A to XFD; in total 16384 columns.
There are 220=1,048,576
rows, and 214=16,384
columns in an an Excel worksheet, at least since Excel 2007.
To find out how many rows, you can open an empty worksheet, and press CTRL-Down-Arrow key combination on your keyboard. The cursor will move all the way to the bottom row of the sheet. Look for the row number on the left.
To find out how many columns, you can press CTRL-Right-Arrow key combination in an empty worksheet, and you will find yourself at column XFD. So how many columns is that?
There are 26
columns labeled A through Z, and then there are 262=676 columns labeled AA through AZ. Then start the columns with 3-letter names. Treat AAA like 000 in base 26 arithmetic. Treat A as the 0 digit, and Z as the 25 digit in base 26 numerals. So X is the 23 digit, F is the 5 digit, and D is the 3 digit, and XFD is the base-26 for 23×262+5×26+3×1=15,681
. So the three-letter column names run from 0 to 15,681, so there are 15,682 of them.
So altogether there are 26 + 676 + 15,682 = 16,384 columns.
250+ Excel Keyboards Shortcuts List for you
How to Count Blank/Nonblank Cells