
Have you been losing sleep figuring out the best way to maximize profitability and minimize risk on your business investments? Stop tossing and turning. Relax and go with the flow.
Cash, that is. Take a look at your cash flow, or what goes into and what goes out of your business. Positive cash flow is the measure of cash coming in (sales, earned interest, stock issues, and so on), whereas negative cash flow is the measure of cash going out (purchases, wages, taxes, and so on). Net cash flow is the difference between your positive cash flow and your negative cash flow, and answers that most fundamental of business questions: How much money is left in the till?
To grow your business, you need to make key decisions about where to invest your money over the long term. Microsoft Excel can help you compare options and make the right choices, so that you can rest easy both day and night.
Asking questions about capital investment projects
If you want to take your money out of the till, make it working capital, and invest it in the projects that make up your business, you need to ask some questions about those projects:
-
Is a new long-term project going to be profitable? When?
-
Is the money better invested in another project?
-
Should I invest even more in an ongoing project, or is it time to cut my losses?
Now take a closer look at each of those projects, and ask:
-
What are the negative and positive cash flows for this project?
-
What impact will a large initial investment have, and how much is too much?
In the end, what you really need are bottom-line numbers that you can use to compare project choices. But to get there, you must incorporate the time value of money into your analysis.
My papa once told me, «Son, it’s better to get your money as soon as possible and hold on to it as long as possible.» Later in life, I learned why. You can invest this money at a compounded interest rate, which means that your money can make you more money — and then some. In other words, when cash goes out or comes in is just as important as how much cash goes out or comes in.
Answering questions by using NPV and IRR
There are two financial methods that you can use to help you answer all of these questions: net present value (NPV) and internal rate of return (IRR). Both NPV and IRR are referred to as discounted cash flow methods because they factor the time value of money into your capital investment project evaluation. Both NPV and IRR are based on a series of future payments (negative cash flow), income (positive cash flow), losses (negative cash flow), or «no-gainers» (zero cash flow).
NPV
NPV returns the net value of the cash flows — represented in today’s dollars. Because of the time value of money, receiving a dollar today is worth more than receiving a dollar tomorrow. NPV calculates that present value for each of the series of cash flows and adds them together to get the net present value.
The formula for NPV is:
Where n is the number of cash flows, and i is the interest or discount rate.
IRR
IRR is based on NPV. You can think of it as a special case of NPV, where the rate of return that is calculated is the interest rate corresponding to a 0 (zero) net present value.
NPV(IRR(values),values) = 0
When all negative cash flows occur earlier in the sequence than all positive cash flows, or when a project’s sequence of cash flows contains only one negative cash flow, IRR returns a unique value. Most capital investment projects begin with a large negative cash flow (the up-front investment) followed by a sequence of positive cash flows, and, therefore, have a unique IRR. However, sometimes there can be more than one acceptable IRR, or sometimes none at all.
Comparing projects
NPV determines whether a project earns more or less than a desired rate of return (also called the hurdle rate) and is good at finding out whether a project is going to be profitable. IRR goes one step further than NPV to determine a specific rate of return for a project. Both NPV and IRR give you numbers that you can use to compare competing projects and make the best choice for your business.
Choosing the appropriate Excel function
hich Office Excel functions can you use to calculate NPV and IRR? There are five: NPV function, XNPV function, IRR function, XIRR function, and MIRR function. Which one you choose depends on the financial method that you prefer, whether cash flows occur at regular intervals, and whether the cash flows are periodic.
Note: Cash flows are specified as negative, positive, or zero values. When you use these functions, pay particular attention to how you handle immediate cash flows that occur at the beginning of the first period and all of the other cash flows that occur at the ends of periods.
|
Function syntax |
Use when you want to |
Comments |
|
|
Determine the net present value using cash flows that occur at regular intervals, such as monthly or annually. |
Each cash flow, specified as a value, occurs at the end of a period. If there is an additional cash flow at the start of the first period, it should be added to the value returned by the NPV function. See Example 2 in the NPV function Help topic. |
|
|
Determine the net present value using cash flows that occur at irregular intervals. |
Each cash flow, specified as a value, occurs at a scheduled payment date. |
|
|
Determine the internal rate of return using cash flows that occur at regular intervals, such as monthly or annually. |
Each cash flow, specified as a value, occurs at the end of a period. IRR is calculated through an iterative search procedure that starts with an estimate for IRR — specified as a guess — and then repeatedly varies that value until a correct IRR is reached. Specifying a guess argument is optional; Excel uses 10% as the default value. If there is more than one acceptable answer, the IRR function only returns the first one it finds. If the IRR doesn’t find any answer, it returns a #NUM! error value. Use a different value for the guess if you get an error or if the result is not what you expected. Note A different guess might return a different result if there is more than one possible internal rate of return. |
|
|
Determine the internal rate of return using cash flows that occur at irregular intervals. |
Each cash flow, specified as a value, occurs at a scheduled payment date. XIRR is calculated through an iterative search procedure that starts with an estimate for IRR — specified as a guess — and then repeatedly varies that value until a correct XIRR is reached. Specifying a guess argument is optional; Excel uses 10% as the default value. If there is more than one acceptable answer, the XIRR function only returns the first one it finds. If the XIRR doesn’t find any answer, it returns a #NUM! error value. Use a different value for the guess if you get an error or if the result is not what you expected. Note A different guess might return a different result if there is more than one possible internal rate of return. |
|
|
Determine the modified internal rate of return using cash flows that occur at regular intervals, such as monthly or annually, and consider both the cost of investment and the interest that is received on the reinvestment of cash. |
Each cash flow, specified as a value, occurs at the end of a period, except the first cash flow, which specifies a value at the beginning of the period. The interest rate that you pay on the money that is used in the cash flows is specified in finance_rate. The interest rate that you receive on the cash flows as you reinvest them is specified in reinvest_rate. |
More information
To learn more about using NPV and IRR, see Chapter 8, «Evaluating Investments with Net Present Value Criteria,» and Chapter 9, «Internal Rate of Return,» in Microsoft Excel Data Analysis and Business Modeling by Wayne L. Winston. to learn more about this book.
Top of Page
You don’t need to use a particular app or even hire a bookkeeper to create financial documents. All you need is Microsoft Excel and a little know-how.
Most financial statements are composed of the cash flow statement, the income statement, and a balance sheet. But for now, let’s focus on the first document.
So, here’s a guide on how to make your cash flow statement in Excel.
What Is a Cash Flow Statement?
A cash flow statement is a financial document that shows the movement of cash and cash equivalents in your business. You could see where all the money in your business came from and where you spend it.
This document can tell you how you’re managing your operations. Do you have enough cash to operate your business? Can you pay off your coming obligations?
You can accurately tell the cash you have available for any given period with this.

1. Choose a Period to Cover
Cash flow statements are usually broken down into monthly periods. That way, you can see how much you gained and spent.
Most businesses start their fiscal year at their founding date. But, you can choose to begin in other months (like January) if it’s more convenient for you.
2. Prepare Your Data
Before creating your cash flow statement, you should have your data on hand. This allows you to get accurate results. So, if you have a journal, keep it within your reach.
If you don’t have a journal, a list of all your expenses and revenue is a good starting point. As long as you write down the date, payee, payor, details, and amount of every cash movement, you can make a cash flow statement.

3. Sort Your Data
When you have all your transactions, it’s time to break them down into three categories: Operations, Investments, and Financing.
Operations relate to cash made and spent for day-to-day activities. These include money made from selling products and services. Cash paid on overhead expenses, salaries, and inventory also fall under this category.
Investing covers expenses on long-term assets like property and equipment. Any cash made from the sale of these assets is also considered here.
The financing comes from investors (including the owners) and from loans. In this section, we also discuss dividends and loan repayments.
4. Create Your Excel File
To start making your Cash Flow Statement, open up Excel and create a new file.

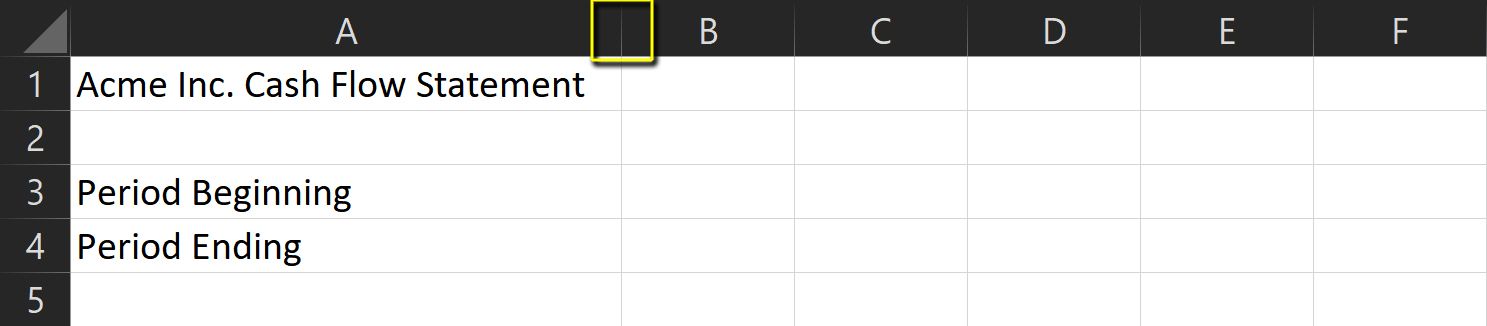
At the top row, write down your [Company Name] Cash Flow Statement. This lets you easily identify the file upon opening.
Leave one row empty for formatting, then write Period Beginning and Period Ending in the next two rows. Do this to know what period you’re exactly covering.
Again, leave one row empty, then write Cash Beginning and Cash Ending. These rows will show reflect what you have at the start and the end of the period.
5. Determine Your Subcategories
The three main categories generally remain the same across companies. However, the subcategories vary wildly. They would depend on your type of business and operations.
To help get you started, here are some excellent examples per category.
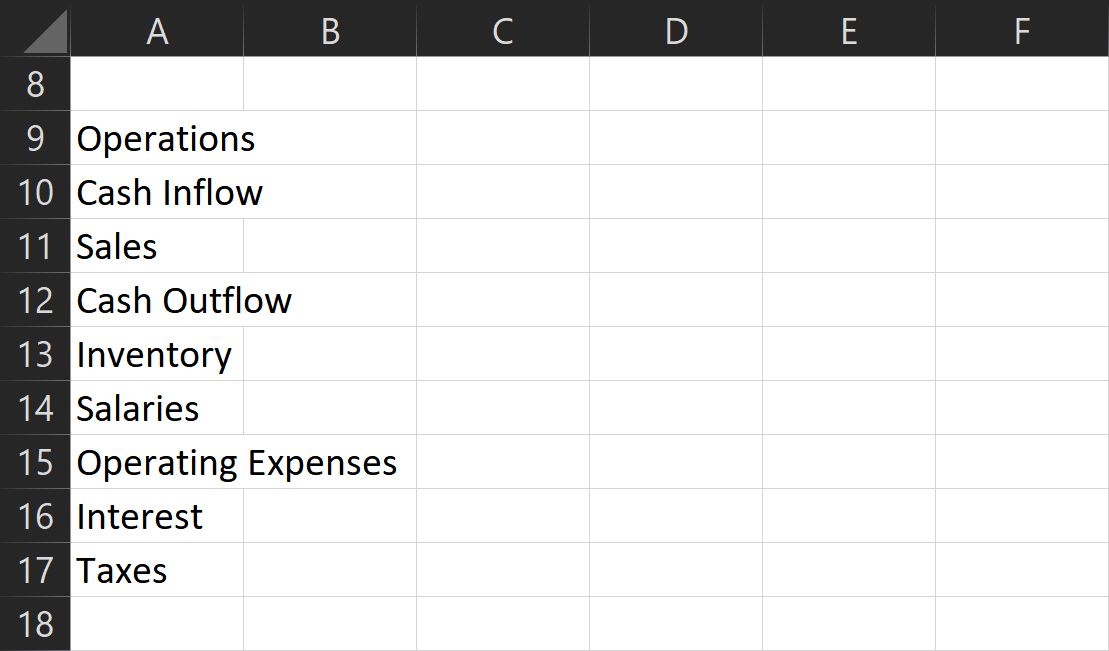
1. Operations
- Under Cash Inflow
- Sales
- Under Cash Outflow
- Inventory
- Salaries
- Operating expenses: these include overhead costs like rental, telecoms, electricity.
- Interest: this is the interest amount you pay on loans you’ve made.
- Taxes
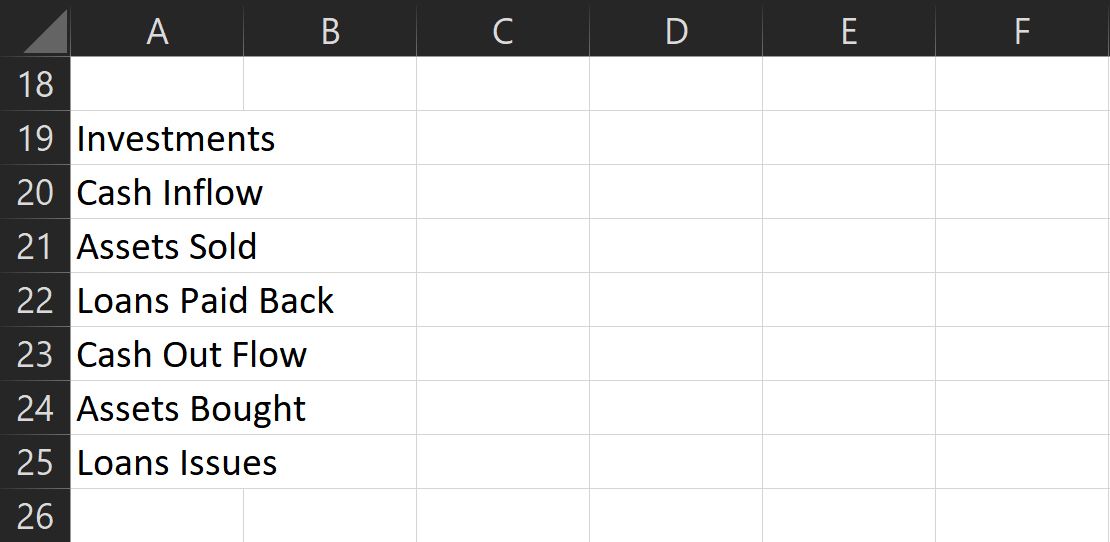
2. Investments
- Under Cash Inflow
- Assets Sold
- Loans Paid Back: these are payments to loans you’ve given to persons or institutions.
- Under Cash Outflow
- Assets Bought
- Loans Issued: these are the amount you’ve lent to persons or institutions.
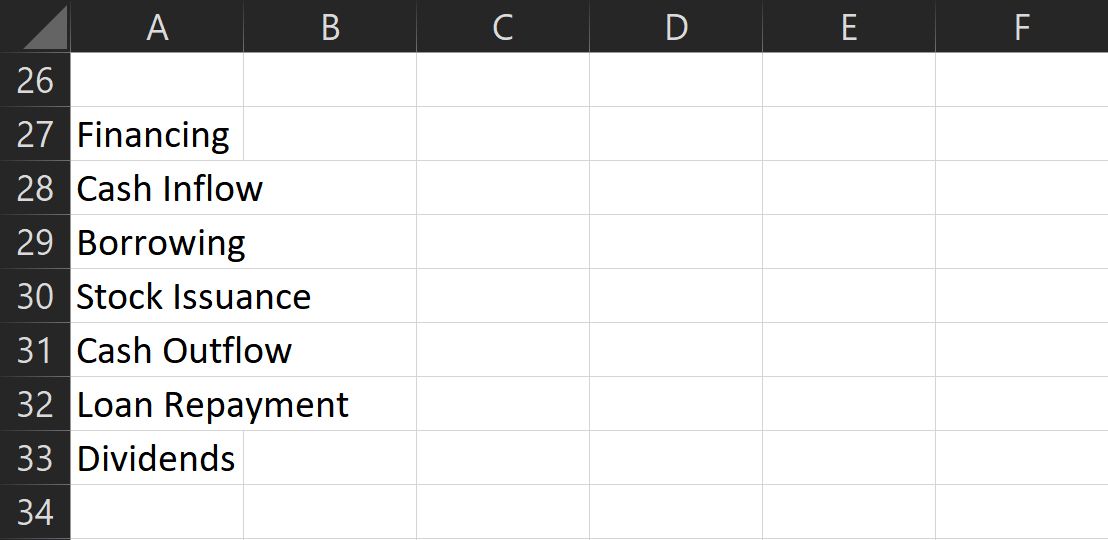
3. Financing
- Under Cash Inflow
- Borrowing: these are money you receive from lending institutions.
- Stock issuance: these are investments made by the owners and other third parties.
- Under Cash Outflow
- Loan Repayment: this is the amount you spend paying back the principal on your loans.
- Dividends: this the cash spent when sharing profits with investors and owners (including yourself).
These are the commonly used subcategories, but feel free to add more as you see fit. Just a reminder: each category must relate to actual cash spent and received.
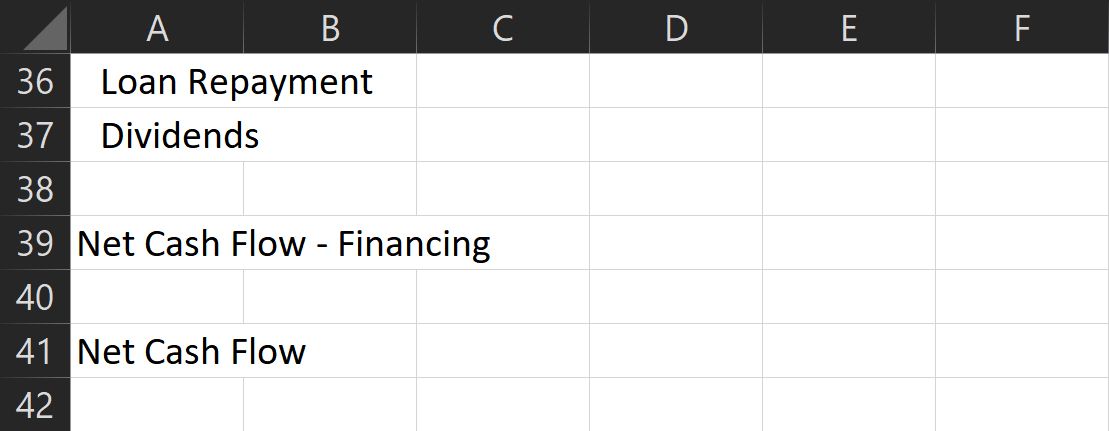
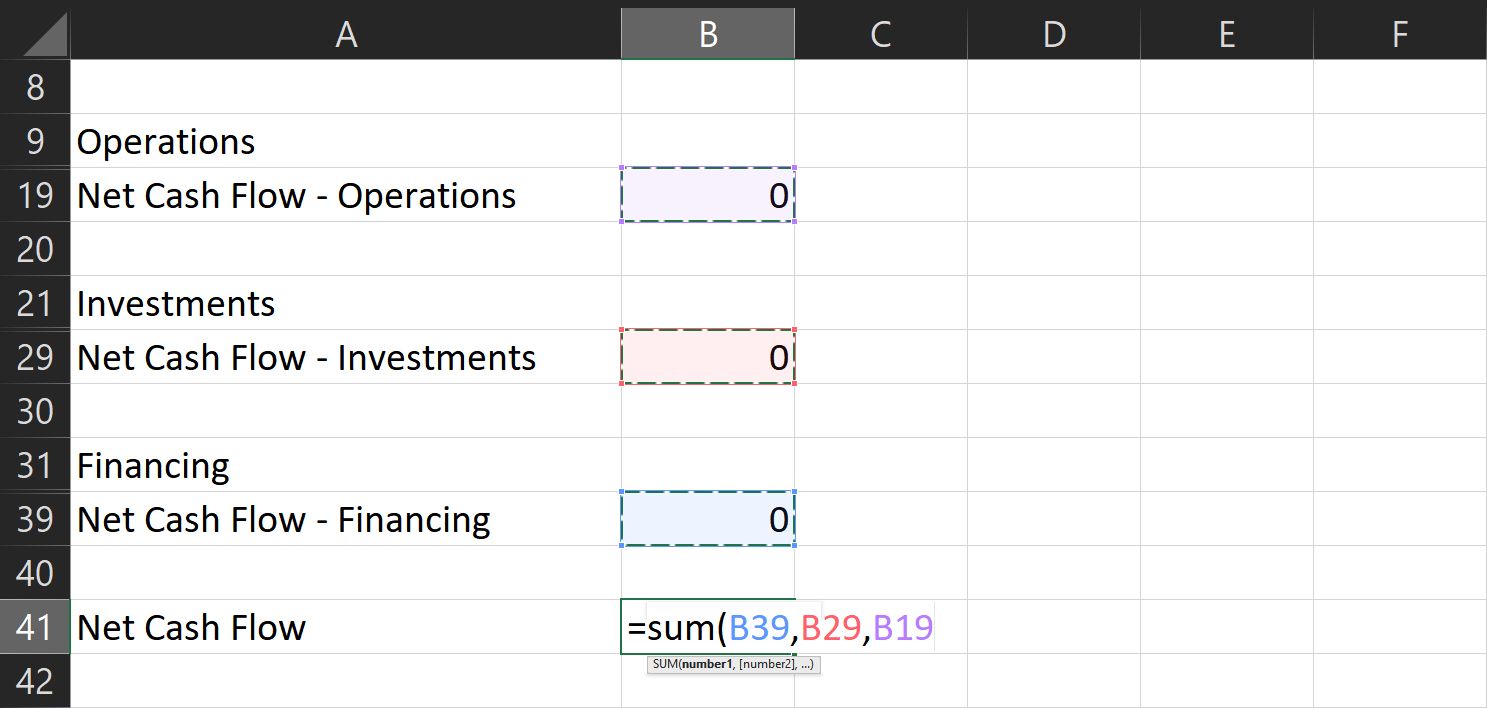
Add an empty row at the end of each category list, then write Net Cash Flow — [Category]. This is the subtotal that shows how much money you’ve made (or spent) for each section.
Finally, after listing all categories, subcategories, and subtotals, at the bottom, write Net Cash Flow. This shows the total inflow (or outflow) of money you had for the period.
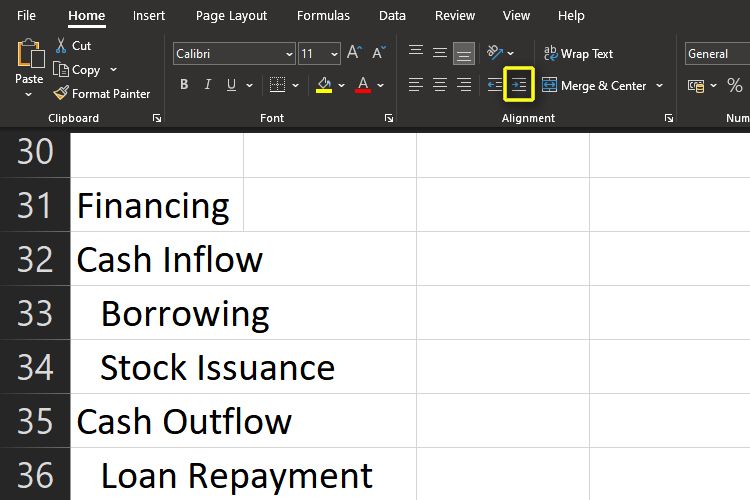
Don’t forget to add an empty row between categories (after the subtotal) and an indent for each subcategory. You can find the Indent button under the Alignment section of the Home ribbon. This allows for cleaner formatting and makes it easier to see and analyze.
Also, resize the first column to avoid its contents from spilling over to the next columns. Double-click on the line between columns A and B to do this automatically.
6. Prepare Your Formulas
Cash Flow Statement formulas are pretty simple. All you need is to use the sum command to subtotal each category.
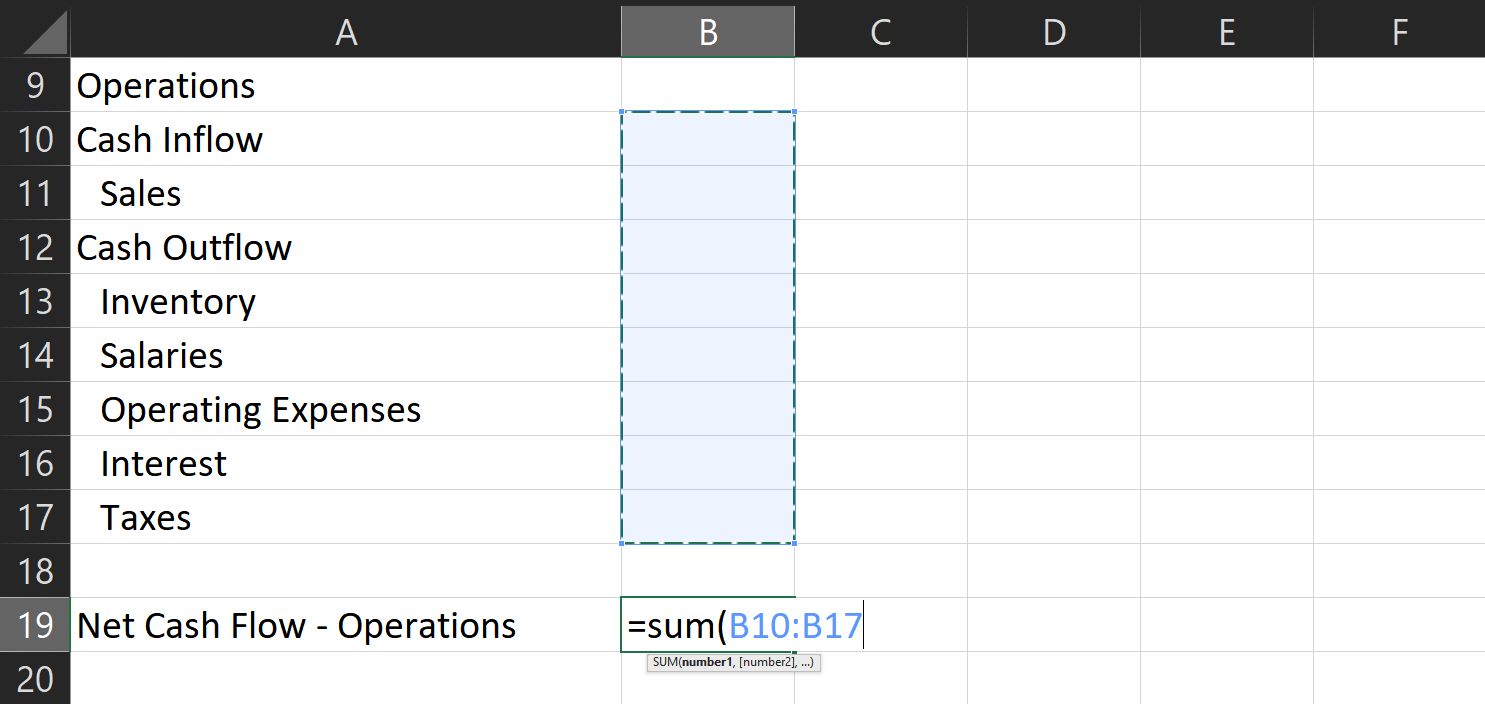
- First, select the Net Cash Flow — [Category] cell under the corresponding period and category subtotal.
- Then, type =sum( and choose all the cells for each section. Don’t forget to hold the shift key so that you can select multiple cells.
- Once done, press the Enter key, and you should see the subtotal for that category.
4. To get the net cash flow, repeat the procedure above.
5. Type =sum(, then choose each corresponding subtotal.
6. This time, hold the ctrl key to select multiple cells that aren’t beside each other.
7. Once done, press the Enter key again, and you have your total cash flow for the chose period.
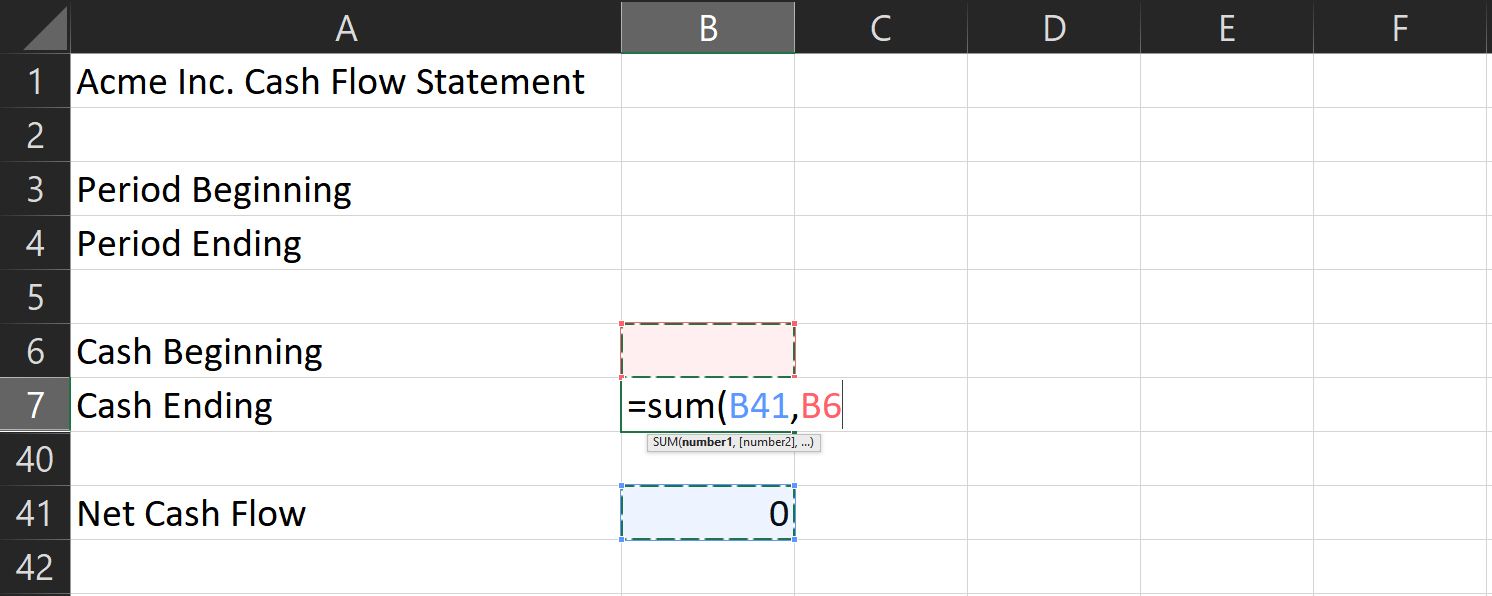
To get your cash ending:
- Go to the corresponding cell and type =sum(
- While holding down the ctrl key, click on the cells with the net cash flow and cash beginning values for the corresponding period.
- Press the Enter key, and you’ll get the amount you should have at the end of your chosen period.
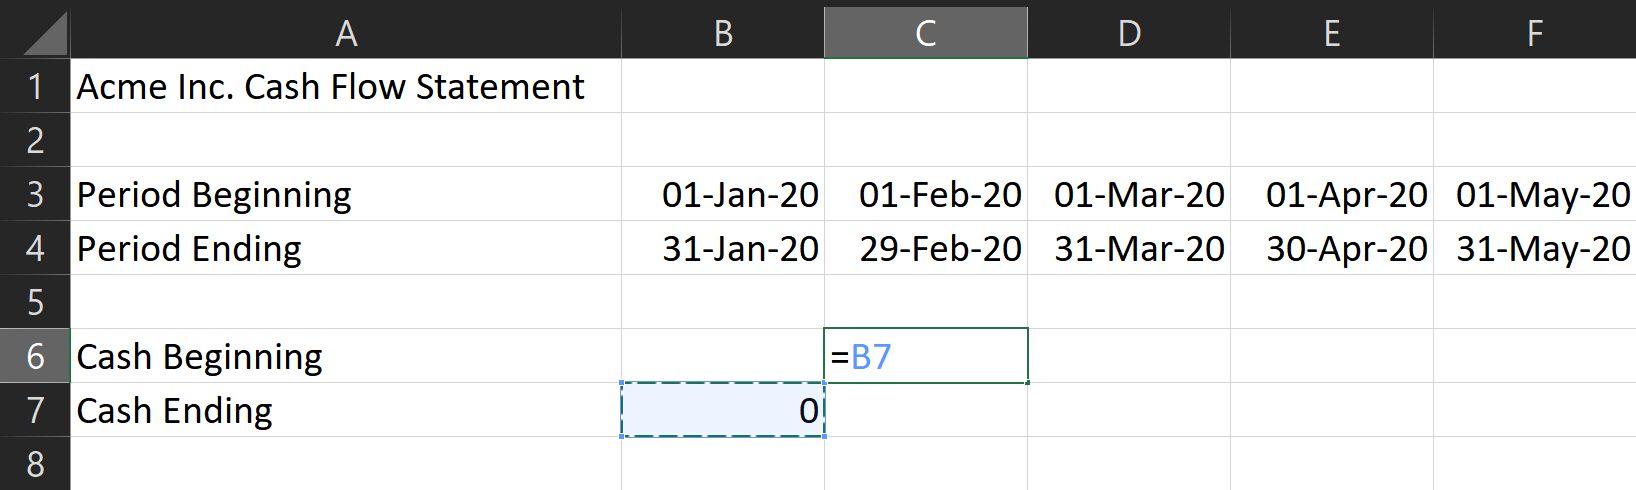
7. Setting Multiple Months
If you want to compare your cash flow over multiple months, you need to set this formula first. Under Beginning Cash for the next month, write «=» then click on the corresponding cell for Ending Cash of the last month. This automatically copies the Ending Cash for the previous month to the Beginning Cash of the following month.
As for the rest of the formulas, all you need is to copy them across the rest of the months you want to cover.
- Hold the shift key to select all the cells from Cash Ending all the way to Net Cash Flow.
- Once done, type ctrl + c to copy them.
- Then, click on the corresponding cell for Cash Ending for the following month and type ctrl + v.
- Excel will automatically adjust these formulas to reflect the correct corresponding column.
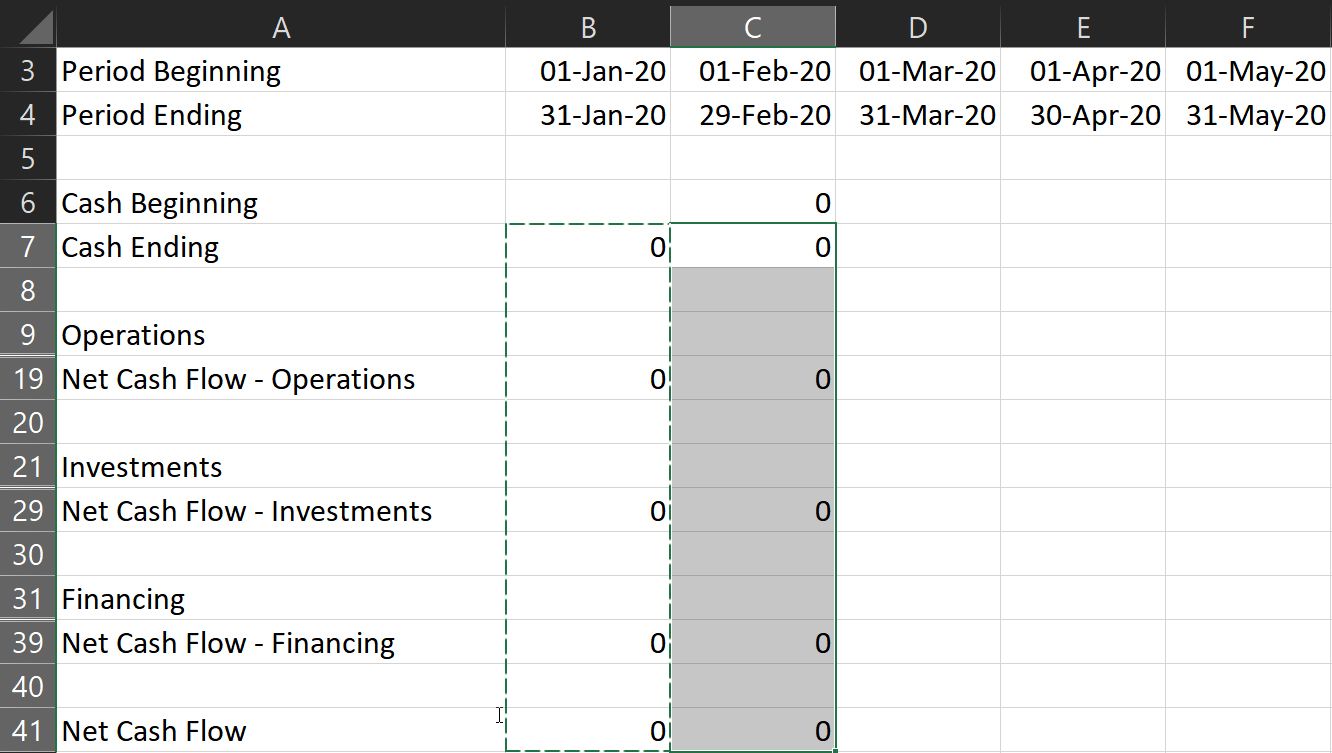
Note: make sure there are no other values in the cells you selected except the formulas.
8. Formatting Your Rows and Numbers
Format your entries, so negative numbers appear red. This lets you analyze your statement much easier.
- To do that, select all numerical entries, then click on the dropdown menu in the Number section.
- You can find them at the Home ribbon.
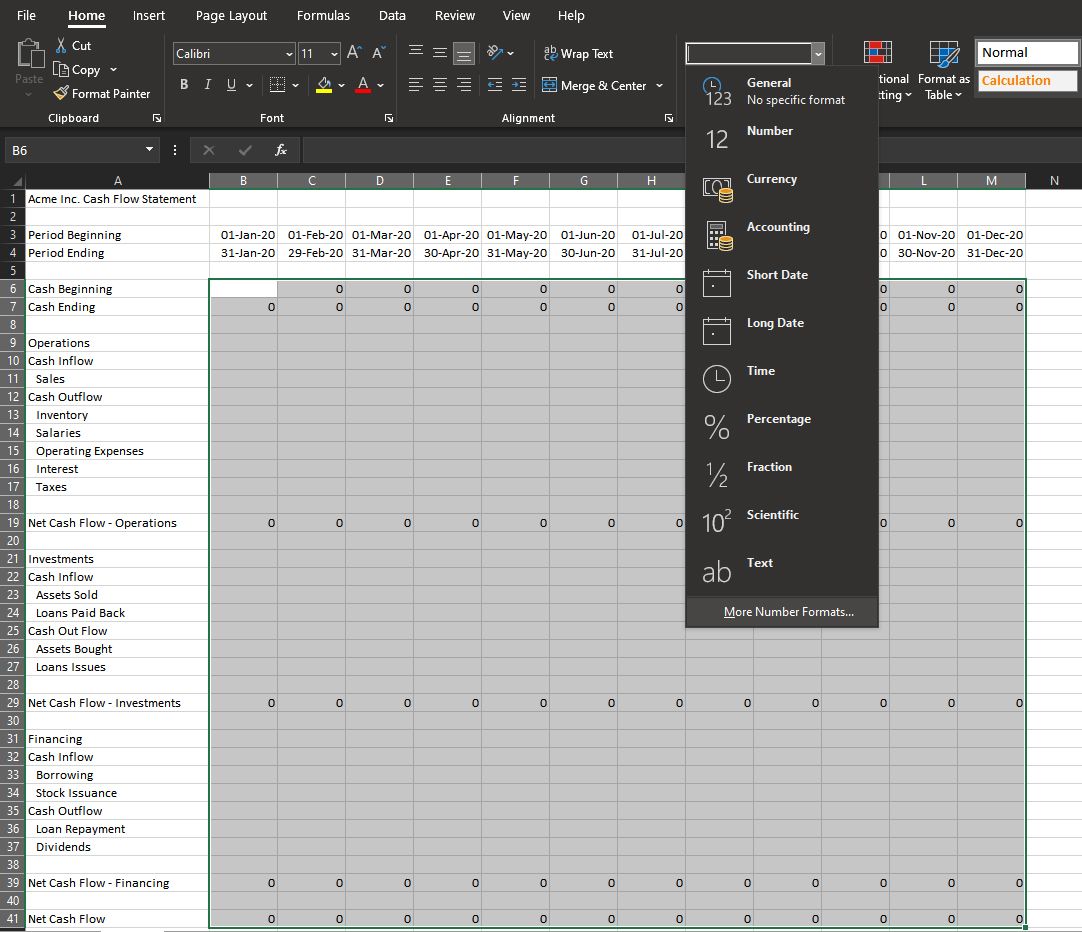
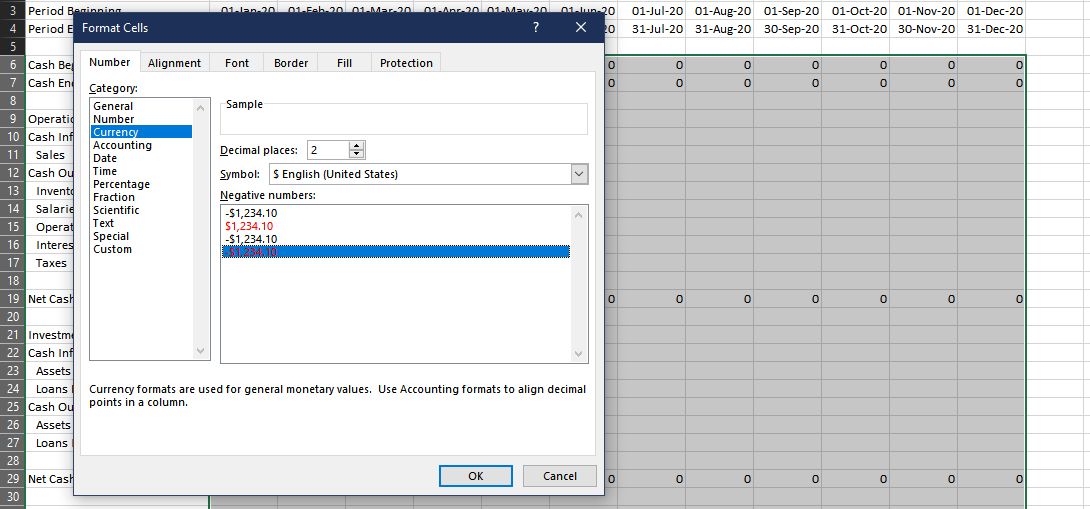
3. Click More number formats… A new window called Format Cells will open.
4. Under the Number tab, go to the Category menu, then choose Currency.
5. Choose the correct Symbol in the dropdown menu.
6. Then, under the Negative numbers: subwindow, select the -$1234.10 with a red font color option.
This should let you see your expenses in red, making it easier to differentiate inflow from the outflow.
You can also select each category and subtotal row and fill them with different colors. This will make it easier to differentiate between sections at a glance.
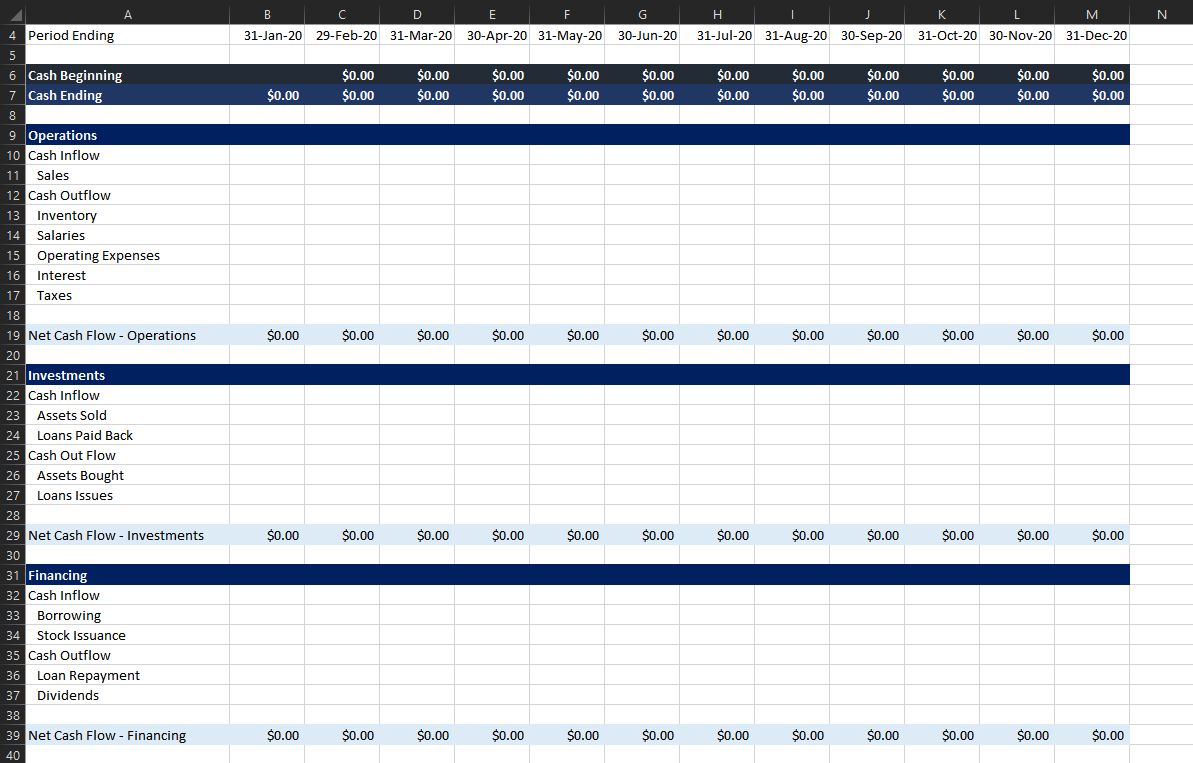
9. Input Your Values
After you’ve prepared everything, all that’s left is to input the actual values. Don’t forget to add a negative sign on expenses! Once done, you now have a completed cash flow statement.
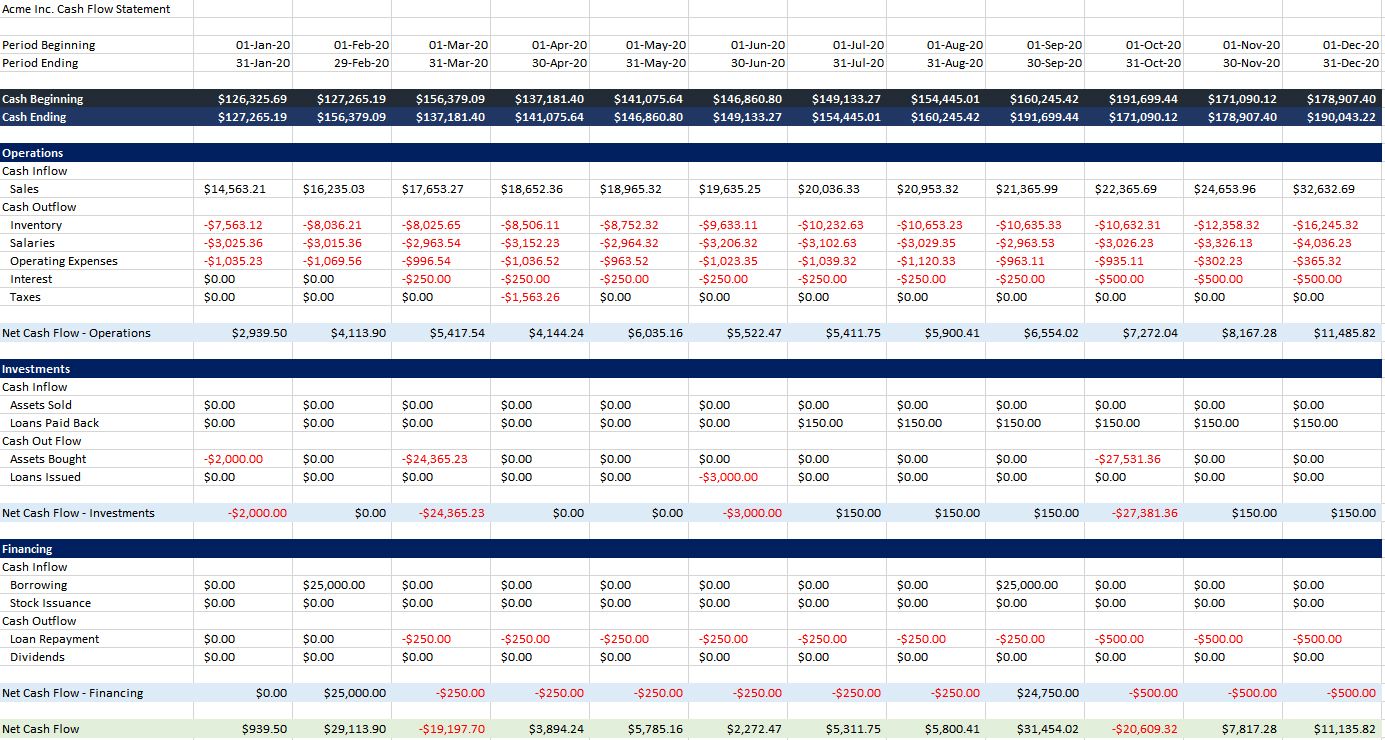
You can access and save a copy of this cash flow statement here.
Plan Your Next Move
Now that you’ve completed your cash flow statement, you have a better view of your business’s liquidity. It can help you plan your next moves, allowing you to make wise decisions.
With a cash flow statement, you have the first document you need to see your overall business performance. Pair that with an income statement and a balance sheet, then you’ll know exactly where you stand.
Cash Flow Statement is a ready-to-use template in Excel, Google Sheet, and OpenOffice to prepare a detailed cash flow of the company for a specific period.
Moreover, this template provides the cash flow from operating, investing, and financing activities.
What Is A Cash Flow Statement?
Cash Flow Statement is a financial statement that reports the cash generated and spent during a period. It is one of the main financial statements.
In other words, this statement allows you to understand how your company operations run. It gives you an overview of where the money is coming from, and how it is spent.
You can decide the period for this statement. It can be either monthly, quarterly, half-yearly, or yearly. It can be more in some cases as per the requirement.
Reviewing this helps companies in taking crucial and big economic decisions.
Components Of A Cash Flow Statement
A Cash flow statement consists of the company’s inflow and outflow of cash. It covers 3 categories of activities: Operations, Investing, and Financial.
Operating Activities
Operating activities are the main sources of cash inflow and outflow. It depicts the cash earned and spent on regular business activities. It includes activities such as sales receipts, merchandise purchases, salaries, and other operating expenses.
Investing Activities
Cash flow from investing activities includes inflow and outflow of cash in investing activities. It can include assets, equipment, acquisitions, and equity. Usually, they are the long-term assets of the company’s balance sheet.
Financial Activities
The Financial activities of the cash flow statement display the inflow and outflow of cash from financing activities. These involve repayment of loans, stock issuance and dividends, equity buy-back programs. Usually, these items are the long term liabilities on a company’s Balance Sheet.
Methods Of Cash Flows
There are two types of cash flows: Direct and Indirect.
Direct Cash Flow Method
The direct cash flow method involves adding up all the cash receipts and payments of a business. These include payments to suppliers, receipts from customers, and salaries paid to employees. In this method, the opening and closing balance of various accounting heads.
Indirect Cash Flow Method
In the Indirect cash flow method, cash flow from operating activities is derived. You can find this as Net income on your income statement.
Usually, the net income on the income statement is prepared on an accrual basis. Hence, one needs to make adjustments to find the EBIT (earnings before interest and taxes).
Moreover, you need to make adjustments entries. This involves adding back the non-operating expenses that do not affect the cash flow.
We have created a simple and easy to use Cash Flow Statement with predefined formulas. Just enter the required data and get an overview of your company’s cash flows.
Excel Google Sheets Open Office Calc
Click here to Download All Financial Statement Excel Templates for ₹299.
Note: To edit and customize the Google Sheet, save the file on your Google Drive by using the “Make a Copy” option from the File menu.
Additionally, you can also download other Financial templates from our websites like Bank Reconciliation Statement and Trial Balance, Balance Sheet, etc.
Let’s discuss the Cash Flow Statement in detail.
Contents of Cash Flow Statement
This statement consists of two sections: Heading Section and Data Input Section.
Header Section
The header section contains the details like Name of the Company, Heading “Cash Flow Statement”.
The second row contains the preparation date along with the Opening Balance of cash.
Data Input Section
This section includes cash flow from mainly 3 type activities which are as follows: Operating activities, investing activities, and financial activities.
Operating activities are the principal revenue-producing activities of our company.
You can calculate Net Cash Flow from Operating deducting Operating expenses from operating incomes.
Operating expenses are salaries, income tax, etc. Incomes include cash received from customers and other sources.
Investing activities are the acquisition and disposal of long-term assets. It also includes other investments that are not cash equivalents.
Similar to Operating activities, you can calculate Net Cash Flow from Investment by deducting Investment expenses from incomes.
Investment expenses like the purchase of property, Loans, etc. Incomes like cash received from property sold, principal amounts of loan, etc are considered.
Financing activities are activities that result in changes in the size and composition of the owner’s capital. The owner’s capital includes preference share capital and borrowings.
Net Cash Flow from Financial is calculated by deducting financial expenses from financial Income.
These expenses include the repurchase of treasury stock, repayments, etc. Incomes include cash received against share issuance and borrowings done by the company.
In the end, the Closing Balance of Cash is given.
Benefits of Cash Flow Forecasts
- Cash Flow Statements can bee used to predict the future cash flow of companies. This statement reflects the financial health of a company.
- A cash flow statement tells you if you’re running out of money even when you’re profitable. You can also see how your bank loan payments are affecting your cash. Thus, it very important for a company to prepare and review Cash Flow Statements.
- Cash Flow Statements help to the actual cash position which cannot be derived from the P&L statement. Thus, being aware of the cash liquidity, you can arrange for any cash shortfalls. Or you can use the excess cash for growth purposes.
- Furthermore, it enables the management to plan and control the financial operations properly. You can measure the profitability and financial position by doing cash flow analysis along with ratio analysis. Moreover, it is a great tool for internal financial management.
Limitations of Cash Flow Forecasts
- The cash flow cannot project the profits as it shows only the cash position of a company.
- Moreover, for any cash flow projections, we need to use the Balance Sheet as well as the P&L statement.
- The cash flow statement displays actual cash activities. Hence, it cannot be used as a substitute for the P&L account.
- By making some adjustments in purchases and other payments, the cash position can be manipulated. Thus, sometimes the cash flow statement doesn’t display the real liquidity position.
How To Analyze A Cash Flow Statement?
Operating cash flows are the heart of the cash flow statement. Thus, companies having high Operating cash flows consistently are healthy and self-sustaining.
Usually, negative investing cash flows indicate the expansion of business or replacement of old assets. Thus, it is necessary to find out whether investments can generate revenue growth in the future or not.
Often, companies having negative cash from Investing activities will have positive Financing cash flows.
Generally, it is because companies raise additional debt or equity capital to support their investments.
However, a company’s cash inflows from core operations must be enough to fund its investments. It should also cover lenders and shareholder’s obligations. Therefore, in the long run, investing and financing outflows must be almost equal to Operating cash flows.
Often we can see that some companies having low or negative cash flows from operating and a positive from Investing. In such a scenario, it means that a company funds its operations by liquidating its assets.
Such cash flows can be a wake-up call for a company. From an investor’s point of view, such a company can even be on the verge of bankruptcy.
There can be scenarios where companies need to sell their assets to maintain dividend levels. It is done to handle its investor. Because dividend cuts are a sign of poor financial health.
Thus, while selling the assets, it should be kept in mind that they aren’t core business. Moreover, they must also not be an unnecessary financial burden to the company. As an investor, you must look deep into the company if they are selling key assets.
Positive cash flows from Financing activities and a low or negative cash flows from operating activities indicates improper usage of its capital. Hence, it shows operational inefficiency and improper management of a company.
Tips To Improve Cash Flow
- To improve your cash flows, you can make adjustments to your staffing to decrease payroll expenses.
- In addition to the above, avoid unnecessary purchase of inventory.
- Furthermore, manage Accounts Payable efficiently. Make payments neither too early nor not too late.
- Create some offers to acquire more new customers and to increase sales fro the existing customers.
- Additionally, keep your accounts receivable stringent. Reach out to late-payers for speedy payments.
- Moreover, depending on market demand decreasing or increases prices can help you increase cash flows.
- Finally, if business operations suffice for managing proper cash flow, find a source of short-term working capital.
We thank our readers for following us on different social media accounts.
If you have any queries or questions, share them in the comments below. We will be more than happy to help you.
Frequently Asked Questions
Is cash flow the same as profit?
The key difference between cash flow and profit is that profit means the money left over after paying all the expenses have been paid. Whereas, the cash flow means the inflow and outflow of a business.
How do you know if a cash flow statement is correct?
To verify the accuracy of your Cash Flow Statement:
Matching the change in cash on your Cash Flow Statement with the change in cash on your balance sheets. Find the Net Increase or Net Decrease in Cash at the bottom of your Cash flow statements.
What is the formula for net cash flow?
Net Cash Flow = Total Cash Inflows – Total Cash Outflows.
What is the difference between cash flow and fund flow?
The cash flow records the inflow and outflow of actual cash and cash equivalents. Whereas, the fund flow records the categorized movement of cash in and out of the business.
EduPristine>Blog>Cash Flow Statement: Learn to create Cash Flow Statement Template in Excel
What is a Cash Flow Statement?
In financial accounting, a Cash Flow Statement, also known as Statement of Cash Flow, is a financial statement that shows how changes in balance sheet accounts and income affect cash and cash equivalents, and breaks the analysis down to operating, investing, and financing activities. Essentially, the cash flow statement is concerned with the flow of cash in and out of the business. The statement captures both the current operating results and the accompanying changes in the balance sheet. As an analytical tool, the statement of cash flows is useful in determining the short-term viability of a company, particularly its ability to pay bills. International Accounting Standard 7 (IAS 7), is the International Accounting Standard that deals with cash flow statements.
People and groups concerned with cash flow statements include:
-
Accounting personnel, who need to know whether the organization will be able to cover payroll and other immediate expenses
-
Potential lenders or creditors, who want a clear picture of a company’s ability to repay
-
Potential investors, who need to judge whether the company is financially sound
-
Potential employees or contractors, who need to know whether the company will be able to afford compensation
-
Shareholders of the business.
If you have done financial modelling, you will know that making right cash flow statement is one of the critical tasks in the process of valuation of the company. Making an exact cash flow statement with all line items as per annual report of the company is an excellent idea but it requires a lot of accounting information of the company and as an Analyst, you always lack the information required to make a detailed cash flow statement.
As an Analyst you only need to have the balancing figure of “Cash and Cash equivalents” to tally the balance sheet and to compute the required figure. One need not make detailed cash flow account as per annual report of the company. You can easily figure out the required Cash and Cash equivalents amount using following equation:
Cash and Cash Equivalents = Total Liabilities + Shareholder’s equity “Total Assets (Except Cash and Cash Equivalents)
Today we’ll learn how to create Cash Flow Statement Template for a Real life Company – ‘LinkedIn’Â.
Let’s get started!
Task 1 in Creating Cash Flow Template: Getting Relevant Data for the Company
-
The numbers we need for creating the Cash Flow Statement of LinkedIn can be found in any of its annual reports or filings. There are many sources on the Internet such as the SEC website, the company website etc. where you can find these reports.
 Source: LinkedIn
-
Download both the PDF file and the Excel file by clicking the links as indicated in the above image
-
After downloading Excel file clean the data for P&L account and Balance sheet and make it in a presentable format as below.


Task 2 in Creating Cash Flow Template: Classifying Balance Sheet Items
-
Classify each item on the balance sheet under Operating activity, Investing Activity or Financing Activity depending upon how they impact business

Task 3 in Creating Cash Flow Template: Developing the template in Excel
-
Type in the balance sheet items as you’ve classified them. Remember that the first item under Operating Activities is the Net Income.
-
Just above the parameters, mention the currency and unit of the values you’ll enter into the Balance Sheet. Enter the first year of projection in the next column. In our case, we start from 2010 and extend till 2012

-
Thereafter you can change the format of Years
-
To do so, select the Fiscal Years and Press ‘Ctrl+1’ and change the format to ‘FY 0’

-
Format the title row as shown below. Ensure that you mention the ‘year ending’ above the years
-
The Net Income values must be linked from the Income Statement

-
Increase in Assets leads to a decrease in cash, hence we take Value in 2011 “Value of 2012 as the cash outflow for 2012
-
Using similar method calculate the cash outflow for all the operating items under Assets

-
Increase in Liabilities leads to an increase in cash, hence we take Value of 2011 as the cash inflow for 2012
-
Using similar method, calculate the cash outflow for all the operating items under Liabilities

-
Using a similar concept as illustrated, we can calculate the cash inflows due to Investing and Financing Activities.

Task 4 in Creating Cash Flow Template: Calculating Cash Balance
Calculating Total Cash Flow from Operating activities.

Calculating Total Cash Flow from Investing activities

Calculating Total Cash Flow from Financing

Calculating Change in Cash
Sum of Cash flow from Operating, Investing and Financing gives us overall change in Cash balance for that year.

Calculating Final Cash Balance
-
Note that Cash at beginning of current year = Cash at ending of previous year

Classify each item on the balance sheet under Operating activity, Investing Activity or Financing Activity depending upon how they impact business

-
Type in the balance sheet items as you’ve classified them. Remember that the first item under Operating Activities is the Net Income.

Just above the parameters, mention the currency and unit of the values you’ll enter into the Balance Sheet. Enter the first year of projection in the next column. In our case, we start from 2010 and extend till 2012

Thereafter you can change the format of Years
To do so, select the Fiscal Years and Press ‘Ctrl+1’ and change the format to ‘FY 0’

Format the title row as shown below. Ensure that you mention the ‘year ending’ above the years

The Net Income values must be linked from the Income Statement

Increase in Assets leads to a decrease in cash, hence we take Value in 2011 “Value of 2012 as the cash outflow for 2012
Using similar method calculate the cash outflow for all the operating items under Assets

Increase in Liabilities leads to an increase in cash, hence we take Value of 2011 as the cash inflow for 2012
Using similar method, calculate the cash outflow for all the operating items under Liabilities

Using a similar concept as illustrated, we can calculate the cash inflows due to Investing and Financing Activities.


Sum of Cash flow from Operating, Investing and Financing gives us overall change in Cash balance for that year.

Note that Cash at beginning of current year = Cash at ending of previous year

Final Cash Flow Statement

This is our final Cash Flow Statement. Note that we haven’t shown the Cash Flow for 2010. This is because our balance sheet does not have 2009 data. It is a simple matter of extending the formulas otherwise.
In case you’re interested in learning in depth about how to create Cash Flow Statement template and complex financial models for companies, you can join our Financial Modeling course.
Apart from helping companies track the inflow and outflow of cash, the Cash Flow statements can also be used by investors and creditors. Investors can estimate the future cash flows of the company through the Cash Flow statement which helps them in making investment decisions. It also helps them analyze operating, investing, and financial activities in an organization. Cash Flow statement provides an insight into the liquidity status and solvency of a company and the cash-generating ability of the company. Cash Flow statement also helps the debtors and creditors determine the repayment capacity and capability of the company.
If you want to specialize in Accountancy, here are the best professional courses you should opt for:
- US CMA – Certified Management Accountant – US CMA course covers Management Accounting as the major domain in accounting. For details on the US CMA course like US CMA course eligibility, US CMA course scope, US CMA course duration, contact our counsellors.
- ACCA – Chartered Certified Accountants – The ACCA course is a great combination of general accounting and management accounting. For details on the ACCA course like ACCA course eligibility, ACCA course scope, ACCA course duration, contact our counsellors.
- US CPA – Certified Public Accountant – The CPA course is the most extensive course in accounting and offers lucrative job opportunities in the accounting segment. To know more about the US CPA eligibility, US CPA duration, US CPA fees, contact our counsellors.
Cash Flow Statement in Detail
How to understand and interpret Cash Flow statement
If you have any doubts or queries, feel free to post them below
Отчет Cash Flow позволяет спрогнозировать финансовые показатели в будущем и предотвратить кассовые разрывы. Поэтому он очень важен и так популярен. Но среди стандартных диаграмм Excel нет подходящих инструментов для визуализации данных по отчету Cash Flow. Вашему вниманию предлагается необычный пример создания комбинированной диаграммы для визуального анализа циркуляции денежного потока на предприятии.
Комбинированная диаграмма для визуального анализа Cash Flow в Excel
Так как в арсенале стандартных диаграмм Excel нет подходящего инструмента для анализа отчета по Cash Flow, будем комбинировать свой график из уже имеющихся средств. В данном примере используется комбинация из трех отдельных диаграмм:
- Пузырьковой (Bubble).
- Круговой (Pie)
- Комбинированной из двух Кольцевых (Doughnut).
Подробное описание предназначения и стратегии использования по каждому пункту:
- Пузырьковая диаграмма – предназначена для визуального сравнения величины более двух значений.
- Круговая – отображает отношение нескольких частей к целому общему значению. В этике дизайнеров и разработчиков визуальных отчетов не рекомендуется использовать круговую диаграмму для сравнения более чем 2 значения. Но в нашей творческой комбинации ее мы будем использовать для отображения экспонированного значения перевыполнения финансового плана больше 100% на одной и той же диаграмме. Хотя по сути все сохраняется в рамках этики дизайна визуализации, так как используется 2 значения: 1– процент доли перевыполнения плана по отношению к 2 – общего целого значения 100%.
- Кольцевая – так же, как и круговая предназначена для отображения нескольких долей по отношению к целому общему значению. Но в отличии от круговой диаграммы может содержать несколько рядов данных. Это отличие нам сильно пригодится в разработке дизайна визуализации данных для интерактивной презентации.
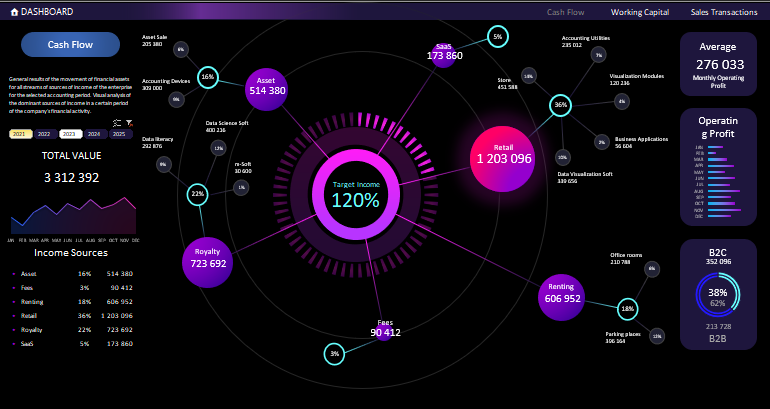
Одно из важнейших предназначений отчета по Cash Flow – это предотвращение кассовых разрывов. Поэтому наш комбинированный график будет содержат в центре большую комбинированную диаграмму, информирующую о проценте выполнения плана продаж. Чем выше этот показатель, тем меньше вероятность кассового разрыва. Схема как будет выглядеть будущий дизайн визуализации:

Техническое задание для разработчика определено, показано и описано. Теперь можно переходить к процессу реализации задачи.
Сборка комбинированной диаграммы в Excel пошагово
Разберем данный пример в стиле пошаговой инструкции:
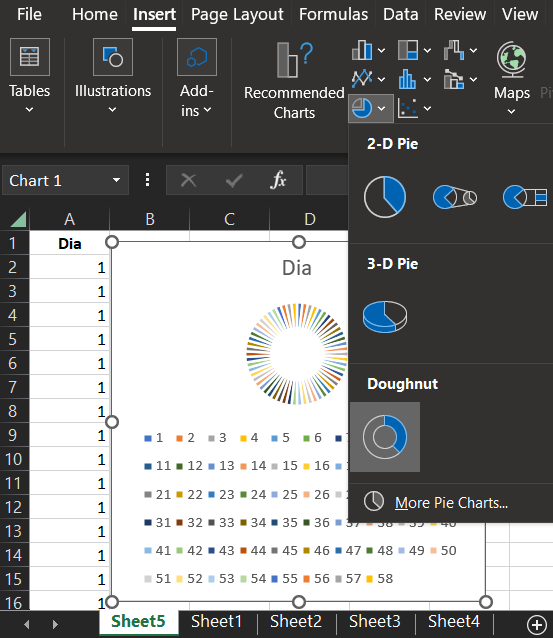
- Создадим кольцевую шкалу из 58-ми делений:
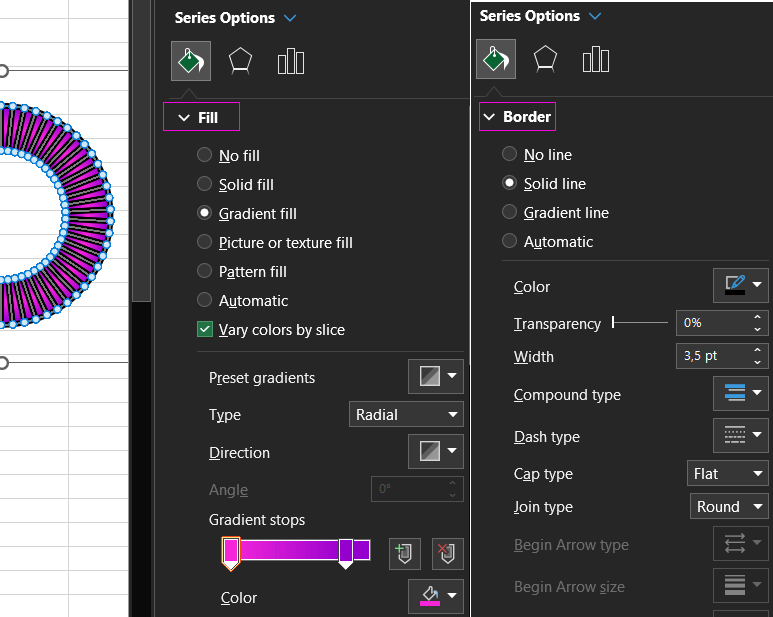
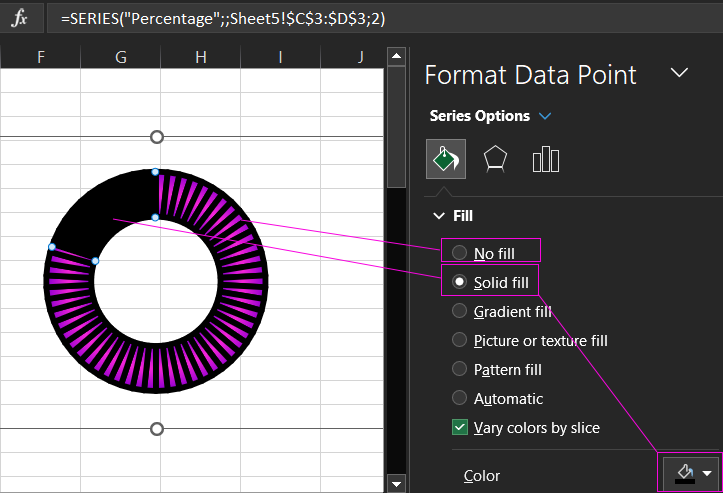
- Проектируем дизайн для делений на кольцевой шкале:
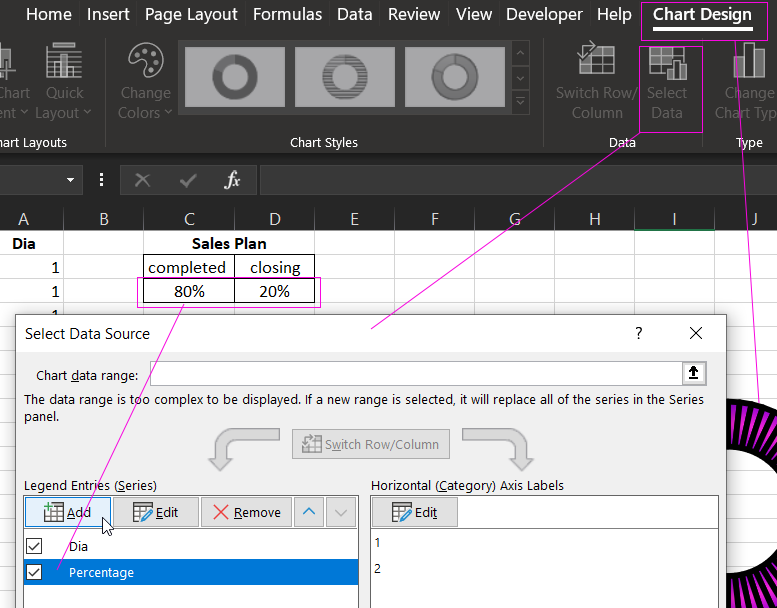
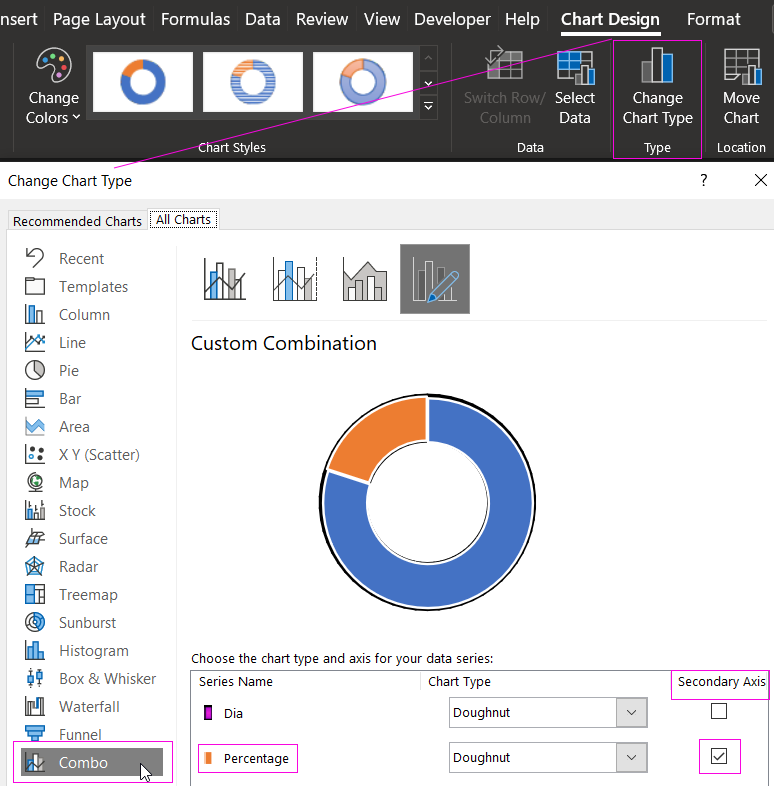
- Добавляем новую серию значений для комбинирования диаграммы:
- Настраиваем комбинацию в окне изменения типа. Обратите внимание на то, что нужно указать для второй серии значений расположение по вспомогательной оси координат. Таким образом две кольцевые диаграммы будут наложены как на разных слоях:
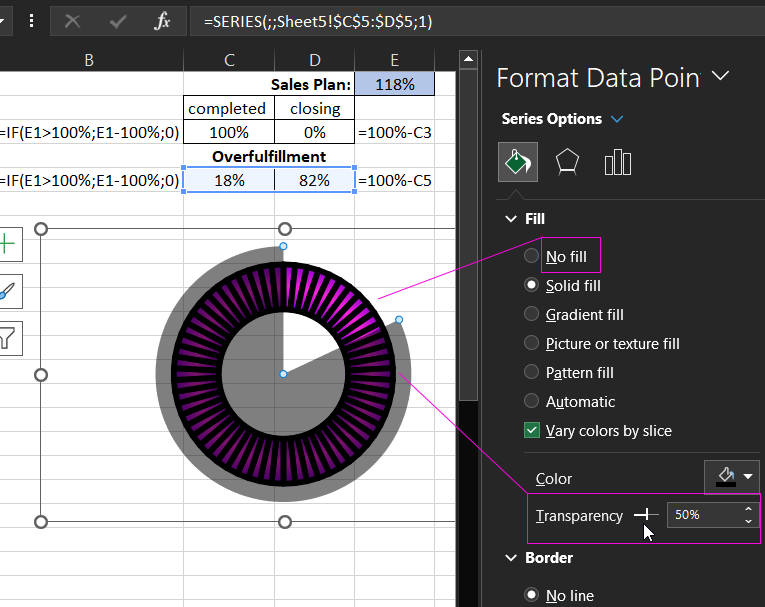
- Изменяем дизайн для второй кольцевой диаграммы, дополнительно наложенной сверху с помощью комбинирования типов в Excel. Синею заливку изменяем на прозрачную, а оранжевую на черную. И не забудем убрать контуры. Комбинированная диаграмма из двух кольцевых – готова:
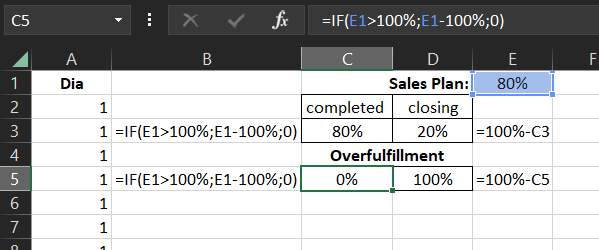
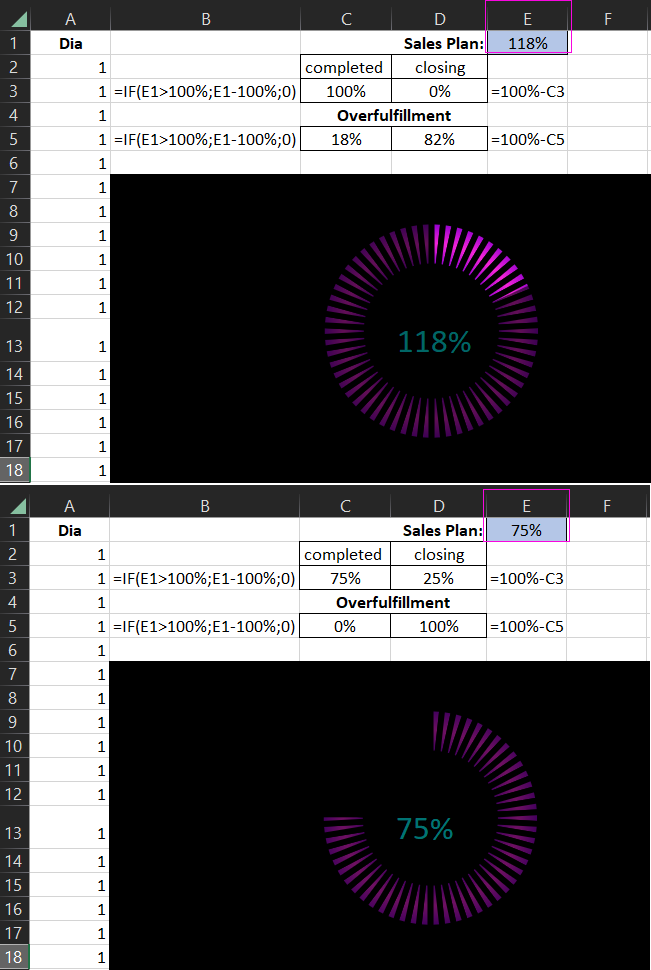
- Изменяем значения на формулы в таблице показателей выполнения плана продаж. А также создаем еще одну табличку с формулами для исходных значений круговой диаграммы:
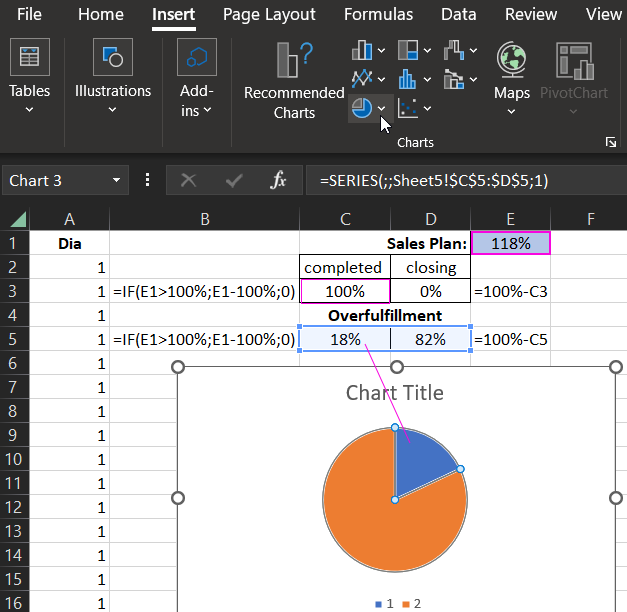
- На основе второй таблички создаем круговую диаграмму, которая будет экспонировать на шкале долю соответственной значениям при превышении выполнения плана продаж:
- Изменяем цвета заливок круговой диаграммы и накладываем ее на комбинированную состоящую из двух кольцевых. Незабываем подровнять размеры. Синий цвет меняем на прозрачный, а оранжевый делаем черной, но полупрозрачной заливкой и удаляем все контуры:
- Тестируем и наслаждаемся готовым результатом на черном фоне и проверяем как все работает при изменении исходного значения в ячейке E1:
- Добавляем пузырьковый график как последнюю комбинацию в общей композиции презентации отчета по циркуляции движения денежных средств:
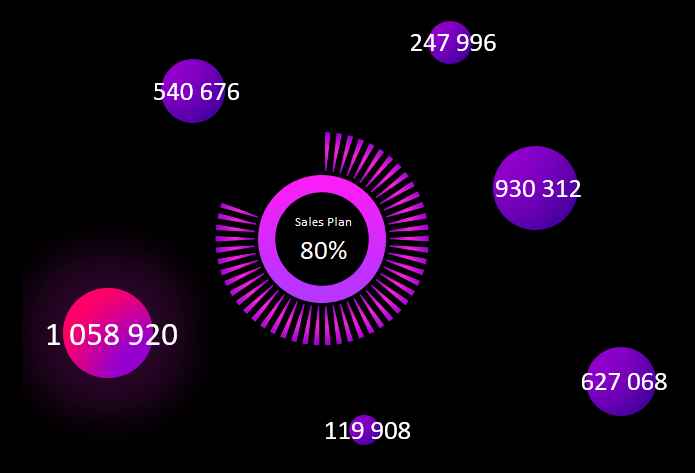
Дальше все красиво и талантливо оформляем для создания профессиональной инфографики с интерактивными возможностями. Все зависит от вашего воображение, а оно зависит от вдохновения:
 Скачать анализ Cash Flow в комбинированной диаграмме Excel
В широком ассортименте инструментов для визуализации данных в Excel есть все и даже больше, чем кажется на первый взгляд. Необходимо лишь немного опыта, а воображение придет с творческим вдохновением. Смело скачивайте данный шаблон и вдохновляйтесь, изменяйте под свои потребности и улучшайте. Нет предела совершенству, не существует границ между душой и творчеством.