
Disclaimer: Excel is a fantastic tool and we use it for many different things. Everyone has access to company sheets, Excel can be linked to various external systems and become an integral part of the Office environment. The program is easy to operate.
Still, Excel in 2019 has been overtaken by low-code platforms: the safer, more sustainable and more advanced big brother. Low-code platforms can do everything Excel can do, but better. We list some of the benefits for you.
Compliant to GDPR
Low-code platforms are safer. More watertight, especially if you look at them from a privacy legislation perspective. We can illustrate this nicely on the basis of the following case. Suppose you document purchase and sales orders including the address and contact details of your customers. If you do this in an Excel sheet, everyone can work with it. That’s a big plus.
It also means that every individual within your organization is automatically authorized to do so. You can set a password, but once this is on the street, the same applies to all personal information you work with. Low-code platforms offer the possibility to provide role-based access to the data, documents, and workflows. Security risks are limited and the control ensures that access rights are only granted to employees for whom certain data are relevant.
One truth
Secondly, low-code platforms overcome human errors and increase the user-friendliness of business documents. A platform is centrally stored in the cloud, anyone authorized to do so can access it from any desirable location and device. Once a user is logged in there is only one version to which they have access.
This is very different compared to Excel. Files can be stored in different locations, copied and pasted and it even happens that entire files are accidentally deleted. Version problems are often inevitable, however unintentional the mistakes of employees may be.
With a low-code platform, on the other hand, there is a single source of truth. Mistakes are never irrevocable, because everything is safe in the cloud. And because there is only one truth, you can trust your employees better and they have more confidence in their own actions.
Universal platform
Dependence on individual document managers is also a thing of the past with low-code platforms. When Excel is used, there is often one administrator who has created the sheet and knows all functionalities. As soon as this employee is unavailable, their knowledge will also be lost.
Consequence: months later, this former employee must still be called to ask how cells can be modified or how complex formulas in the sheet actually work. Users of low-code platforms do not have to be data experts. The platforms are a visual representation of the database around which they are built, and employees only have to fill in a form to ‘do it right’.
So do not be mistaken: process-based Excel sheets are often work processes that are crucial for your organization. So make sure that safety is guaranteed and that risks of loss or misuse of documents are kept to a minimum. Want to know more about the possibilities of a low-code platform to achieve this? Feel free to contact us.
Contents
- Tools, Calculators and Simulations
- Dashboards and Reports with Charts
- Automate Jobs with VBA macros
- Solver Add-in & Statistical Analysis
- Data Entry and Lists
- Games in Excel!
- Educational use with Interactive features
- Create Cheatsheets with Excel
- Diagrams, Mockups, Gantt Charts
- Fetch live data from web
- Excel as a Database
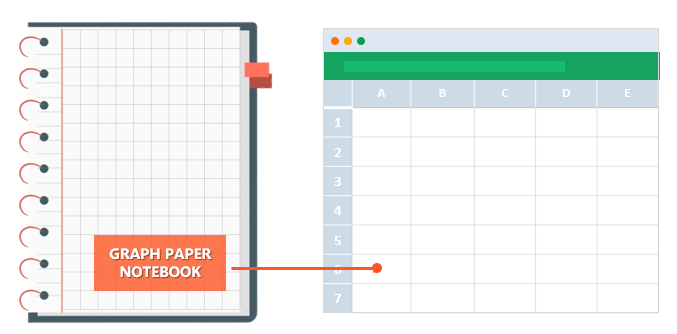
Excel is one of the most used software in today’s digital world. Most people quickly open up an Excel file when they need to write or calculate anything. It is like “paper”. (remember those graph notebooks from school times..)
Actually, this is not only specific to Microsoft’s Excel but most of the spreadsheet software like open office or google sheets. However, we will focus on Excel and what can you do with it today, as it offers huge flexibility you will discover below.
Let’s start with the main usage areas of Excel. As we all know, spreadsheets are designed to make calculations easier. So they contain “formulas”. They allow us to make basic math like summing, multiplying, finding average as well as advanced calculations like regression analysis, conversions, and so on.
When we combine these powerful math features with some tables, lists, or other UI elements, we can come up with a calculator. And most of the time they will be dynamic (meaning that when you change a parameter all the rest of the calculations will adapt accordingly)
Below see an example from our past studies as Someka:
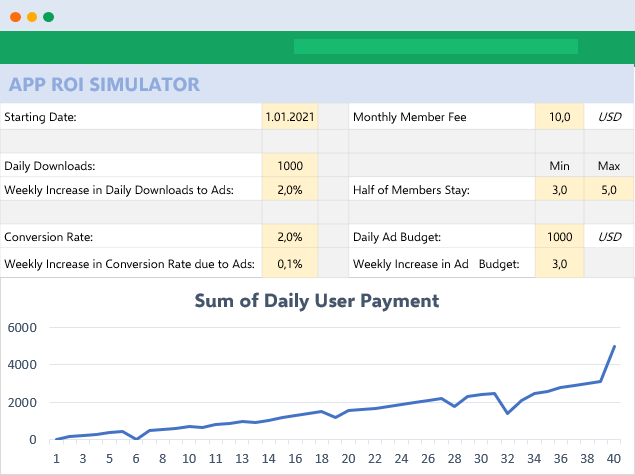
We have built this calculator for an app development company executive. He was changing the parameters he wants and sees the outcomes immediately.
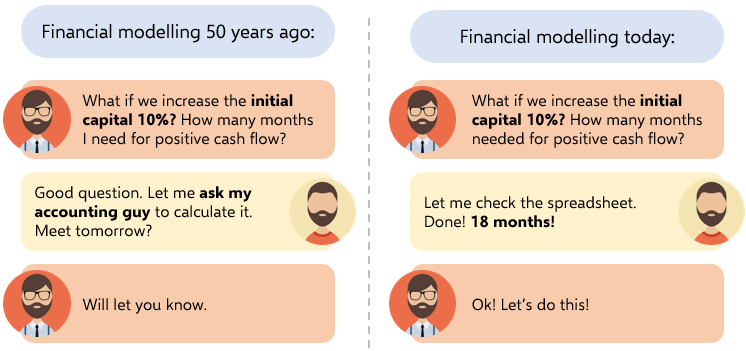
This is great especially when you try to make big “models” in excel. Financial Modeling is one of the most used application areas of these big models. If we tried to do this with pen-paper (which used to be the way once upon a time) it would be horrible I guess:
Financial modeling is also being used to test the excel skills of experts. They even make a competition for it: ModelOff
We also have a tool for startups to make a feasibility study playing with their own variables:
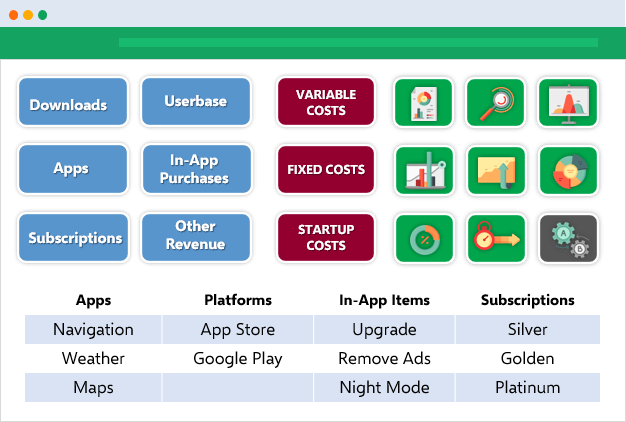
This is a comprehensive Feasibility Study Excel Template for app startups with download projections, costs, financial calculations, charts, dashboard, and more.
The business world is demanding. It is not enough just to make the calculations, set up your tables, and write the text. You have to create pie charts, trends, line graphs, and many more. Whether you are getting prepared for your pitch or make a presentation in your company, you can use Excel’s chart features.
Pivot Tables
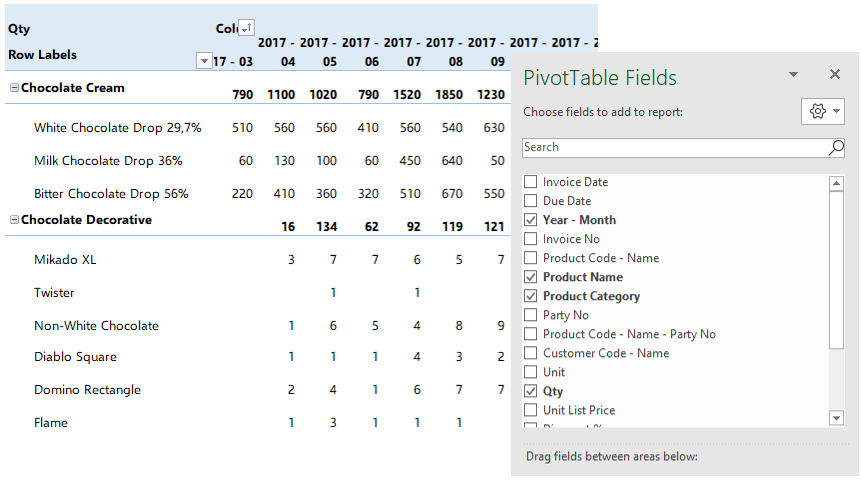
One of the greatest features which Excel offers is Pivot tables. This is an advanced Excel tool that helps you create dynamic summary reports from raw data very easily. After you create your table you can play with parameters easily with a drag and drop interface.
It looks like this:
Dashboards
Complex excel models do have lots of variables, calculations, and settings. And instead of managing all variables one by one on different sheets, different places it is a very good idea to put them together like a “control panel”.
You can think dashboards as cockpits of planes.
Recently dashboards became very popular. There are lots of training videos about how to build and design control panels for our excel models. Actually, they are not so different from the rest of the calculations.
But the main idea is: if there is something you may want to change, later on, don’t write it directly in the formula but bind it to a variable.
Let’s say you are building a sales report for your manager. He asks you to make the file changeable so that he can see the results in US dollars or Euros according to the situation. Instead of writing an Fx rate into the calculations, you should bind this to a cell that you can play with later on.
Like this:
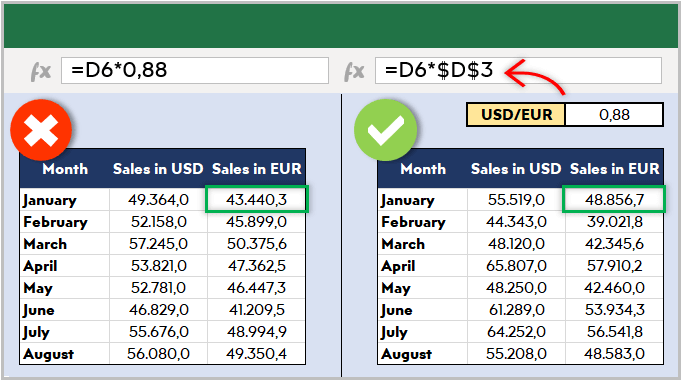
This may seem so obvious to some of you. But this is the basic approach of all dashboards in excel files. Of course, you can improve it with more complex formulas, buttons, cool charts, and even VBA but the main idea stands still.
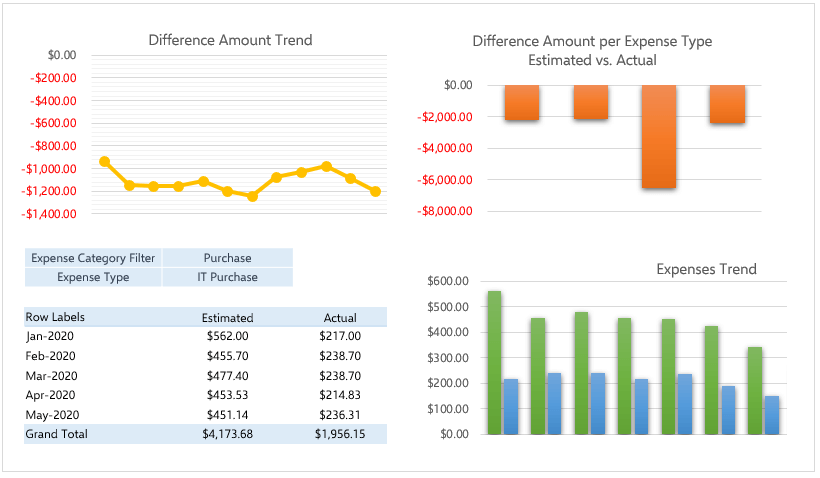
Here is an example of a complete set of the dashboard:
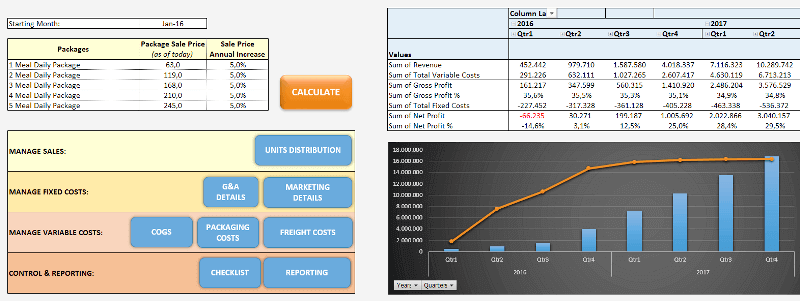
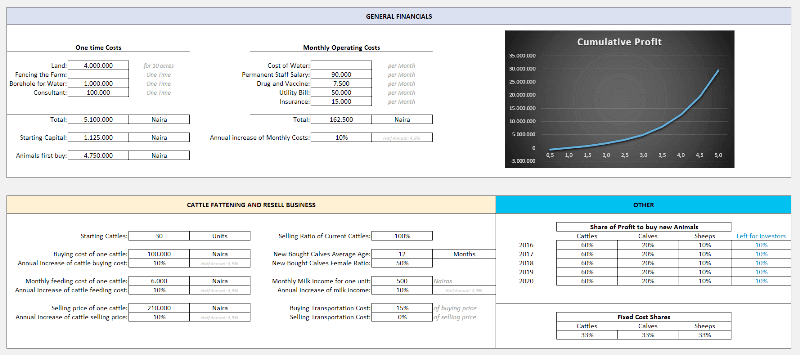
Or a dashboard for a livestock feasibility study:
If you are interested in Sales Dashboards, you may want to check out our Excel template:
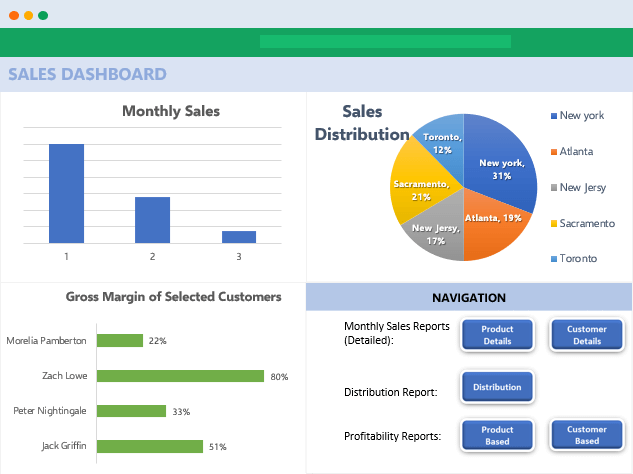
This is an interactive Sales Report Template in Excel. Features a dashboard with profitability, sales analysis and charts.
Other than that, Marketing ROI Calculator would be very helpful to prioritize your marketing campaigns in Excel:
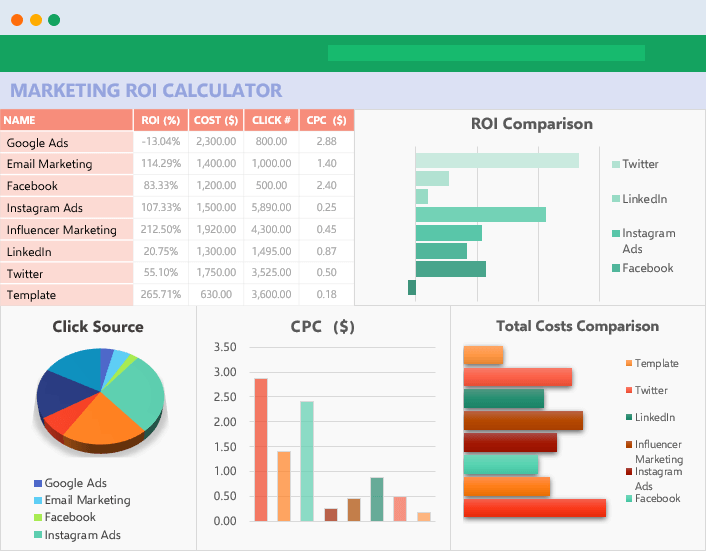
It will provide essential metrics and help you to manage all your marketing campaign channels in one place.
Most of the users who use Excel extensively are already coding. But if you ask them whether they know how to code most probably they will say no. Of course, writing formulas is a very small part of the things you can do with VBA. It is a strong programming language that lets you create small scripts (macros), user forms, user-defined functions, add-ins, and even games! (which we will touch below separately)
I will not dive into VBA here since it is a detailed area. But there are some basic things that will be beneficial to know for those who use Excel often:
- You can record macros for repeating jobs: You don’t need to code from scratch. Just click on the record macro button and it will write the code for you in the background. (If you want, you can modify later on)
- It extends the borders of Excel world. If you feel like you are limited somehow in Excel, you are more like an advanced user. It is time to get a little bit into VBA.
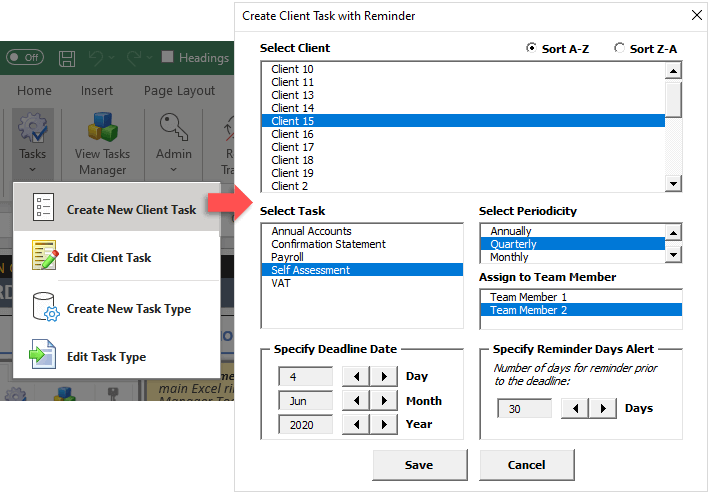
- You can create user forms with VBA only. If you see something like this, know that it is using VBA:
VBA is quite powerful and if you work with Excel extensively you won’t regret learning a bit. For example wouldn’t it be nice if you could send bulk emails from an Excel spreadsheat with a button click?
It is not surprising for spreadsheet software like Excel to offer advanced math techniques to make more complicated studies. (To be honest, I am not a statistics expert but with an engineering background, I will try to do my best to explain the basics. Feel free to correct me if I’m wrong)
Data analysis is a trending concept for recent years with the development of powerful computers and improved software. We are collecting and recording much much more data compared to the past. Take a look at this chart to understand what I mean:
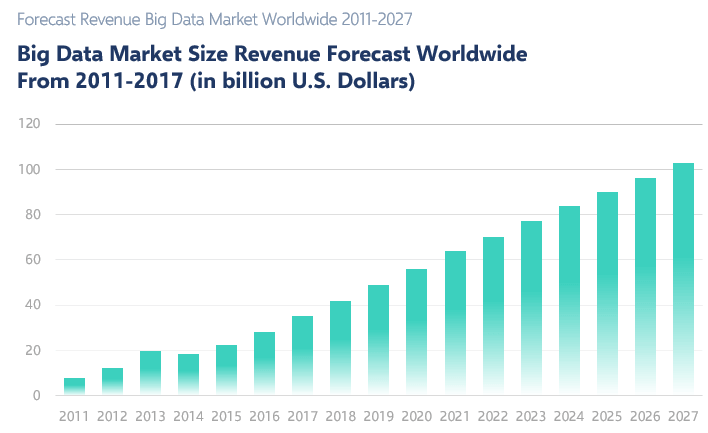
Especially this part:
“more data has been created in the past two years than in the entire previous history of the human race”
It is a bit frightening, isn’t it? Ok, we are not going to dive into the “Big Data” world. Let’s get back to our humble excel world.
As we collect this much data, some people will want to analyze it. Otherwise, it makes no sense to spend billions of dollars on those data centers. Excel has built-in functions for basic descriptive statistics methods like Mean, Median, Mode, Standard Deviation, Variance etc.
But if we want to go a bit further I will mention two Excel features (actually add-ins) at this step: Solver and Regression Analysis
Solver
Have you ever heard of “optimization”? When we have more than one parameters that affect the outcome, we can only have a most optimized solution rather than a maximum solution. This may sound weird but it is very valid in our daily lives.
One of the simplest and popular examples is: Farmer Fence Optimization Problem
“A farmer owns 500 meters of the fence and wants to enclose the largest possible rectangular area. How should he use his fence?”
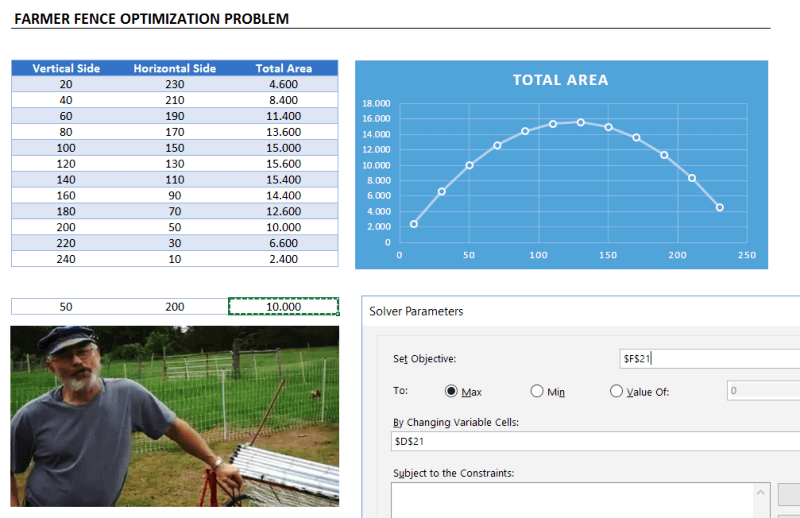
This is a very simple example to explain what a solver does. But actually, you can run much more complicated data sets with Solver.
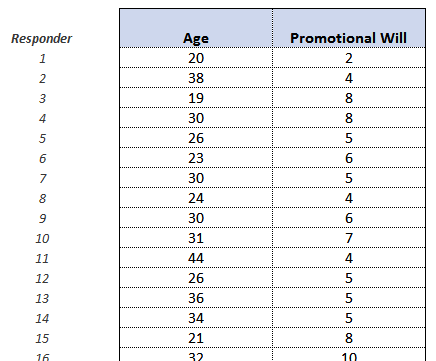
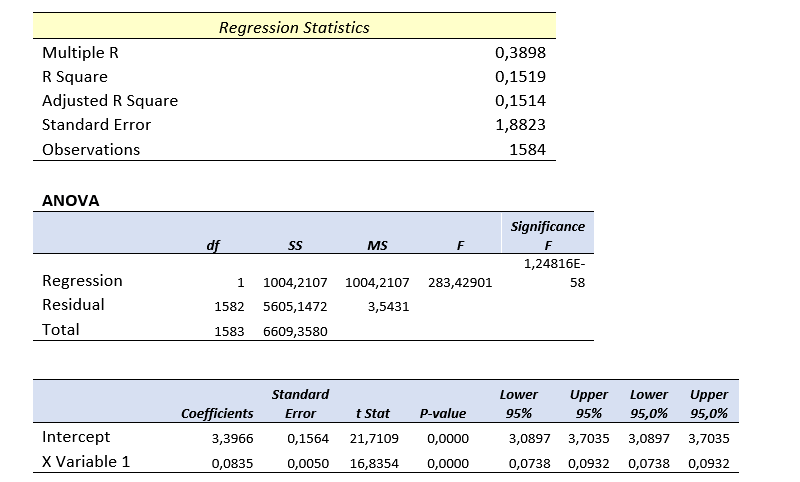
Regression Analysis
Since this is a bit advanced topic for this blog post, I will only touch the surface.
In most simple terms, regression analysis helps you find the correlation between the variables. For example, you may want to know what is the relation between the number of birds flown over your head and the money you earned today. (sorry for the silly example. No, I am not curious about it  You will need to gather sample data and put in an analysis to see if there is any correlation.
It seems something like this:
You put your data:
Run the regression from Analysis Toolpak:
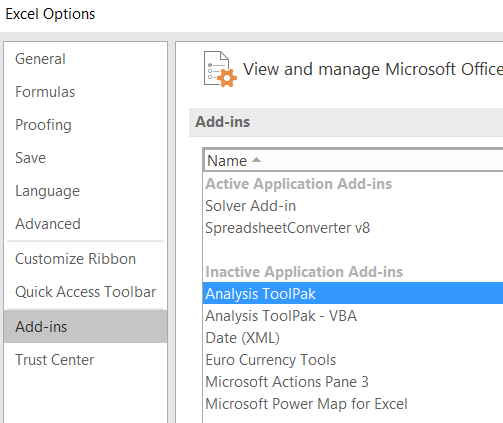
And get results something like this:
Of course, there is much more sophisticated software to run data analysis. However, there is a joke in business intelligence communities:
- What is the most used feature of any business intelligence solution?
- It is “Export to Excel”
Looks like we won’t stop using Excel anytime soon.
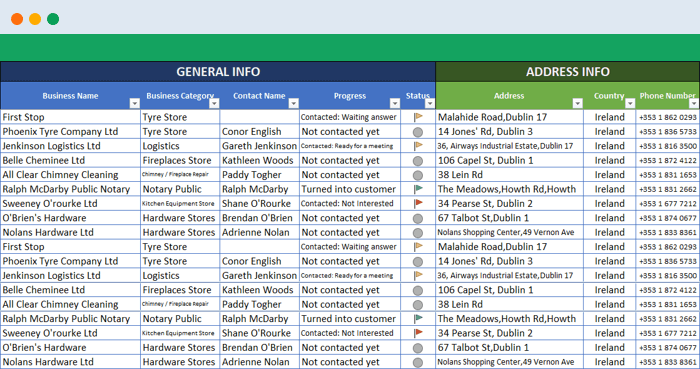
Coming back from boring data analysis world, let’s mention the simplest and most handy usage area of excel: Make Lists!
It is already self-explaining so I won’t bother with the details. When you want to list down some simple data, take notes, create to-do lists, or anything. Just open the excel and write it down. Did we mention that “paper alternative” thing? Oh yes, we did.
A lead list example:
You can also convert PDF files into Excel files in order to make it easier to work on. This can be done automatically with some software. But some pdf files cannot be processed automatically (like handwritten documents, scanned invoices, etc). You will need to do it manually.
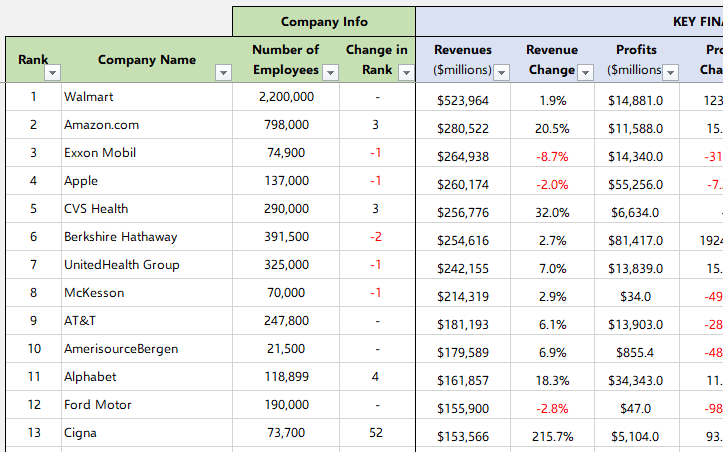
When you want to play with the data on a web page, you can easily copy-paste it into an excel file and then you can sort, filter or do anything you want:
For example, Fortune 500 US List:
Everybody loves to-do lists. And we have created useful to-do list in Excel for business or personal uses. Check it out, it is free:
To-Do List Excel Template
We already mentioned this in the VBA section above. But it is worth to talk a bit more.
Visual Basic allows you to code complex things like games as well. But of course, don’t expect a GTA or FIFA. Things like chess, sudoku, or Monopoly is OK. But, a few people have gone far and created more complicated things, like an RPG game. Take a look at this:
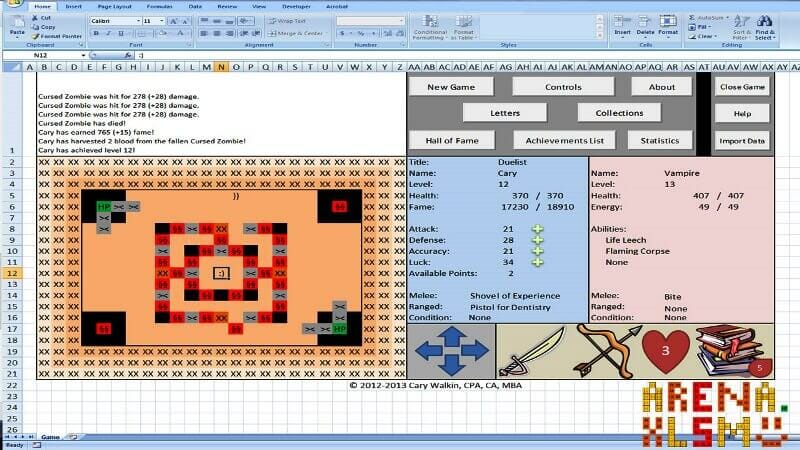
This game has been created by an accountant, Cary Walkin. I know it doesn’t look great but it is in Excel! (you can play it at the office  )
)
Another example:

A flight simulator in Excel?? Is it the same thing we use to sum up the sales figures? Lol yeah.
You can also embed flash games into Excel (like Super Mario, Angry Birds or whatever) But I count them off as they are not built with VBA.
As we mentioned in the Financial Modeling section, Excel is quite good for creating dynamic results according to the inputs. We get the benefit of this to create interactive tools.
One example that comes to my mind is this spreadsheet, guys from San Francisco have prepared:
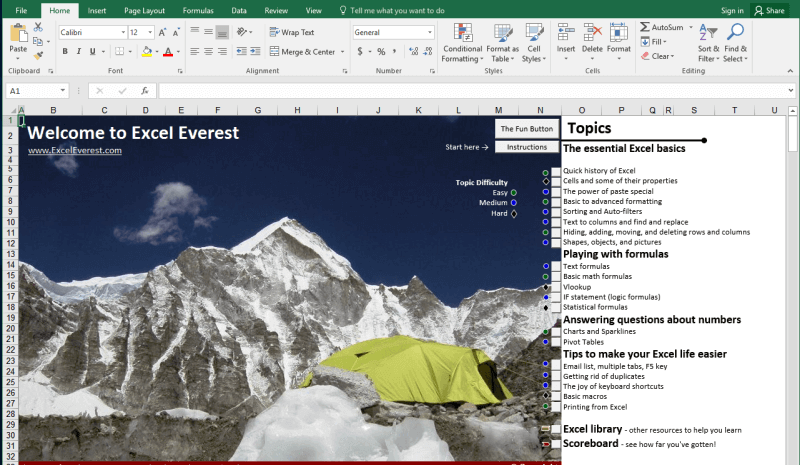
I haven’t tried it myself but an Excel tutorial in Excel. Liked the idea!
Another similar interactive Excel learning tool is from Keyskillset:
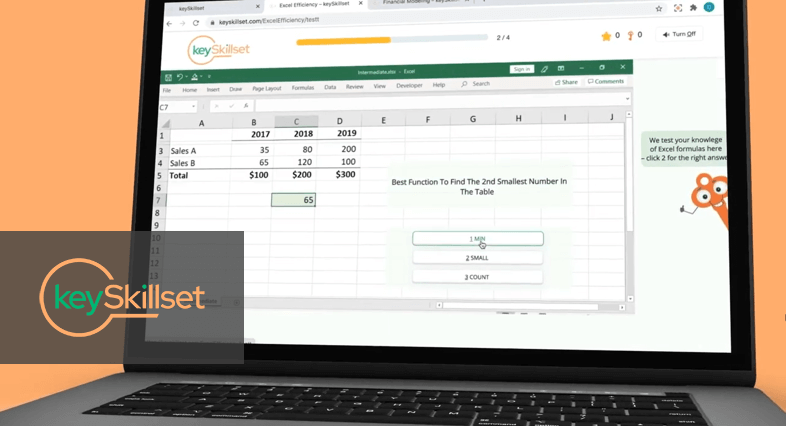
Actually, this is not completely in Excel and works as separate software but I liked how they combine the Excel training with gamification features.
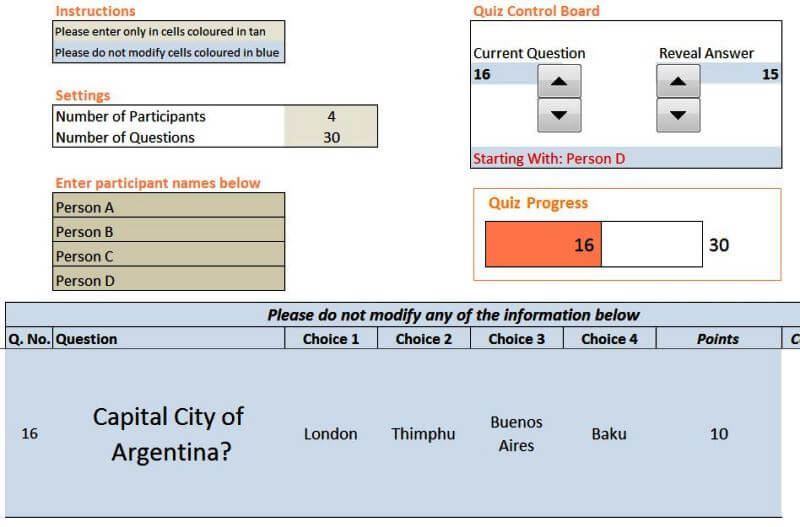
Quizzes are good tools for interactive learning and you can prepare in Excel as well. A quizmaster template from indzara.com:
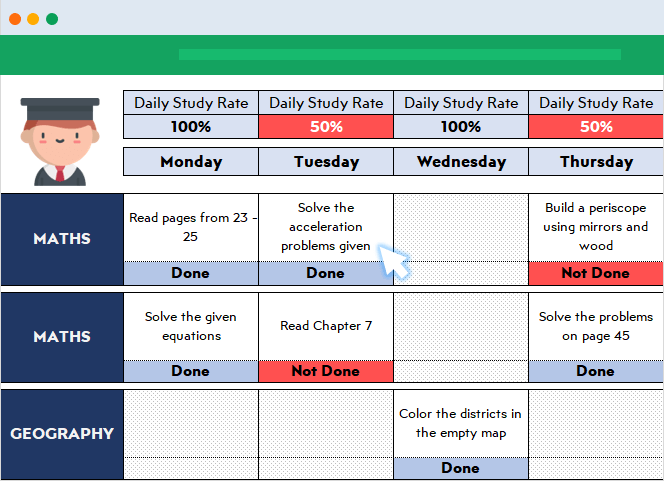
A student lesson plan template in excel which we have prepared recently:
You can learn Excel in Excel!
As said: Practice Makes Perfect!
You can test your Excel skills in Excel with Excel Formulas Trainer:
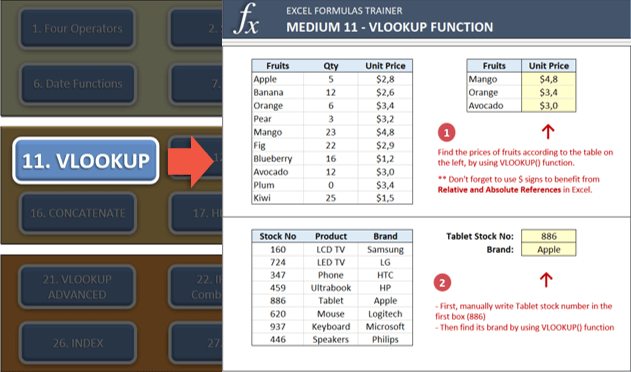
This is actually an Excel template prepared with VBA macros and basically works as a practice worksheet. It has 30 sections and around 100 questions. You can learn VLOOKUP, IF and much more excel formulas by doing. If you like the idea of “learning by doing”, then it is worth to check.
Also, this online course from GoSkills is for everyone as well, covering beginner, intermediate and advanced lessons.
By cheat sheets, we don’t refer to the piece of paper with information written down on it that an unethical person might create if they weren’t prepared for a test. What we mean is a reference tool that provides simple, brief instructions for accomplishing a specific task. We use this term because it is highly popular recently.
For example, this is a cheat sheet:
This compacted and summarized info is very useful in many aspects. When you try to memorize things, lookup, reference, etc. And can be easily created with Excel. Let’s make a Google search for a cheat sheet made in Excel.
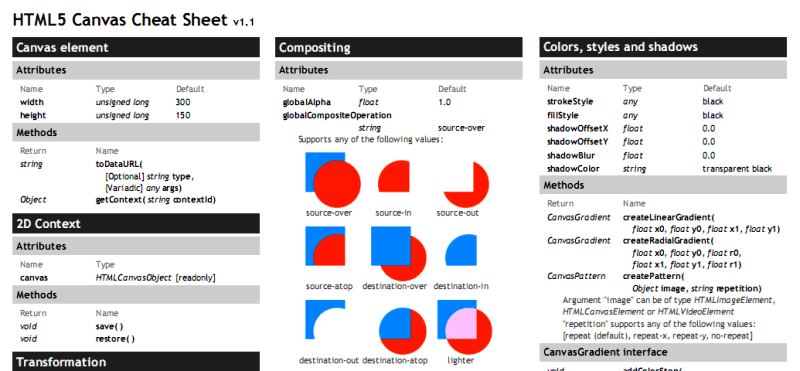
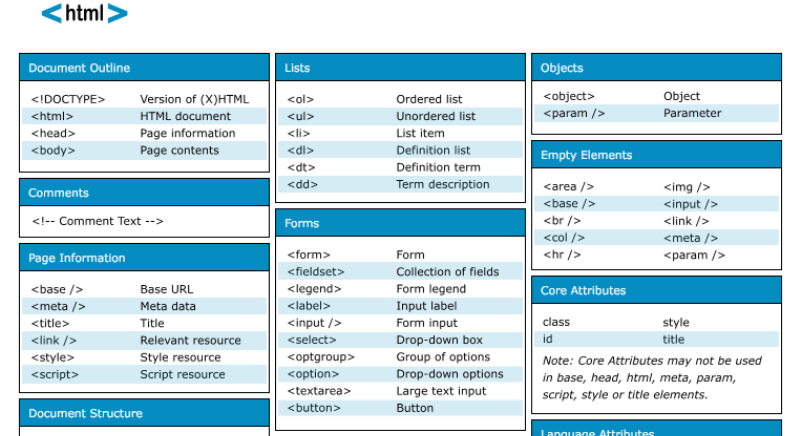
This one is from Dave Child (cheatography.com) and I was also using this one I first learned HTML:
The last example is an Excel Cheatsheet made for Excel shortcuts:
Of course, if you are looking for stylish infographics and cheat sheets, you should check out design software.
I know Excel is maybe not the best tool to do these. There are great programs or websites to make mockups, diagrams, brainstorming, mind-mapping, or project scheduling. But there are habits as well. Even though I am very open to try and use these kinds of brand-new tools, I find myself using excel for a mockup or a mind map. (select shapes, put notes, put arrows, change colors etc. Omg it is tedious)
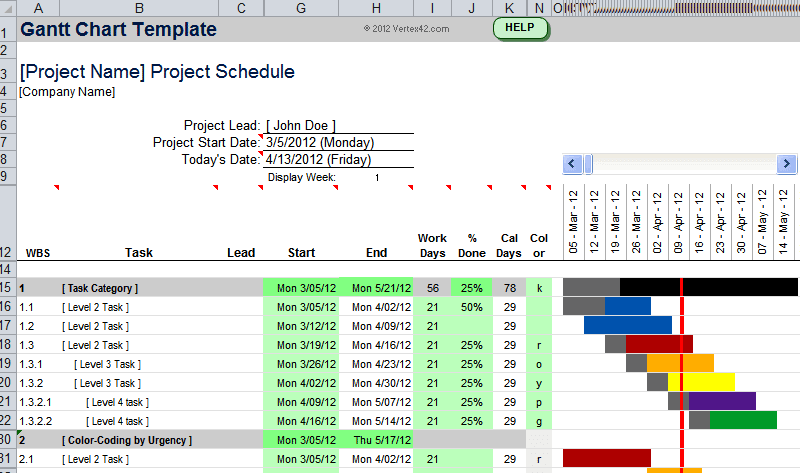
Gantt charts can be a bit old-school as agile project management methods are increasing in popularity, they are still being used widely. There are several Gantt chart excel templates on the web.
A Gantt chart example from vertex42.com:
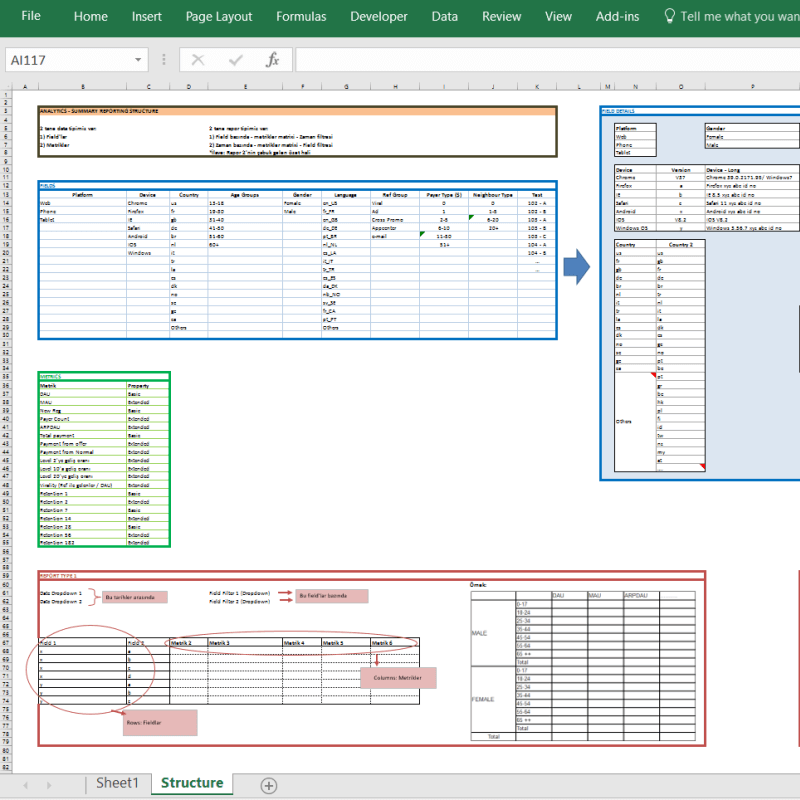
I just found out a reporting structure mockup I have prepared in Excel once upon a time:
By the way, did you see our Automatic Organization Chart Generator?
This is an Excel template that lets you create organization charts from Excel lists with a click of a button. It can be useful for small business owners and Human Resources departments.
These type of charts are directly related to Excel as most of the companies already keep their data in spreadsheets. But I also know people who even build their website mockups in Excel (with links to other sections, placement of buttons, sliders etc.).
Sometimes you may need your excel files to be updated automatically from a live data source. For example, if you are making a stock market analysis and want the latest data of some stock prices at NYSE, you can connect your Excel file to a data feed and let it take the latest info automatically (unless you want to input them one by one!)
As this is a comprehensive topic I will leave it for another post. But here is a few things you can fetch into excel:
- Stock prices
- Match results of soccer, NBA, NFL or any sports games (from live score sites)
- Fx rates
- Real-time flight data of airports
- Any info in a shared database (whether it is your company intranet or public)
This topic is getting more and more important as most data is kept on cloud systems. We don’t download info bits to our computers as we used to do in the past. So, Microsoft is working hard to improve the web integration of Excel.
Recommended Reading: Can Excel Extract Data From Website?
Yes, it is not the best idea to use Excel as a database. Because it is not designed for this purpose. Queries will take a long time especially when data gets bigger. It can be unreliable sometimes and not very secure. It is all accepted. However, we are not always after a complete set of the database systems and it can serve us as a mini-warehouse for our little data.
For example, if you keep records of your invoice data and want to make some sales analysis, it can be a good starting point. If later, you want to see more details, want to record more breakdowns you will need to move to a “real database”. It can be Access, SQL or anything. Just keep an eye on your Excel file because it has a maximum of 1 million rows.
Some of you may say “hey, it is more than enough, isn’t it?”
Generally yes. But you cannot believe how data increase in size when you want to see details. I remember when I was working as an analyst in a game development company, we were holding records of 1+ billion rows of data.
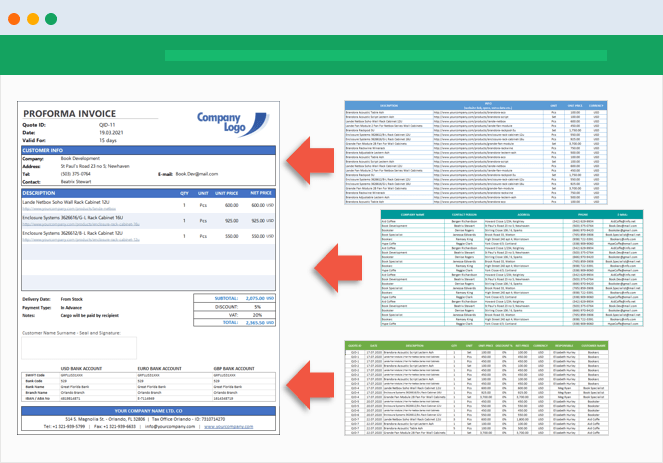
Precisely because of that, we have built some of our Excel templates (which is the favorite feature of all the users) with a database section. You may check our Invoice Generators and see how invoice recording would be super easy in Excel!
Conclusion
As the internet gets more available for everybody people started to use collaboration platforms more than before. In this aspect, online spreadsheet applications, like Google Sheets, increase in popularity and stands as a competitor to Microsoft’s Excel. Other free alternatives like open office or libre office are also popular. But if you need the advanced functionalities of Excel there is still no substitute.

Microsoft is improving the software actively. PowerPivot, Power BI, and Excel Online are all brand new features they developed recently. We will wait and see how things evolve in the following years. (investintech.com has made interviews with Excel experts about the future of Excel)
I tried to cover most of the things that can be done with Excel. If I have missed anything or if you find any errors, let me know by commenting down or sending an email.
Also, don’t forget to check our Excel Templates Collection. You may find something useful for yourself:
Excel Templates and Spreadsheets – Someka
@mikim1kolaj
I’d suggest to start from day one. Shifts could be defined as

in final version format Shift Star/End as time to hide years.
Into the main table I added two helper columns (S and T)

not to complicate main formula, but mainly to clean confusing records as start on Sun 22:00 and end on Sun 03:00.
Formulas here
Start:
=MOD(B3-1,7)+1+MOD(E3,1)

End:
=MOD(B3-1,7)+1+MOD(I3,1)+IF(MOD(I3,1)<MOD(E3,1),1,0)
payment is calculated as
=SUMPRODUCT(
  IF( (S3>ShiftStart)*(T3<ShiftEnd),(T3-S3)*Rate*24,
    (S3>ShiftStart)*
    (S3 <ShiftEnd)*
    (IF( ShiftEnd<=T3,ShiftEnd,T3) - S3)*Rate*24+

    (T3>=ShiftStart)*
    (T3<=ShiftEnd)*
    (T3-IF(ShiftStart>=S3,ShiftStart,S3))*Rate*24
  )
)
Here ShiftStart, ShiftEnd and Rate are named columns in helper range with shifts.
As a cosmetic comment to previous formulas, it’s not necessary to use formulas as
=CHOOSE(C3,"Monday","Tuesday","Wednesday","Thursday","Friday","Saturday","Sunday")to return weekday name, it’s enough to apply dddd custom format to date.
If you’ve ever opened a Microsoft Excel workbook to find no columns, rows and/or scrollbars, this is probably why: The workbook’s author hid some portion of the Excel worksheet from view so users can focus on the working area without distractions. When it looks like everything is missing, it’s often because the owner of the document has disabled properties and options to protect the working area.
SEE: The Complete Microsoft Office Master Class Bundle (TechRepublic Academy)
In this tutorial, I’ll show you how to inhibit several worksheet properties and options so user focus stays on the working area. This process is easy to implement and takes very little time. I’m using Microsoft 365 Desktop on a Windows 10 64-bit system, but you can also use older versions. Excel’s online version lets you turn off gridlines and the heading rows.
You can download the Microsoft Excel demo file for this tutorial.
Jump to:
- Why hide unused areas in Excel?
- Hiding columns and rows in Excel
- Hiding the header rows and formula bar in Excel
- Hiding the sheet tabs in Excel
- Restoring your original display
- Moving toward Excel’s protection feature
Why hide unused areas in Excel?
You usually hide a column or row to conceal or protect data and formulas, so you might be wondering why anyone would want to hide everything else. The reason? Hiding everything but the working area is a good way to obscure data and formulas you don’t want users to see or try to change.
Another good reason to hide unused areas is to make your worksheet function similarly to dashboards, which are growing in popular use. Viewers, or end consumers, might click around to focus on something in the sheet or to filter a report or graph like they would in a dashboard, but they won’t be able to make changes to the underlying data. When you’re trying to make your Excel worksheet function like a dashboard, you won’t want to see many of Excel’s traditional sheet elements.
SEE: 30 Excel tips you need to know (TechRepublic Premium)
Whether you’re protecting data or removing distractions, hiding white space and other areas of the worksheet can help. However, hiding parts of the worksheet comes with one inherent behavior that’s difficult to work around: Hiding rows and columns displaces the work area. For instance, if you hide all unused rows and columns, the work area will end up in the top-left corner of the sheet rather than the middle.
That might not matter for your particular use case, but in case it does, we’ll cover a second method that allows you to center the work area by turning off the gridlines. Keep in mind that many of the tips we’re covering today, including the hidden gridlines tip, actually involve inhibiting the display of some sheet properties and turning things off rather than truly hiding anything.
Hiding columns and rows in Excel
Hiding unused columns and rows within the sheet is a good way to keep users from exploiting the space and/or keep them focused on relevant information. It’s also a great way to spiff up a dashboard so it looks professional and complete.
SEE: The best keyboard shortcuts for rows and columns in Microsoft Excel (TechRepublic)
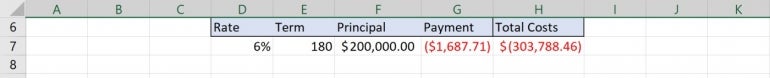
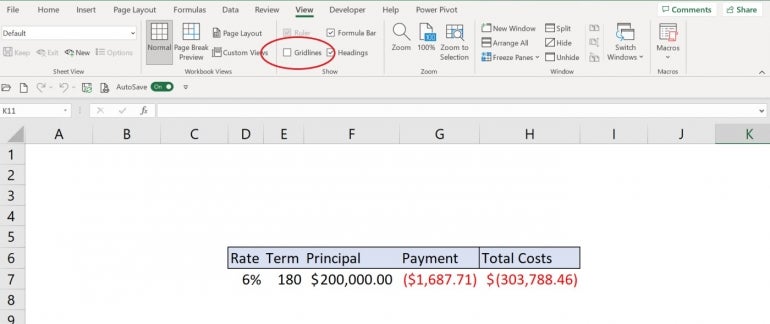
To demonstrate, we’ll use the sample worksheet shown in Figure A, which has a small working area and a lot of wasted space — unused areas that might tempt a user to wander around.
Figure A
To hide unused rows, take the following steps:
1. Click any cell in the first unused row above the work area and press Shift + Spacebar to select that row. If you’re working with the demonstration file, click a cell inside row 1.
2. Press Ctrl + Shift + Down Arrow to select every row between the selected row and the bottom of the sheet.
3. If Excel selects the header row (row 6), hold down the Shift key and press the Up Arrow to remove row 6 from the selection.
4. Click the Home tab.
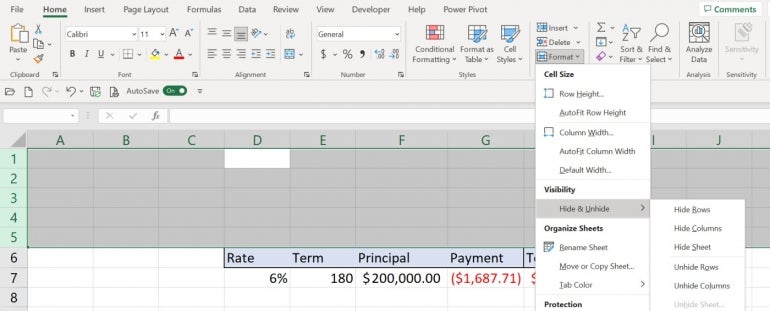
5. In the Cells group, click the Format dropdown and choose Hide & Unhide. Then, choose Hide Rows (Figure A) or right-click the selection and choose Hide from the resulting submenu. You could also simply press Ctrl + 9.
Hiding the unused rows above the work area moves the work area to the top of the sheet, as shown in Figure B. This is the displacement issue I mentioned earlier.
Figure B
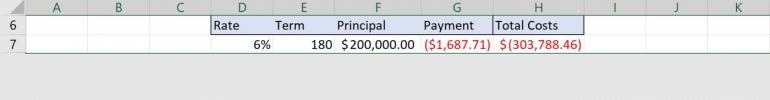
Repeat the steps above to select all the rows below the work area. Begin by clicking a cell in row 8. Figure C shows the results.
Figure C
Now it’s time to hide all of the unused columns:
1. Click any cell in column A.
2. Press Ctrl + Down Arrow to select the entire column, or click the header cell to select the entire column.
3. Press Ctrl + Shift + Down to add columns B and C to the selection.
4. If Excel selects the first column in the work area, hold down the Shift key and press the Left Arrow key to remove it from the selection.
5. In the Cells group, click the Format dropdown and choose Hide & Unhide, and then choose Hide Columns. You can also right-click the selection and choose Hide from the resulting submenu or simply press Ctrl + 0.
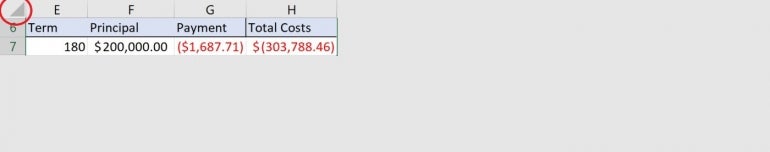
Repeat the process above by first clicking any cell in column I. Figure D shows the results. As you can see, the work area is now in the top-left corner of the screen. You can’t easily access the hidden rows and columns if you choose to make changes.
Figure D
To unhide all columns and rows in the sheet, click the sheet selector at the intersection of the row and column header cells. Doing so will select the entire sheet. Press Shift + Ctrl + 9 and Shift + Ctrl + 0 to quickly unhide everything.
How to inhibit columns and rows in Excel
If the displacement that occurred in our previous examples won’t work for what you need, you can seemingly hide empty rows and columns by inhibiting other sheet elements, such as gridlines.
To inhibit the view of the gridlines in Excel, do the following:
1. Click the View menu.
2. In the Show group, uncheck Gridlines (Figure E).
Figure E
The gridlines are gone. This simple visual change will help the viewer move straight to the work area and stay there. Admittedly, it’s still white space, but the absence of the gridlines is a good start. However, the view still displays a few other sheet elements that you might want to inhibit. Next, let’s look at hiding header rows and the formula bar.
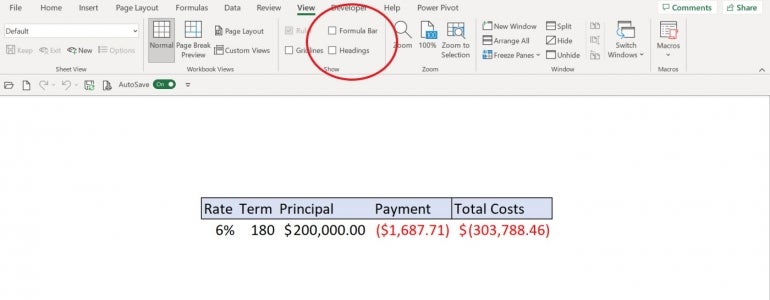
Despite the absence of gridlines, the window still looks like an Excel sheet. Inhibiting the view of the header rows and the formula bar will tone down the “this is an Excel sheet, wander around and do whatever you like” mindset and keep users in the working area.
For this part of our tutorial, you’ll turn off both header rows and the formula bar the same way you did the gridlines. Click the View tab and then uncheck Formula Bar and Headings in the Show group. Figure F shows the results.
Figure F
At this point, users with limited Excel skills probably won’t make any effort to wander beyond the working area.
You can still select the header cells even though you can’t see them. If you want to add or delete columns or rows, you still can. In Figure F, you can see that I inserted a column and a couple of rows to better center the work area.
For better or worse, the Formula bar is an application-level property. The next Excel file you or your users open will do so with the Formula bar turned off. For that reason, you might not want to turn it off, especially if users won’t know how to turn it back on.
Hiding the sheet tabs in Excel
The sheet tabs provide quick access to other sheets within the same Excel document. If you don’t want to see them, you can inhibit these sheet tabs as well. To turn off the display of sheet tabs, follow these steps:
1. Click the File tab.
2. In the left pane, click Options.
3. In the left pane, click Advanced.
4. In Display Options For This Workbook, uncheck the first three options (Figure G). You might as well turn off the scroll bars while you’re at it, too.
Figure G
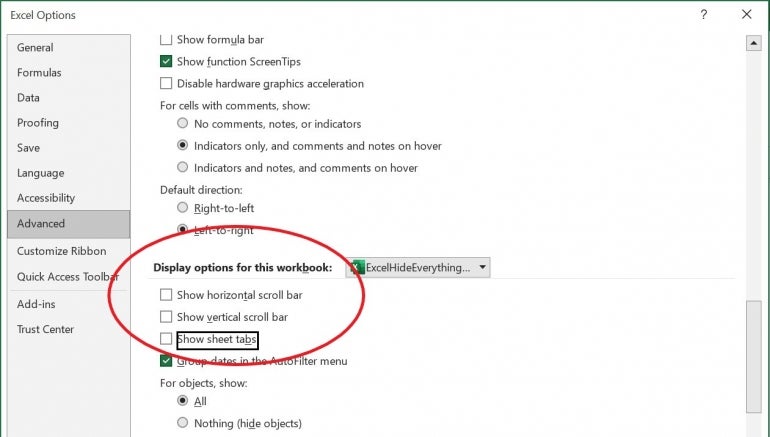
5. Click OK.
You can toggle the ribbon, but most likely, the file will open with the ribbon exposed. This is another application-level setting that you really can’t control from one use to another.
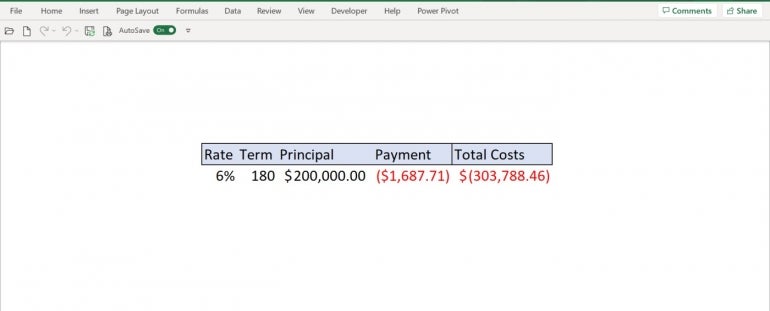
At this point, you’re done. Figure H shows a simple sheet with few distractions.
Figure H
Restoring your original display
You’ve made a lot of changes, but all of them are easy to implement and to reset. You can complete this entire reset in under five minutes. To restore the display, simply repeat the instructions listed above in reverse.
Moving toward Excel’s protection feature
If you decide that you must inhibit the Formula bar and the ribbon, you should use the WorkBook_Open() Sub procedure. This procedure will run its code when the user opens the workbook. Then, you can turn them back on using the Before_Close() Sub procedure.
What we’ve done throughout this tutorial is a simple bit of illusion. Sometimes that will be enough, and frankly, it looks nice. However, nothing in this article protects any of the sheet’s cells. For that, you’ll want to use Excel’s protection feature.
To learn more about Excel protection, read the following articles:
- Five tips for working with Excel sheet protection (TechRepublic)
- How to protect Excel formulas (TechRepublic)
- How to use passwords to grant users access to different Microsoft Excel workbook ranges (TechRepublic)
Do you have other Microsoft questions or functions that you want to learn more about? TechRepublic has thousands of Microsoft tutorials and resources available to help you make the most of your Microsoft technologies. We also offer a variety of Microsoft education programs and certifications through TechRepublic Academy.
read more, but Google sheets let you edit the sheet simultaneously. If you use Microsoft Excel, you would need to manually save the file. But in the case of Google sheet, you can concentrate on creating the sheet, doing the work that matters, and your sheet will be automatically saved up on your Google drive.
Contents
- 1 Do all Excel formulas work in Google Sheets?
- 2 Is there anything Excel can do that Google Sheets cant?
- 3 Can Google Sheets replace Excel?
- 4 Is Google Sheets as powerful as Excel?
- 5 What are the disadvantages of Google Sheets?
- 6 Should I learn Excel or Google Sheets?
- 7 Why don t companies use Google Sheets?
- 8 What can Google Sheets be used for?
- 9 Are Google Sheets free?
- 10 Can I open Excel in Google Sheets?
- 11 Is spreadsheets same as Excel?
- 12 Can you link Excel to Google Sheets?
- 13 Is Google Sheets better than Excel 2021?
- 14 Can Google Sheets do pivot tables?
- 15 Is Google Sheets Good for accounting?
- 16 Do accountants use Google Sheets?
- 17 Is Google sheets good enough?
- 18 What is better than Google Sheets?
- 19 Can Google Sheets be used offline?
- 20 Is Google Sheets secure?
Do all Excel formulas work in Google Sheets?
Google Sheets supports cell formulas typically found in most desktop spreadsheet packages. Functions can be used to create formulas that manipulate data and calculate strings and numbers.
Is there anything Excel can do that Google Sheets cant?
Unlike Google Sheets, Excel can import data from many external sources, including databases, text files, Excel files and cloud services.Google Sheets’ ability to import data is far more limited.
By adding macros, Google Sheets continues to grow into a viable alternative to Excel for most spreadsheet users. And unlike Excel, Sheets is free.Still, for those who use spreadsheets for serious data analysis or visualization, Excel remains the superior product. Excel has more built-in formulas and functions.
Is Google Sheets as powerful as Excel?
Google Sheets stands out most obviously from Excel because of it’s excellent collaboration abilities. Multiple people can be working on the same spreadsheet at once without any lagging or confusion. You can even access the spreadsheet from your account on multiple devices at the same time without disruption.
What are the disadvantages of Google Sheets?
Disadvantages of Google sheets (when to use Excel)
- If you deal with big data, Google sheet may work slower than Excel.
- Google sheets don’t have a wide range of data visualisation options unlike Excel.
- For complex accounting and bookkeeping, formulas in Google sheets are not good enough.
Should I learn Excel or Google Sheets?
Compared to Excel, Google sheet is a preferred application for collaboration. Excel is the superior product in the case of statistical analysis & visualization since many formulas are built-in in Microsoft excel.
Why don t companies use Google Sheets?
Companies seeking to use spreadsheets for large amounts of data want to cut corners and increase productivity by any means. Without effective shortcuts, businesses will not use Google Sheets for any project requiring more than listing raw data, which does not require much file sharing or collaboration anyways.
What can Google Sheets be used for?
Google Sheets allows users to edit, organize, and analyze different types of information. It allows collaborations, and multiple users can edit and format files in real-time, and any changes made to the spreadsheet can be tracked by a revision history.
Are Google Sheets free?
Google Sheets is free, and it’s bundled with Google Drive, Docs, and Slides to share files, documents, and presentations online. It includes almost all of the same spreadsheet functions—if you know how to use Excel, you’ll feel at home in Google Sheets. You can download add-ons, create your own, and write custom code.
Can I open Excel in Google Sheets?
2.5 Convert Excel files to Sheets
Open Driveand double-click an Excel file.At the top, click Open with Google Sheets. Click File. Save as Google Sheets.
Is spreadsheets same as Excel?
Allowing everyone to work on the same spreadsheet at the same time can increase productivity and save you time. Google Drive’s Spreadsheets is like Microsoft Excel for dummies. Microsoft SkyDrive Excel has more bells and whistles and the similar polished and professional look you expect from Microsoft Office software.
Can you link Excel to Google Sheets?
1] Open the file in Google Sheets which you want to synchronize with MS Excel.You have to paste this link in the MS Excel document which you want to connect with Google Sheets. If you paste this link in your web browser, you will see that it is available as a web page.
Is Google Sheets better than Excel 2021?
If you want to choose one of the tools for data analysis and visualization, Microsoft Excel is far ahead of Google Sheets. Its statistical analysis functions, along with powerful data processing and advanced calculations make it far more feature rich.
Can Google Sheets do pivot tables?
You can add pivot tables based on suggestions in Google Sheets or create them manually. After you create a pivot table, you can add and move data, add a filter, drill down to see details about a calculation, group data, and more. Summarize thousands of rows of data, such as sales each year segmented by region.
Is Google Sheets Good for accounting?
1) Budgets and Accounting
Creating budgets, keeping track of expenses, financial accounting – these are the core functions of any worthwhile spreadsheet tool. Google Sheets is no exception. Google Sheets includes a number of helpful templates for things like monthly or annual budgets, expense reports, and more.
Do accountants use Google Sheets?
For accountants who work in large teams or need to share data with a number of different people, then Google Sheets is the perfect tool. You can easily share with any email address you like and control their access through the share settings.
Is Google sheets good enough?
If you are looking for a good enough spreadsheet tool to start with (without a lot of bells and whistles and advanced functionalities), you can start with Google sheets. And if you’re ready to invest some money to get more power and data analysis functionalities, you should go for Excel in Microsoft 365.
What is better than Google Sheets?
Top 5 Google Sheets Alternatives To Help Your Team
- Microsoft Excel Online. The first google sheets alternative is Microsoft Excel Online.
- Zoho Sheets. Next up on our list of awesome Google Sheet alternatives is Zoho Sheets, spreadsheet software for collaborative teams.
- Airtable.
- LibreOffice Calc.
- Smartsheet.
Can Google Sheets be used offline?
Open Google Docs, Sheets, and Slides offline
Make sure you’re signed in to Chrome. Go to drive.google.com/drive/settings. Check the box next to “Create, open, and edit your recent Google Docs, Sheets, and Slides files on this device while offline.”
Is Google Sheets secure?
Your content is stored securely
When you create a file on Google Docs, Sheets, & Slides and share it, it is stored securely in our world-class data centers. Data is encrypted in-transit and at-rest. If you choose to access these files offline, we store this info on your device.