
Constructing of financial analyses for evaluation of business activity and investment projects. Forming reports and documents forms in Excel for accounts department, marketing department, warehouse facilities, and other structures of the company.
Forming of reports analyses with examples
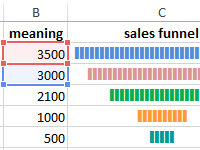 Chart of funnel sales in Excel download for free.
How to make the sales funnel in Excel using formulas, the SmartArt drawing and the Charts tool. The description of different methods with step-by-step instructions and illustrations.
 Calculation of the financial activity ratio in Excel.
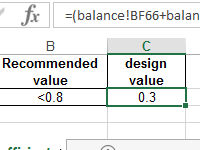
The coefficient of the financial activity shows how much the enterprise depends on borrowed funds. It characterizes financial stability and profitability. How to calculate the indicator by the formula?
 Financial analysis in Excel with an example.
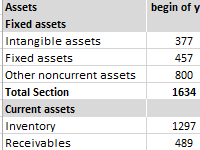
The financial and statistical analysis in Excel: automation of calculations. How to analyze the time series and forecast sales, taking into account the trend component and seasonality?
 Coefficient of pair correlation in Excel.
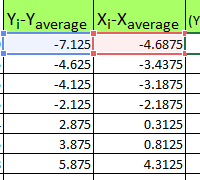
The correlation coefficient (the paired correlation coefficient) allows us to discover the interconnection between the series of values. How to calculate the coefficient of pair correlation? The construction of the correlation matrix.
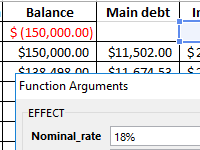 Calculation of the effective interest rate on loan in Excel.
Calculation of the effective interest rate on the loan, leasing and government bonds is performed using the functions EFFECT, IRR, XIRR, FV, etc. Let’s look at examples of how real interest is considered.
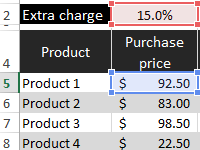 Budgeting of the enterprise in Excel with discounts.
Template for planning the budget of the trading company with the calculation of providing customers discounts. The main advantage is the ability to create loyalty programs with control over the company’s profit. Management of discounts, their impact on margin.
 Turnover ratio of receivables in Excel.
The factor of turnover of receivables shows the rate of conversion of goods sold into the money supply. Formula by balance, calculation of the indicator in days.
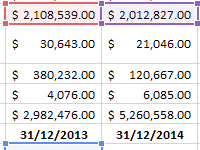
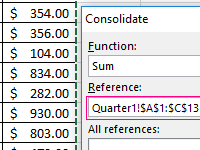 Data consolidating in Excel with examples of usage.
Let’s look at the example of practical work how to do data consolidation. Combining the ranges on different sheets and in different books. Consolidated report using formulas.
5 Excel Reports Examples You Need to Learn
Looking for Excel reports examples? This article has got you covered with 5 easy-to-follow examples to help you create powerful reports in Excel.
Excel is a widely used tool for data analysis and reporting. Creating reports in Excel is not only essential but also an indispensable skill in today’s business world. With the right knowledge and tools, you can easily create powerful and professional-looking reports in Excel.
In this article, we will explore 5 Excel reports examples that will help you learn how to create effective reports in Excel.

-
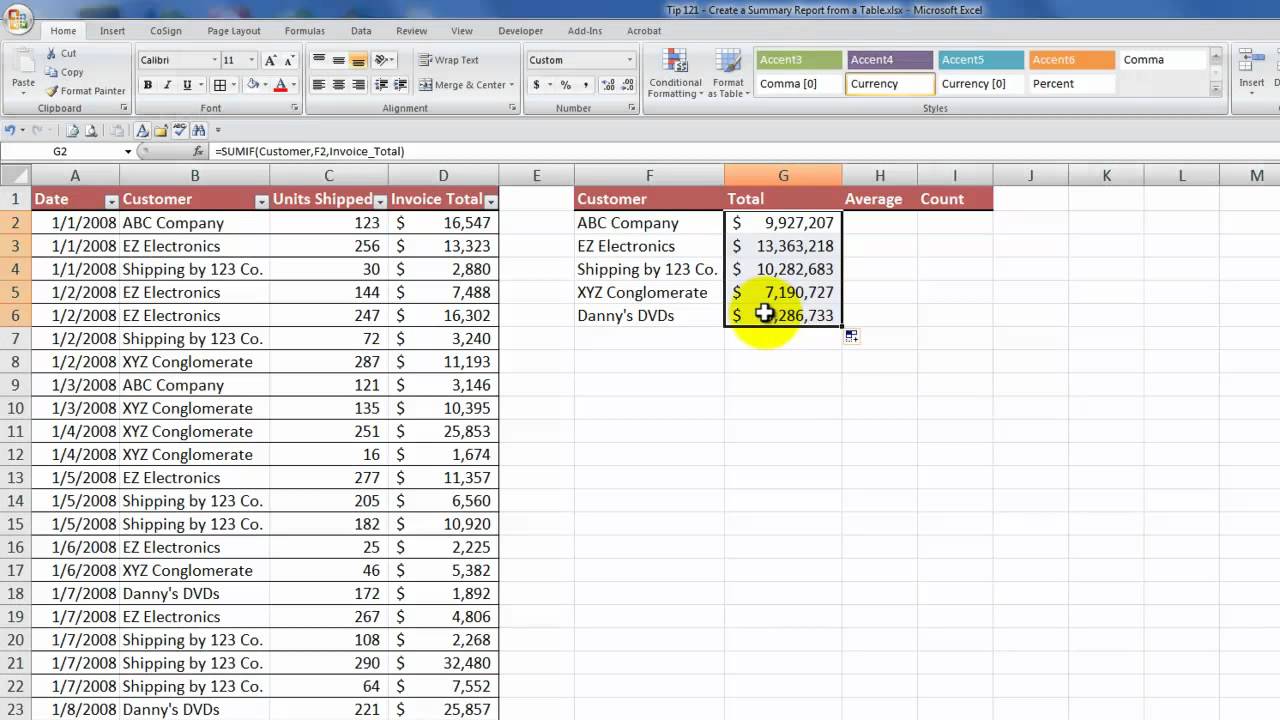
Sales Report
The sales report is a critical report for any business. It provides insights into the performance of the sales team and the company’s revenue. With Excel, you can create a sales report that shows the monthly, quarterly, or annual sales performance. The report can include charts, tables, and graphs to make it easy to understand.
-
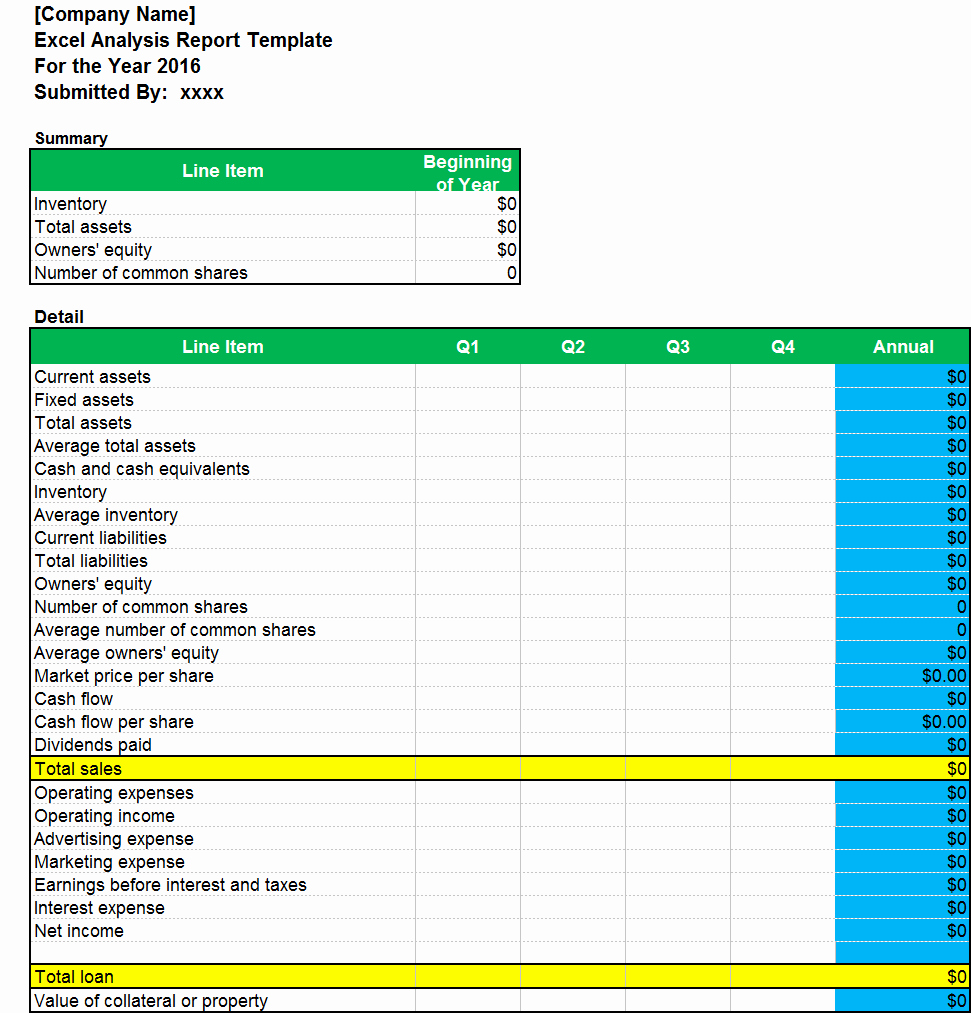
Financial Report
A financial report is an important report that shows the financial health of the company. It provides insights into the company’s revenue, expenses, and profitability. With Excel, you can create a financial report that shows the income statement, balance sheet, and cash flow statement. You can also include charts and graphs to make the report visually appealing.
-
Project Status Report
The project status report is a critical report for project managers. It provides insights into the progress of the project and whether it is on track. With Excel, you can create a project status report that shows the project timeline, milestones, and tasks. You can also include charts and graphs to show the progress of the project.

-
Inventory Report
The inventory report is an essential report for any business that deals with inventory. It provides insights into the stock levels and helps with inventory management. With Excel, you can create an inventory report that shows the current stock levels, stock value, and stock turnover. You can also include charts and graphs to show the inventory trends.
-
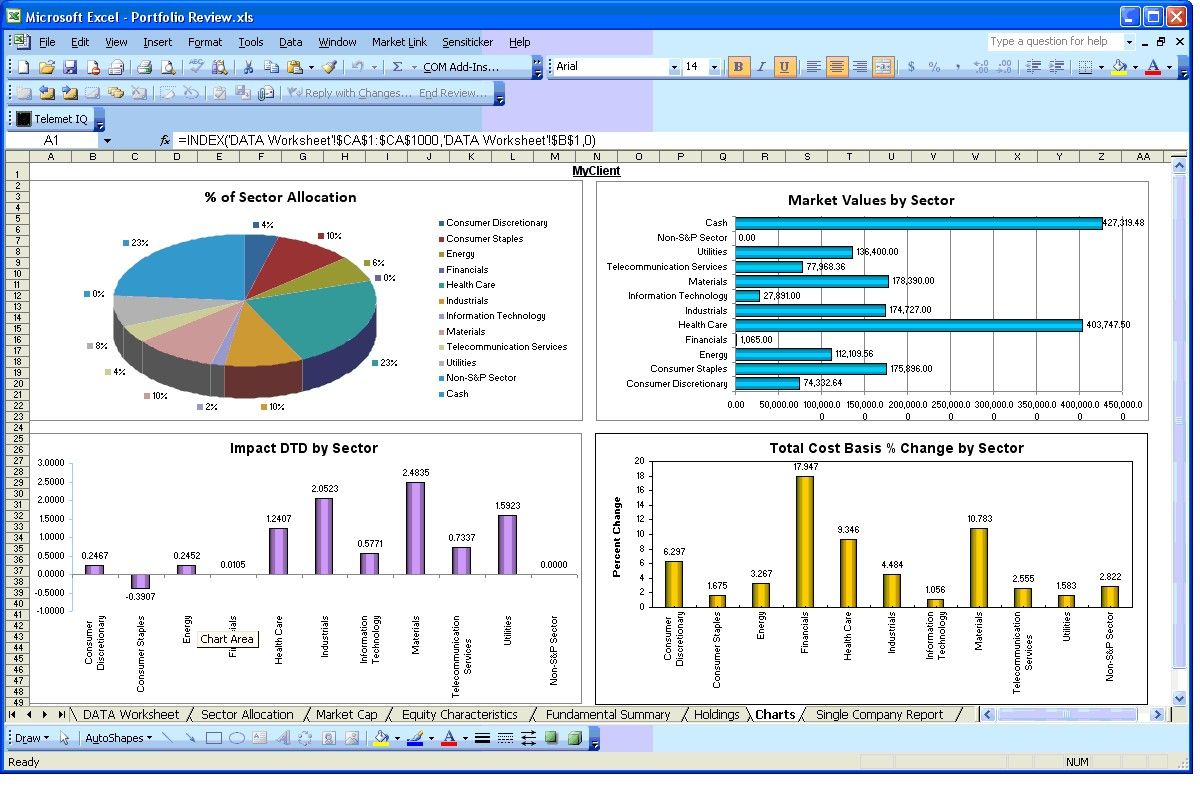
Marketing Report
The marketing report is an important report that shows the effectiveness of marketing campaigns. It provides insights into the marketing channels and the ROI of the campaigns. With Excel, you can create a marketing report that shows the website traffic, leads, conversions, and ROI. You can also include charts and graphs to make the report visually appealing.
In conclusion, creating reports in Excel is an essential skill for any business professional. With the right knowledge and tools, you can easily create powerful and professional-looking reports in Excel. The examples above are just a few of the many reports that you can create in Excel. Start practicing these examples today and become a reporting expert!

When creating reports in Excel, it’s important to remember a few key tips to ensure the reports are effective and easy to understand.
Firstly, always consider your audience. Who will be reading the report and what information do they need to see? Ensure that the report is tailored to their needs and is presented in a way that is easy for them to understand.
Secondly, use charts and graphs to visualize the data. People are more likely to understand information that is presented visually, so incorporating charts and graphs into your report can make it easier for your audience to understand the data.

Lastly, keep your report concise and to the point. Your audience doesn’t want to read through pages and pages of information. Keep it brief and highlight the most important information.
In addition to these tips, there are several Excel features that can be used to create effective reports. These include conditional formatting, pivot tables, and the use of formulas and functions.
Conditional formatting allows you to highlight certain data points in your report based on specific conditions. For example, you can use conditional formatting to highlight cells that are below a certain threshold or cells that contain a certain keyword.
Pivot tables are an excellent tool for analyzing large amounts of data. They allow you to group and summarize data, making it easier to identify trends and patterns.
Formulas and functions can be used to perform calculations and manipulate data within your report. Excel has a wide range of formulas and functions that can be used to perform complex calculations, such as calculating percentages or performing statistical analysis.
By utilizing these features and following the tips outlined above, you can create effective and professional-looking reports in Excel. With practice and experience, you’ll become a reporting expert and be able to create reports quickly and easily.

10 Another Image Examples of the Excel Reports Examples
Подготовили подборку разработанных нами интерактивных управленческих отчетов в Excel для экономистов и финансистов. Эти отчеты или дашборды можно скачать, заполнить данные и вносить изменения, а еще разобраться с тем, как они построены и «прокачать» свои навыки в Excel. Но не обещаем, что это будет легко )
Скачивайте файлы — это бесплатно. А если вы хотите научиться строить такие отчеты самостоятельно, приходите к нам на курсы.
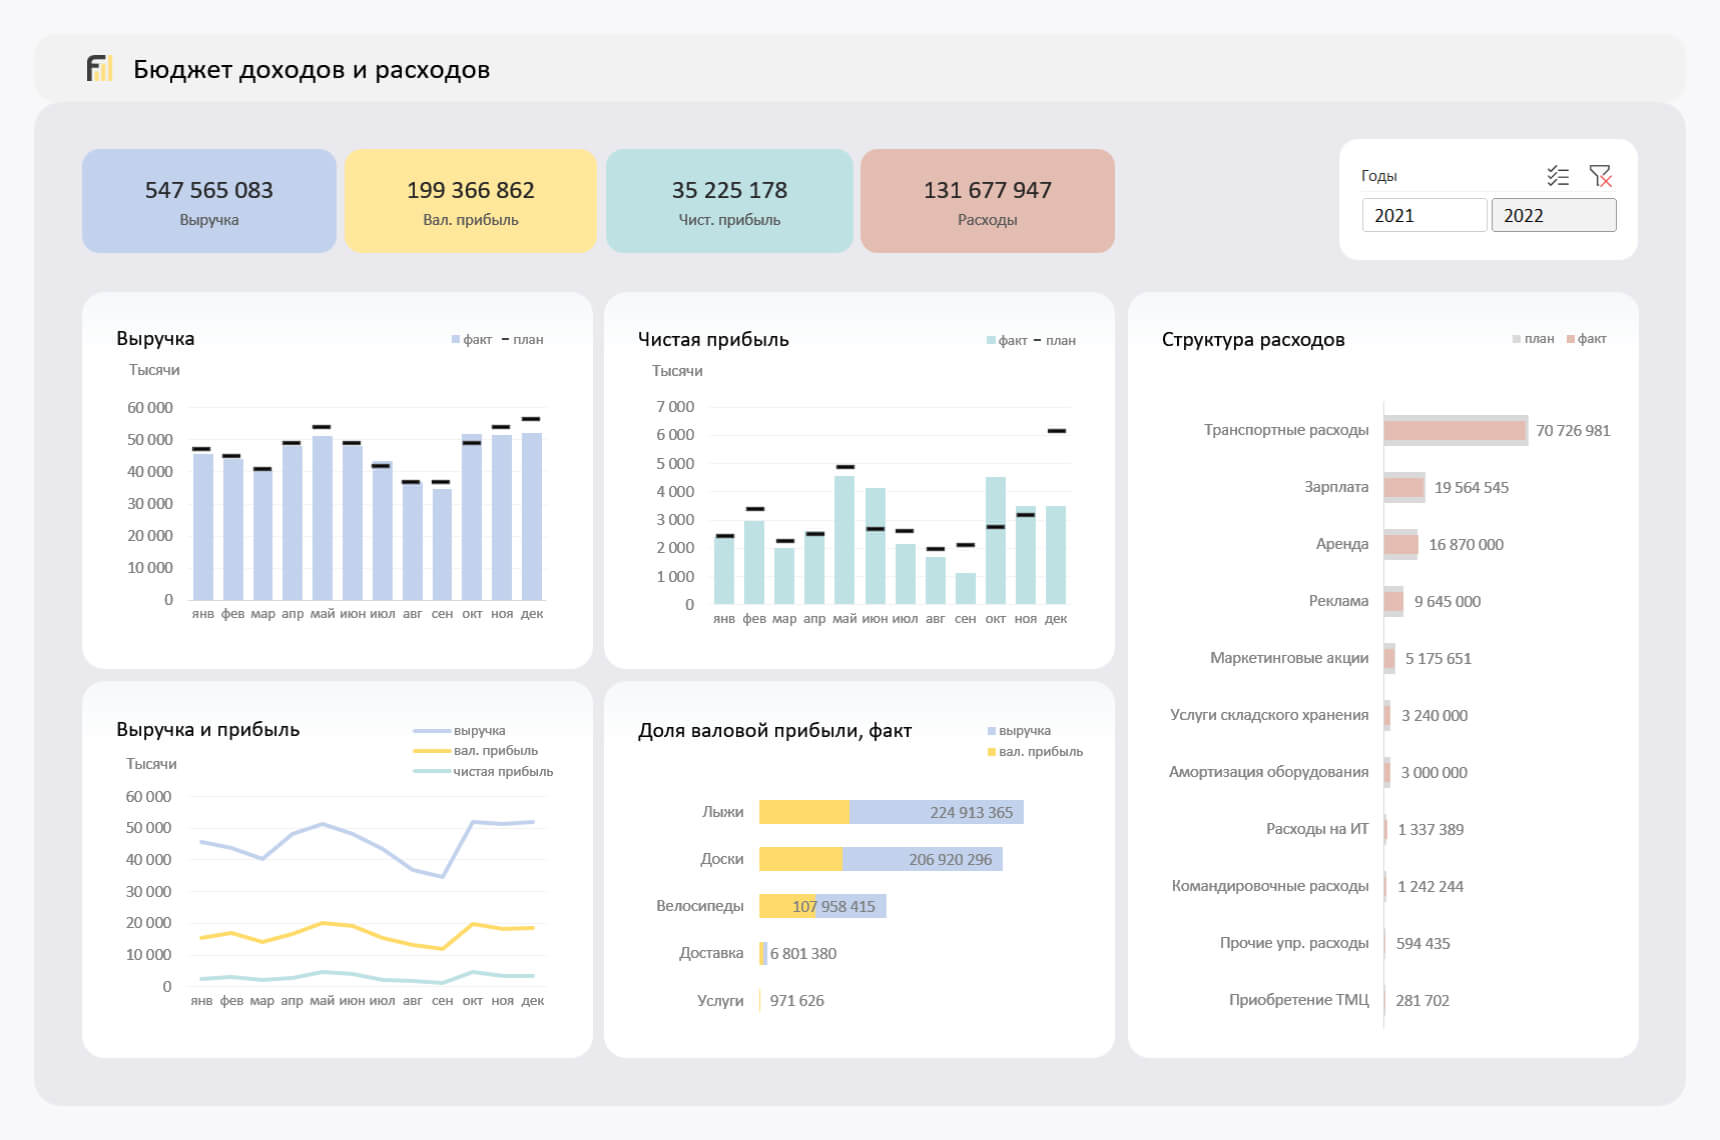
Если вы хотите научиться консолидировать бюджеты с использованием Power Query и выполнять расчеты ключевых показателей с помощью DAX-формул, приходите к нам на курс «Бюджетирование с Business Intelligence».
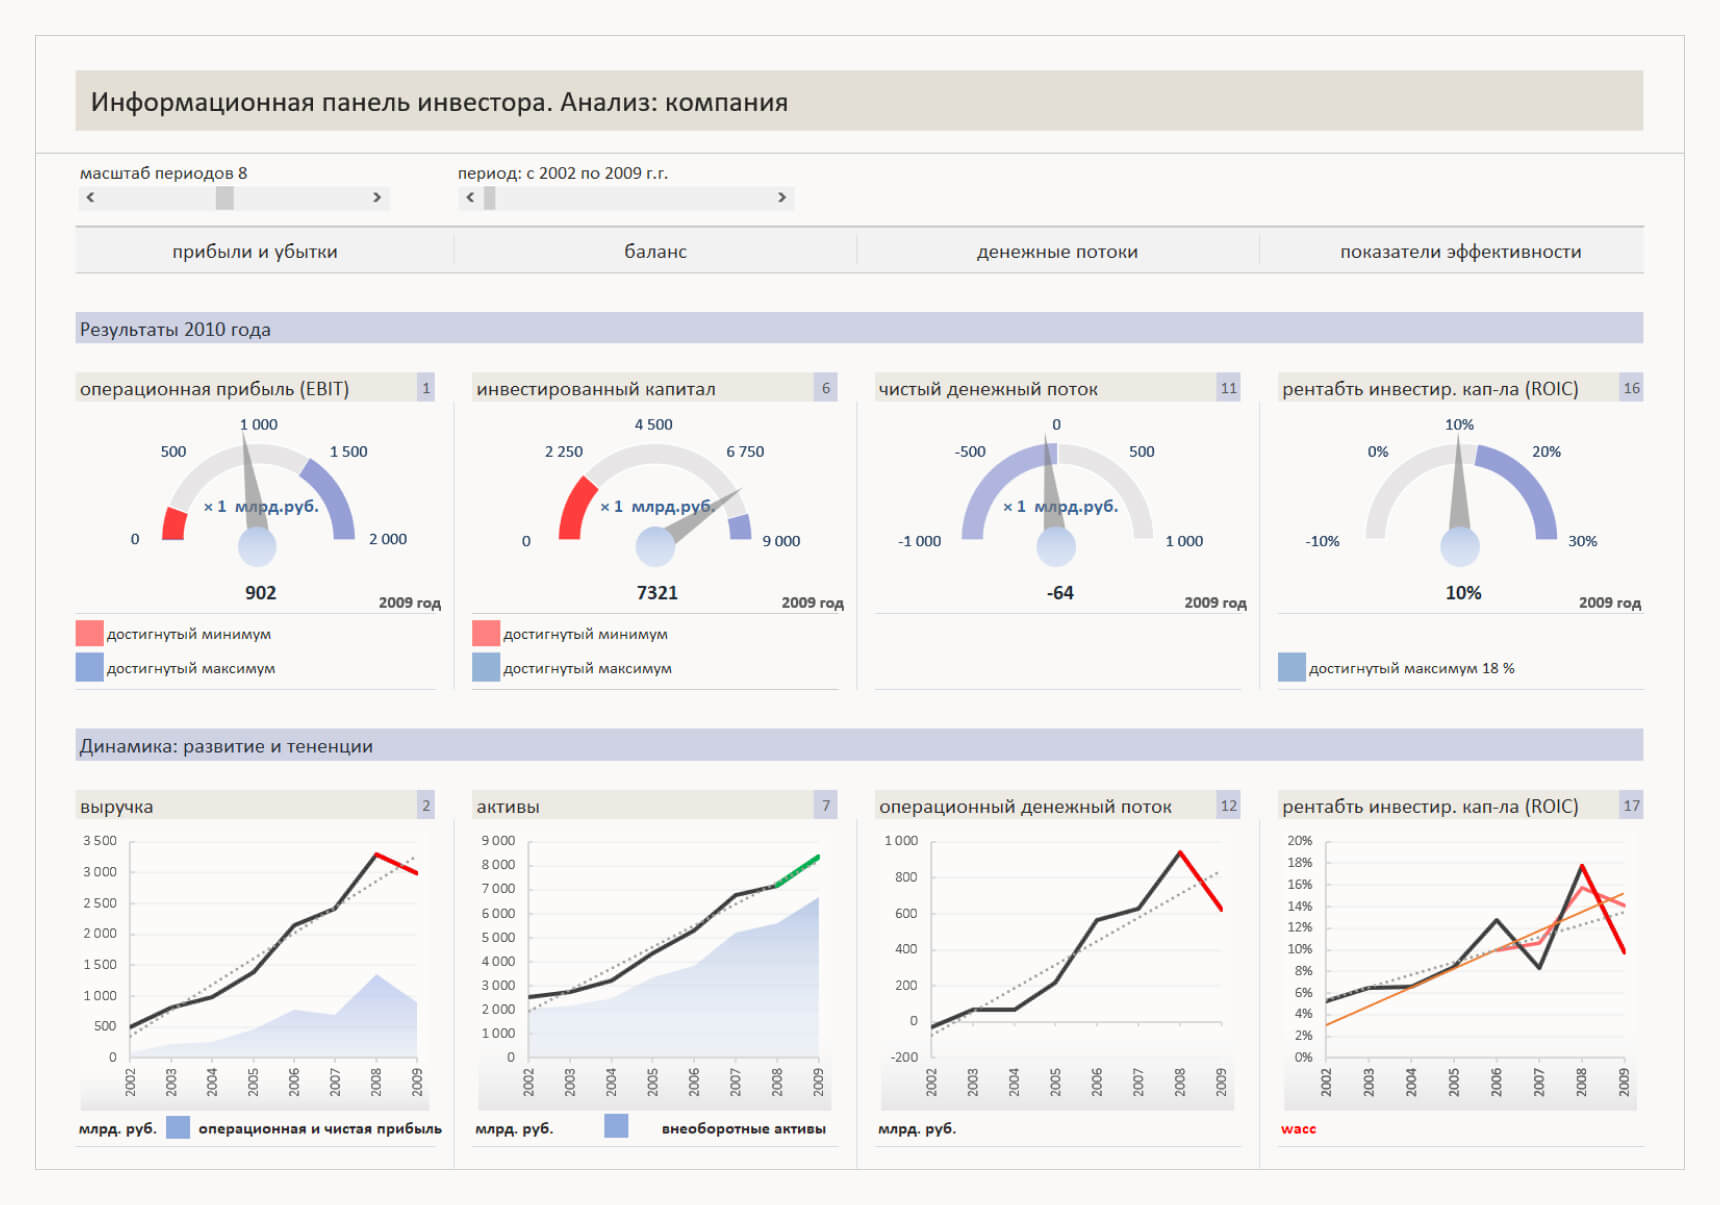
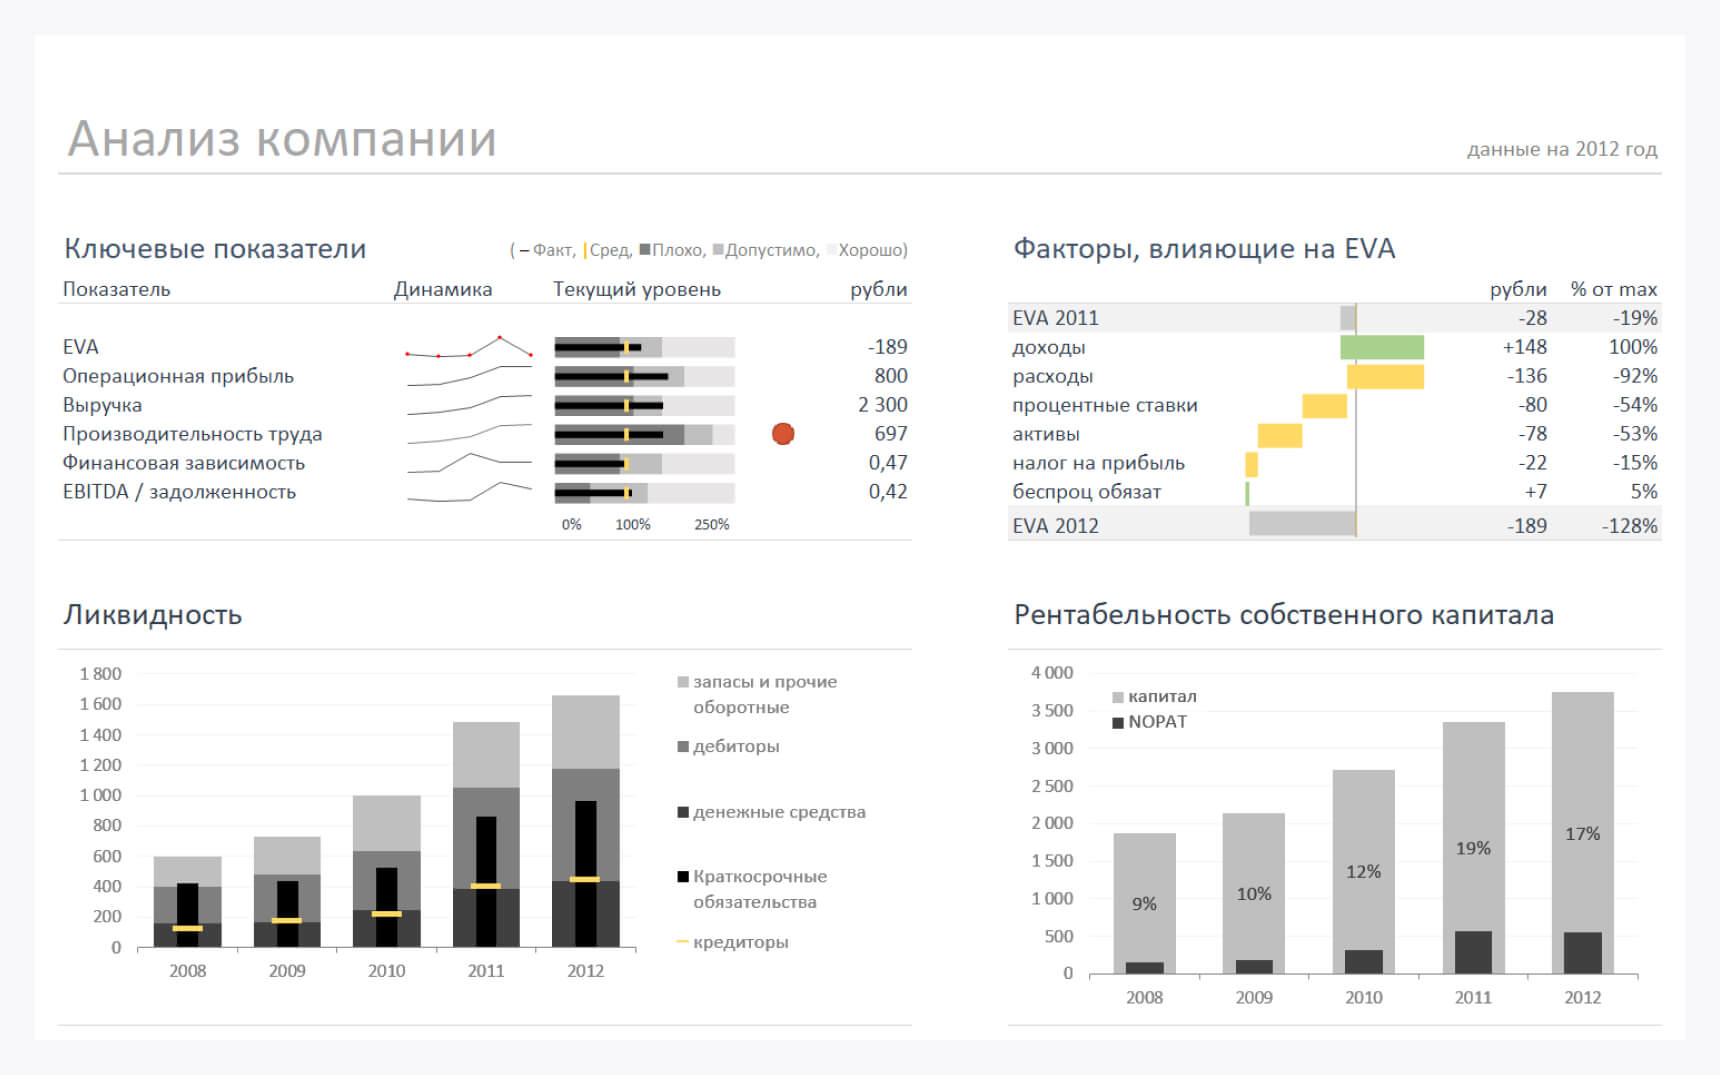
Анализ ключевых показателей и EVA
В отчете проиллюстрированы изменение ключевых показателей, ликвидности, рентабельности собственного капитала и факторы, влияющие на изменение EVA.
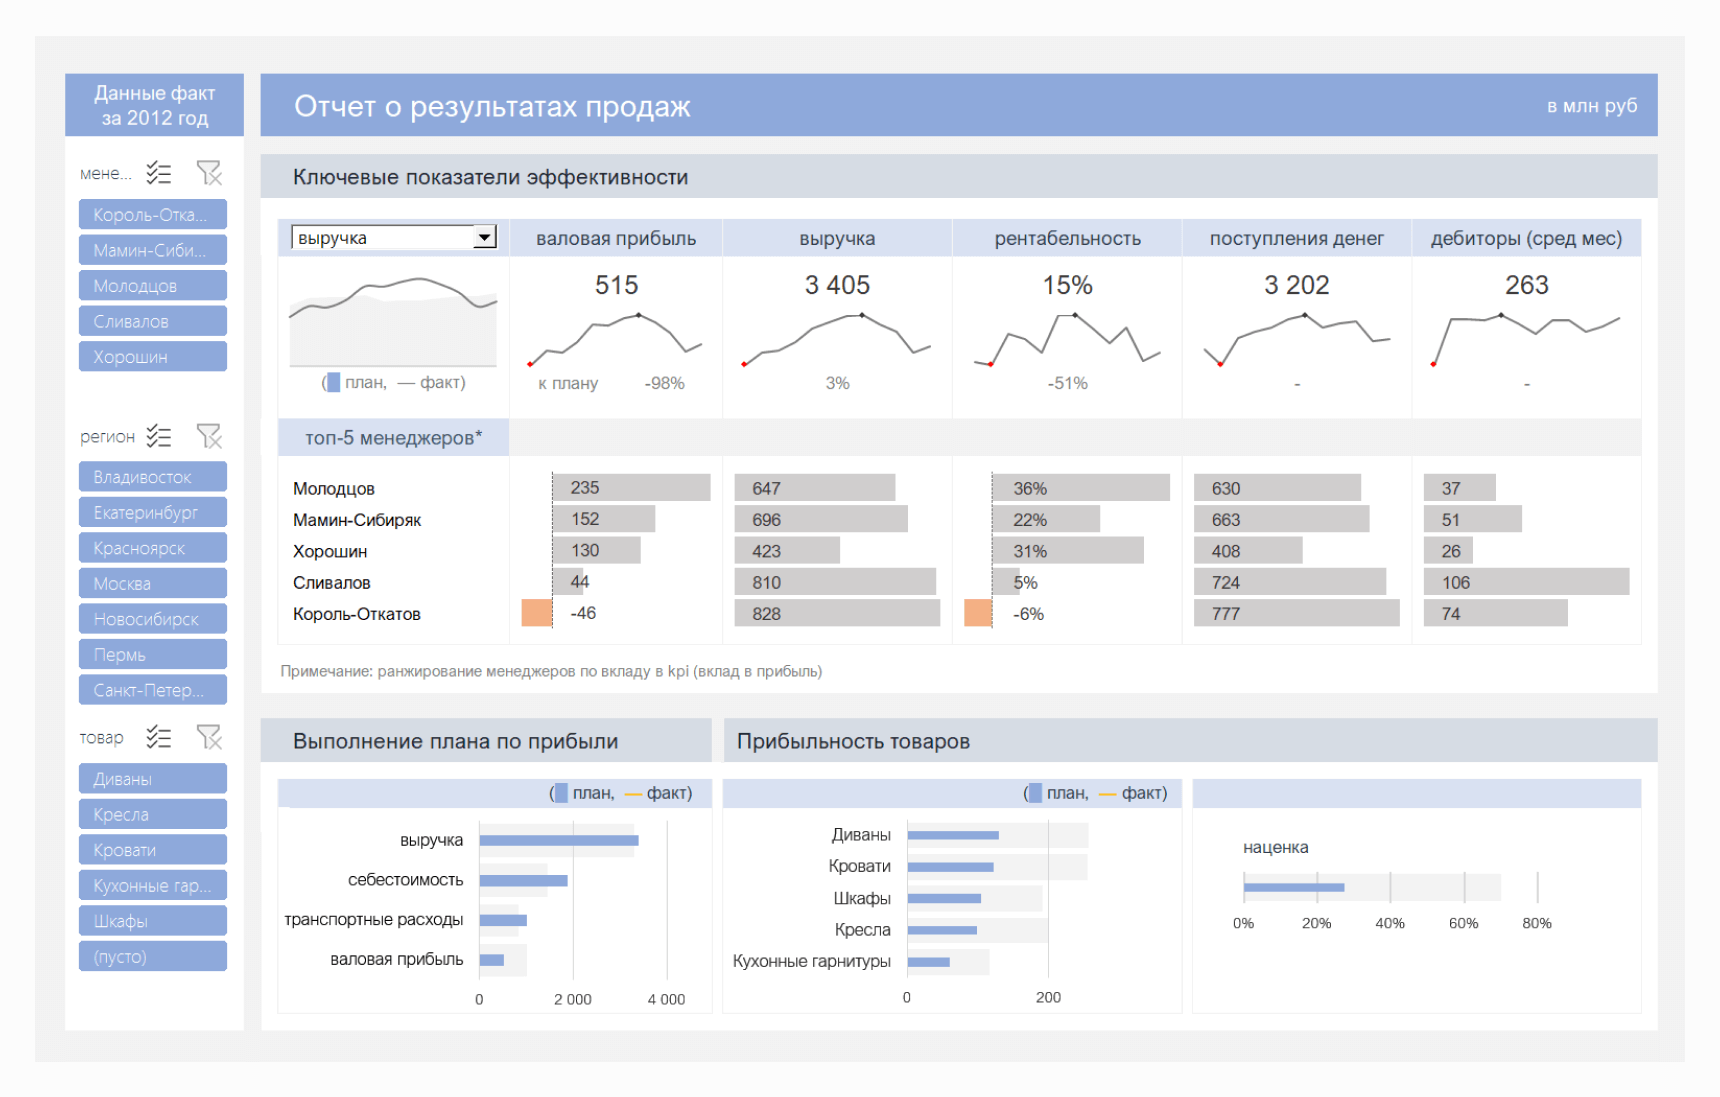
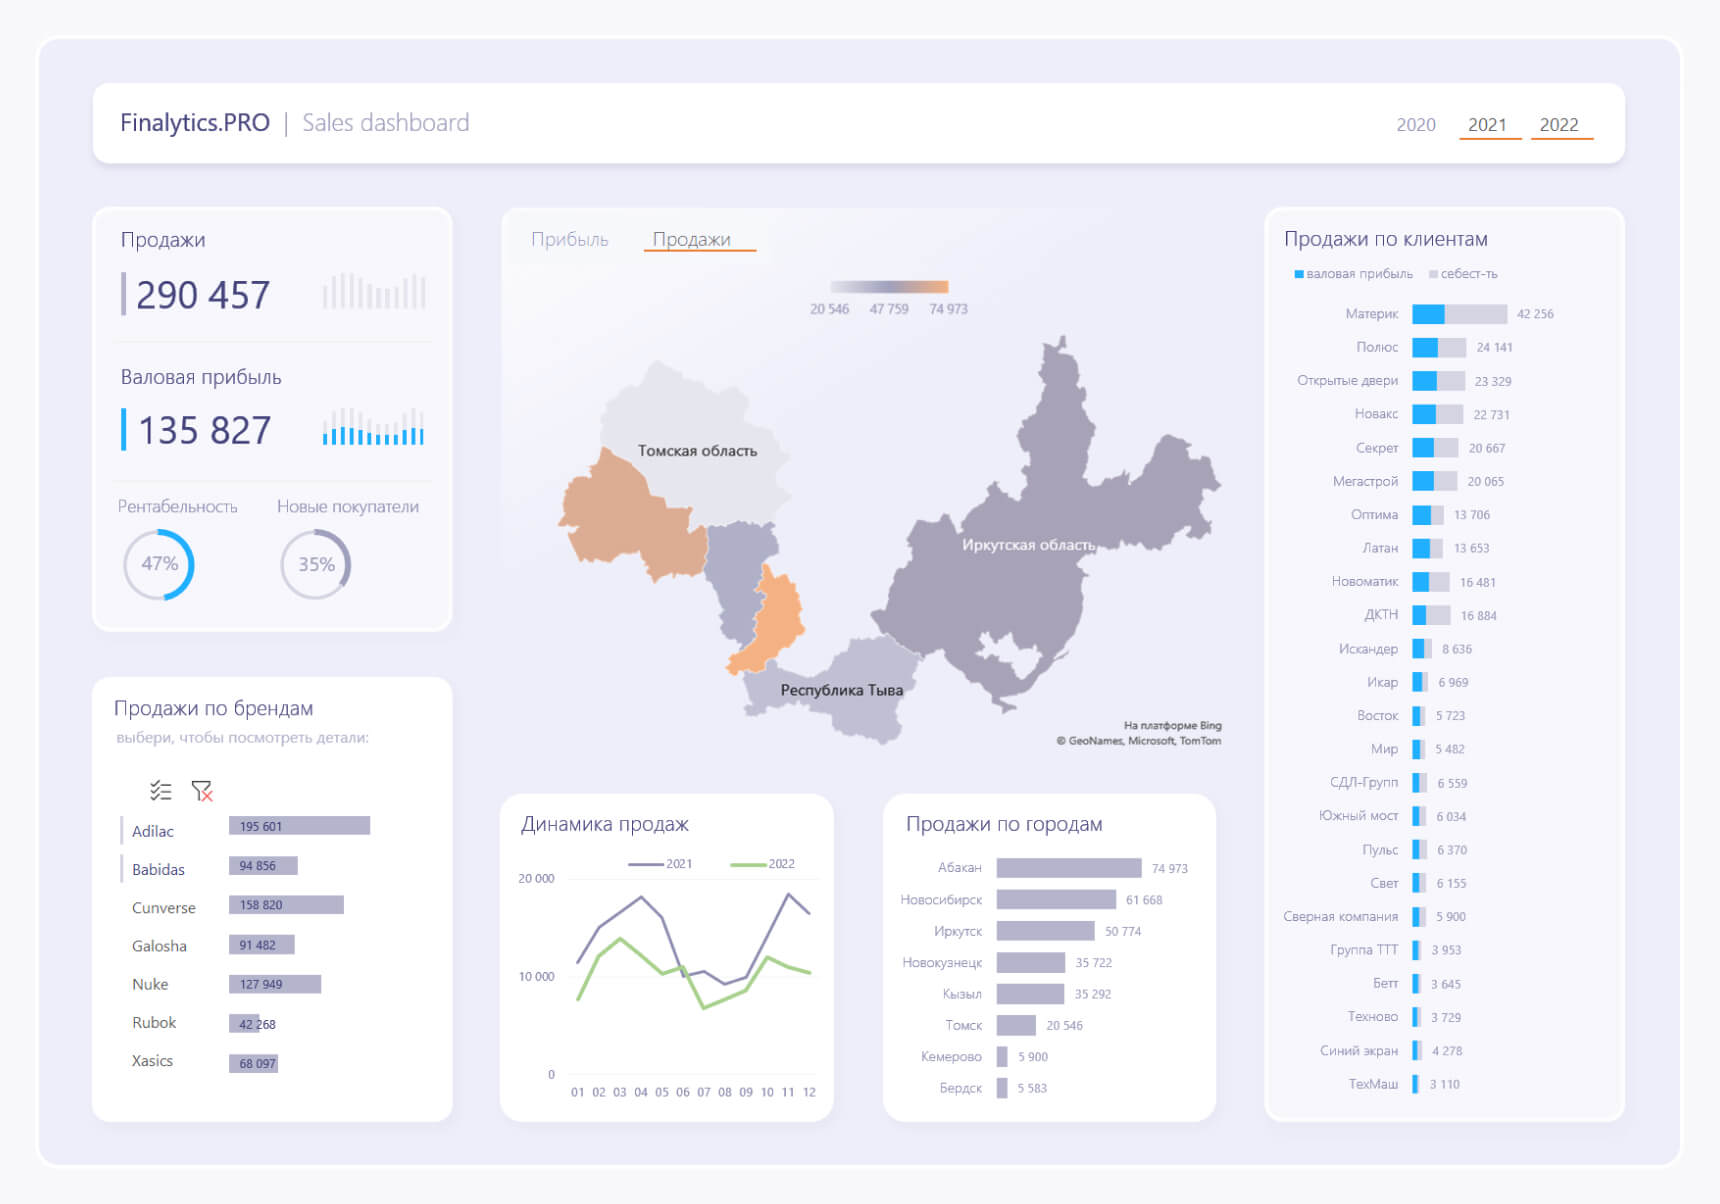
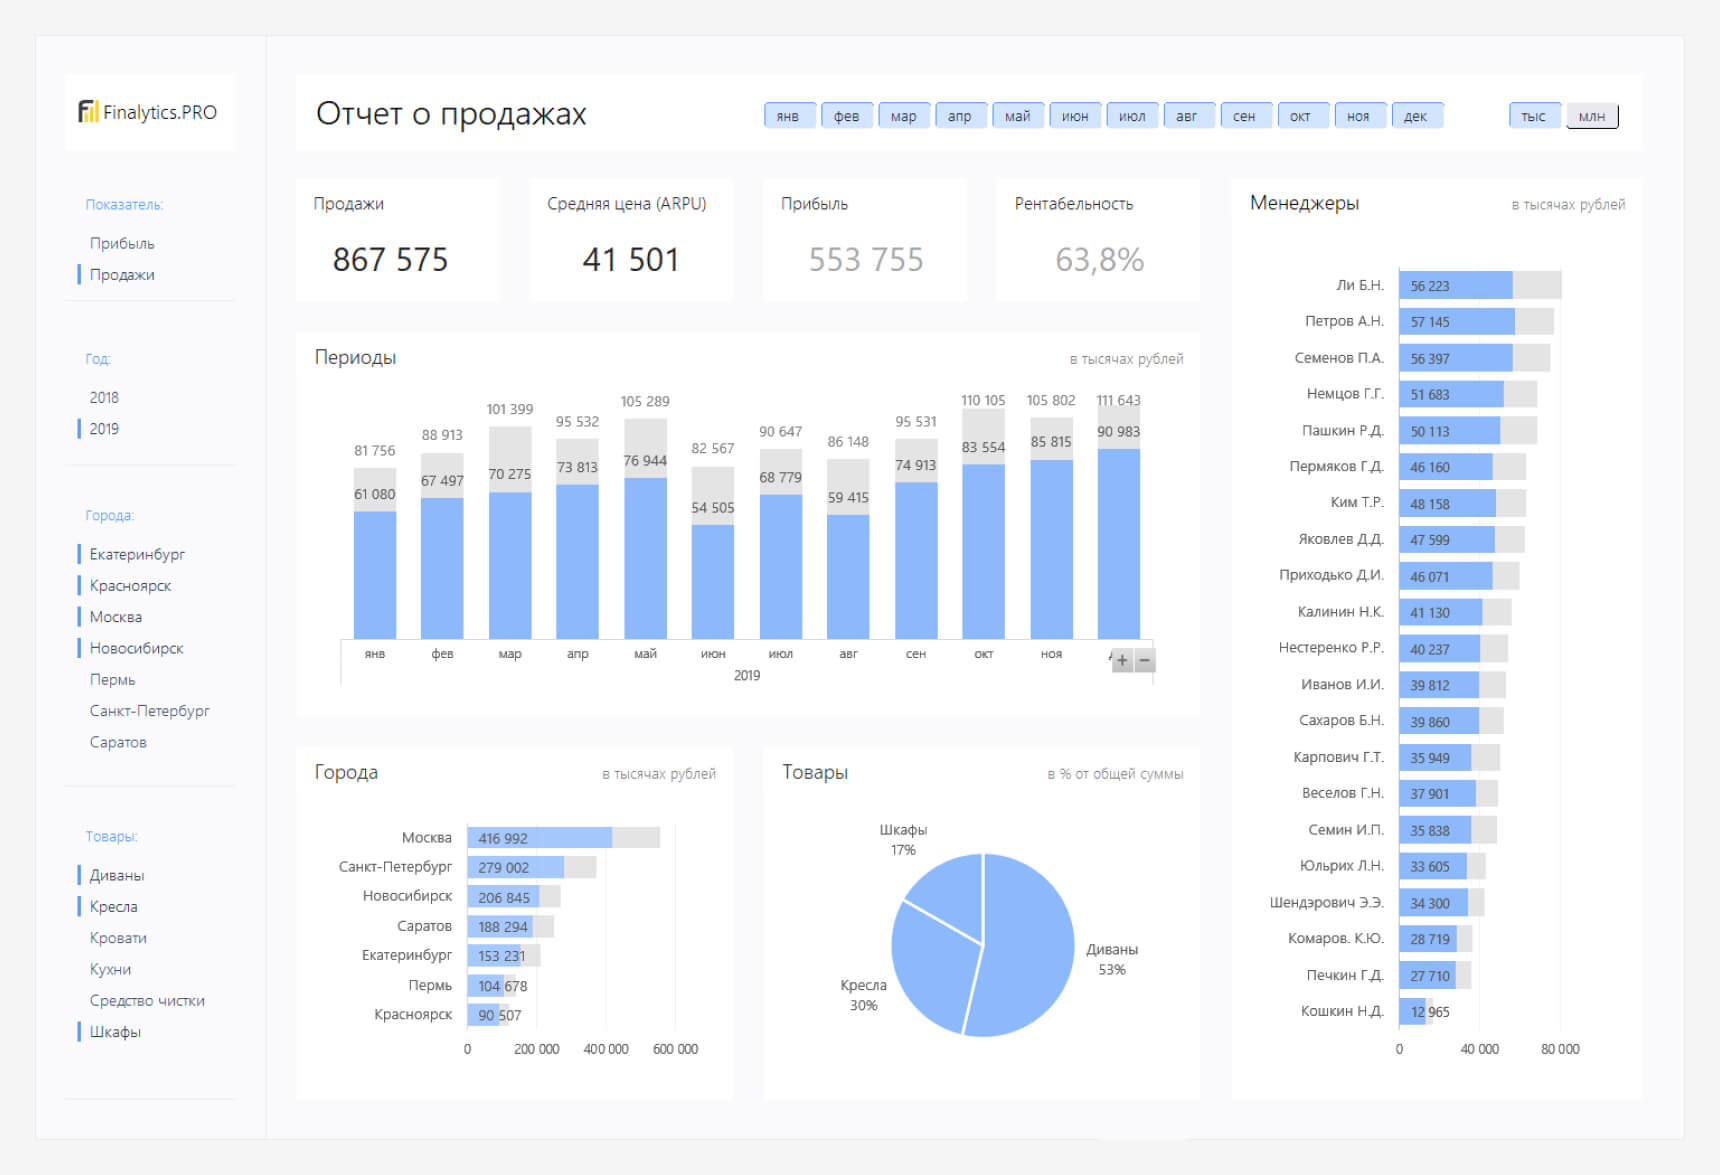
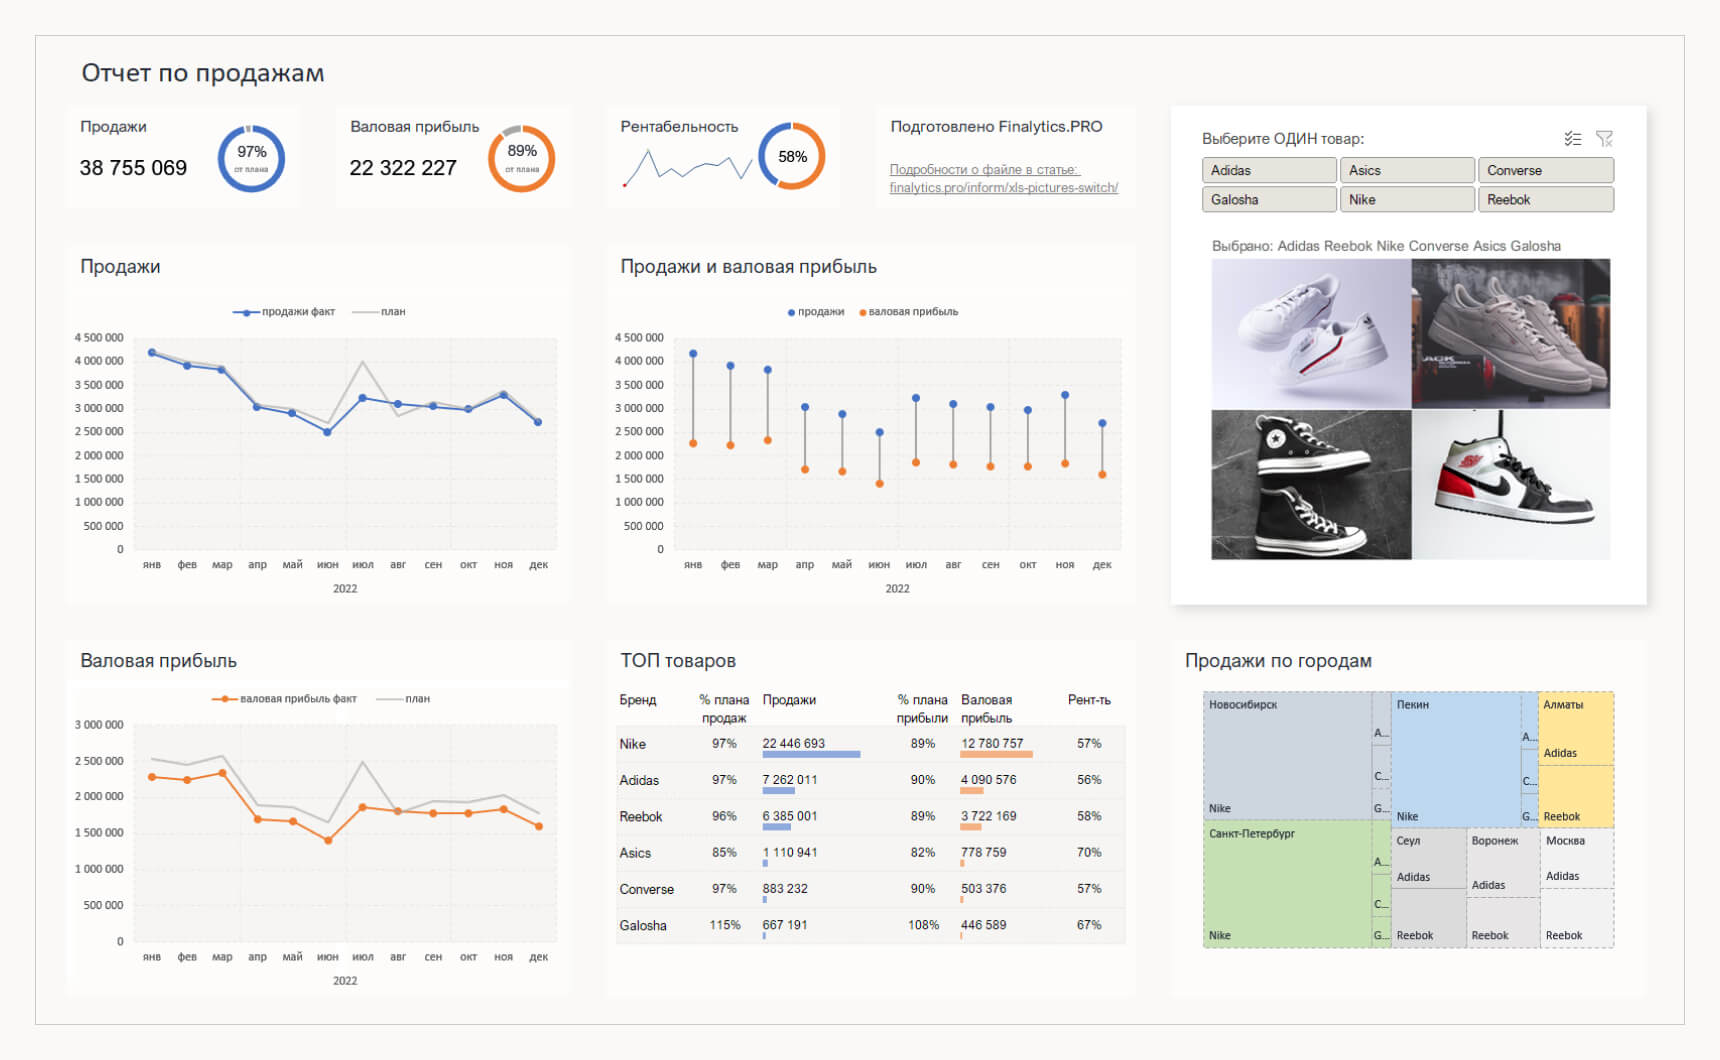
Отчет о результатах продаж
Файл показывает выполнение плана и ключевые показатели эффективности: прибыль, выручку, рентабельность и поступление денег. А также вклад менеджеров в формирование показателей.
Skip to content
In the event that you manage a group employee or busy household, it is simple to manage your computer data using Excel templates which means that your work is completed faster. All your projects will run more efficiently and you will become probably the most organized person. But making or discovering the right Excel Reports Examples can have a long time. Fortunately, you found this website that provides a variety of free excel templates to help make your lifetime easier today.
Take in be Some of the Great things about Utilizing the Excel Reports Examples Template That You Will Get Here
The spreadsheet program provides tools for analyzing and visualizing data in an clear to see way. When you have a couple of data, you can use spreadsheets not merely to save lots of this data but also to manage and carry out analytical processing. Spreadsheets make complicated processing in an easier way even people who have little technical experience can use it. Spreadsheets also permit you to present data that you’ve was able to become easier to know and interesting. In a nutshell, Spreadsheets can make your lifetime easier. There are many benefits to utilising the example Excel spreadsheet. On the very first try, you will immediately realize why these examples can help you save plenty of time. Making your own personal Excel Reports Examples spreadsheet can drain plenty of your time and energy, which you need to be able to save lots of by directly using this sample spreadsheet. These Excel Reports Examples template examples help make sure that you do not forget to enter any important data when creating your spreadsheet, something that happens more often than not. Samples of these spreadsheets may be used by anyone without requiring knowledge of varied mathematical functions that already exist in Microsoft Excel.
Edit Excel Reports Examples Just like a Professional Easily
Below you may find various examples of Excel Reports Examples that are easy to use and free to download. Unlike others, this Excel Reports Examples template is designed taking into reason its simplicity of use, even for beginners. This Excel Reports Examples sample could be adjusted such that it can be modified to accommodate your needs easily. This lets you save time, energy, and mind when coming up with documents such as for instance a professional. Excel spreadsheets like Excel Reports Examples usually are used by professionals in doing their jobs. Professionals start from scratch to create and manage Excel Spreadsheets according to the data they manage. This calls for a advanced of skill and a very long time. But with the presence of the Excel Reports Examples example the next makes every type of individual can manage their data without requiring an extended time. Your work will be simpler utilizing the Excel Excel Reports Examples template, where you only need to enter specific information and the spreadsheet is going to be generated automatically.
Prepare This Excel Reports Examples Template Anytime
You can use this Excel Reports Examples for business or personal use. Please read this short article to completion and find that which you need. If you don’t require it in the near future, as time goes on you will definitely need it. Don’t waste your own time, please select and save each Excel Reports Examples below to your computer. Don’t Waste Your Time! Save Now! Samples of Excel spreadsheets vary for different purposes and will definitely allow you to in a variety of tasks, especially in managing finances. Maybe you will need this template to just enhance the inventory of Excel Templates that you will need at any time. Or you are able to do a direct search by filling out the “Search” column with this page.
Other Samples of Excel Reports Examples


Planning a project only gets you so far. You also have to monitor your progress and performance to track if you’re on schedule and within budget. Then there are your stakeholders whose expectations must be managed. That’s where Excel report templates come in.
Project reports are tools that project managers use to extract valuable project data. Excel report templates are a great tool to determine how you’re doing and keep your stakeholders updated.
Using Excel Report Templates for Project Management
The great thing about Excel report templates is that they’re free to download. Below are 10 essential Excel report templates that you can use now to get valuable data on your project. These Excel report templates cover everything from status reports to risk registers for a clear view of how your project is doing.
Microsoft Excel is a great tool as these Excel report templates show, but they only go so far. Excel report templates must be imputed manually and are labor-intensive. They also don’t reflect real-time data so they’re always slightly behind. Project management software is the next step to gaining greater efficiency in managing your project, but if you’re not ready for that, Excel report templates will help.
Excel Report Templates for Project Management
Below are Excel report templates for project management, but they’re only a small sampling of the free project management templates we have to download on our template page. There are dozens of Word and Excel templates to help you through every stage of your project’s lifecycle.
We’ve culled through that pack of templates to highlight our free Excel report templates. Download one or all of them now and use them to extract the information you need to deliver a successful project. When you’re ready to take your project templates one step further, read to the end and see how project management software leaves Excel project templates in the dust.
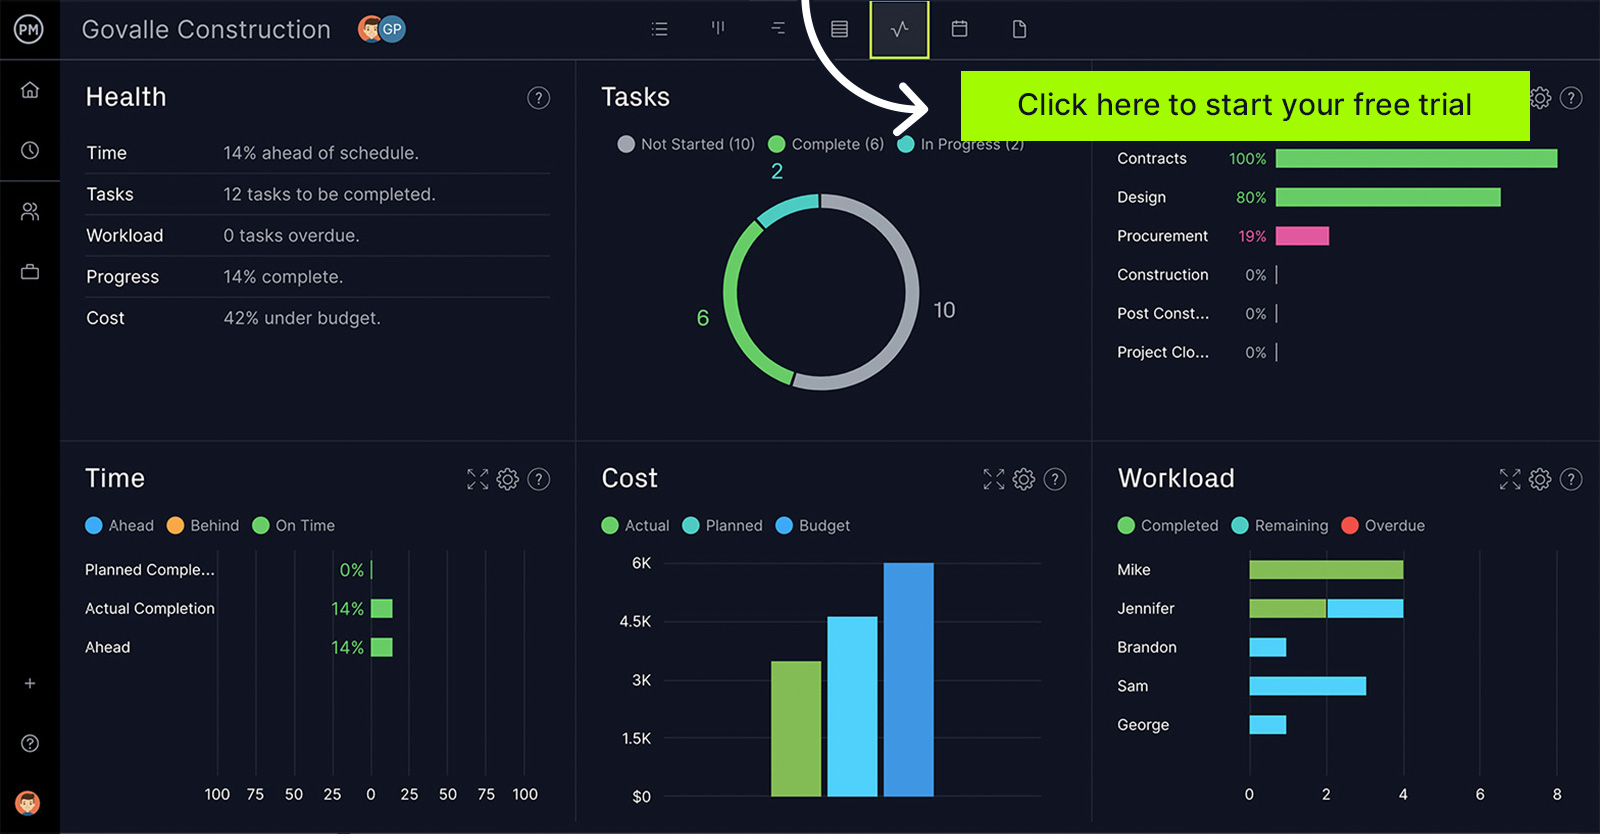
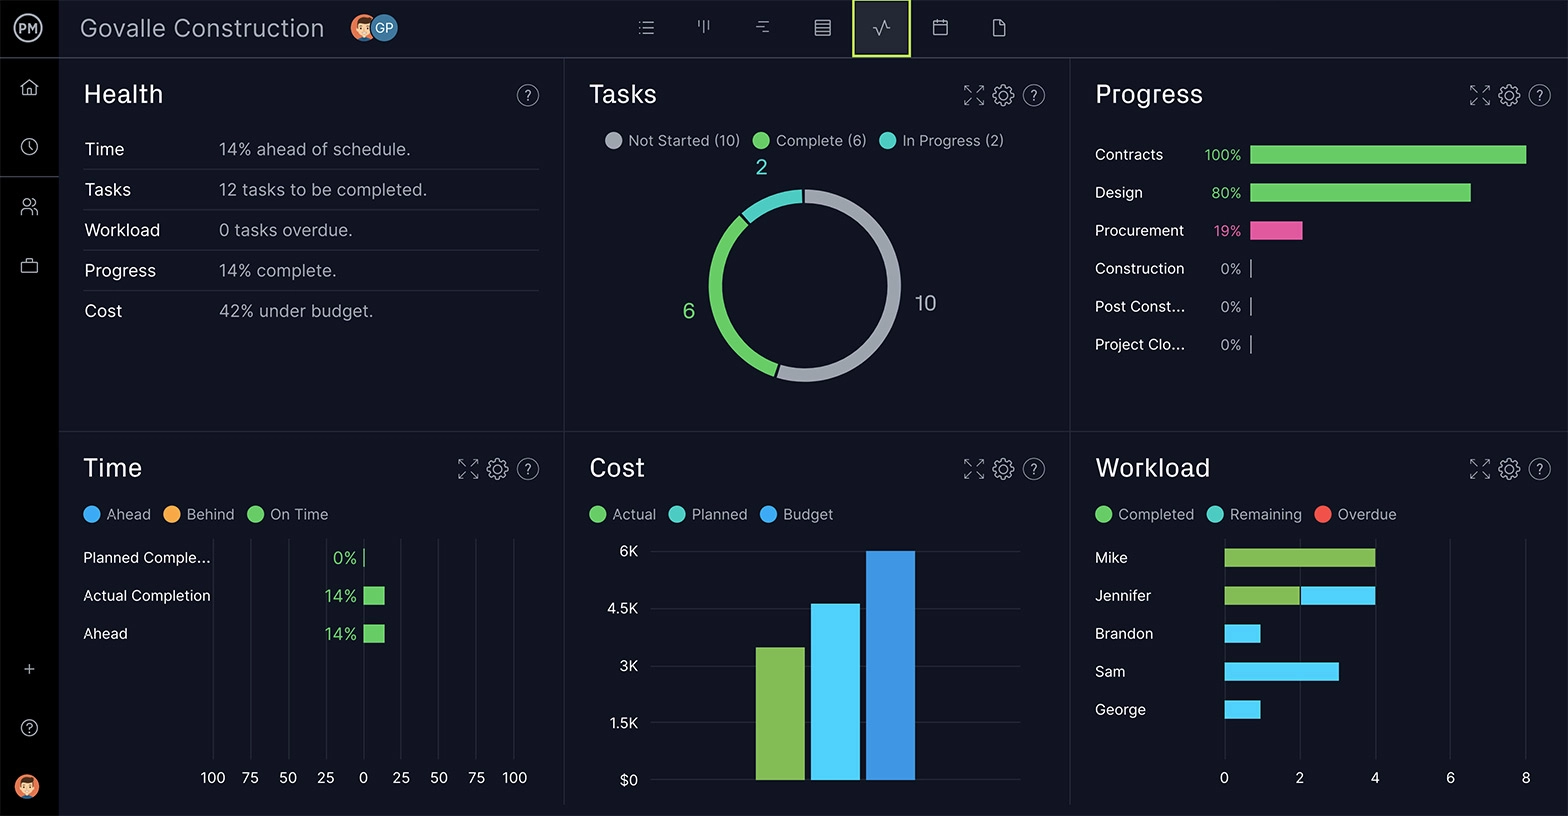
1. Project Dashboard Template
Just as the dashboard on your car helps you track speed, mileage, gas consumption and more, our free project dashboard template is a window into the progress and performance of your project. It’s made up of a variety of graphs, such as a pie graph that shows how your team is progressing on their tasks to bar charts on workload, task lengths and project costs.
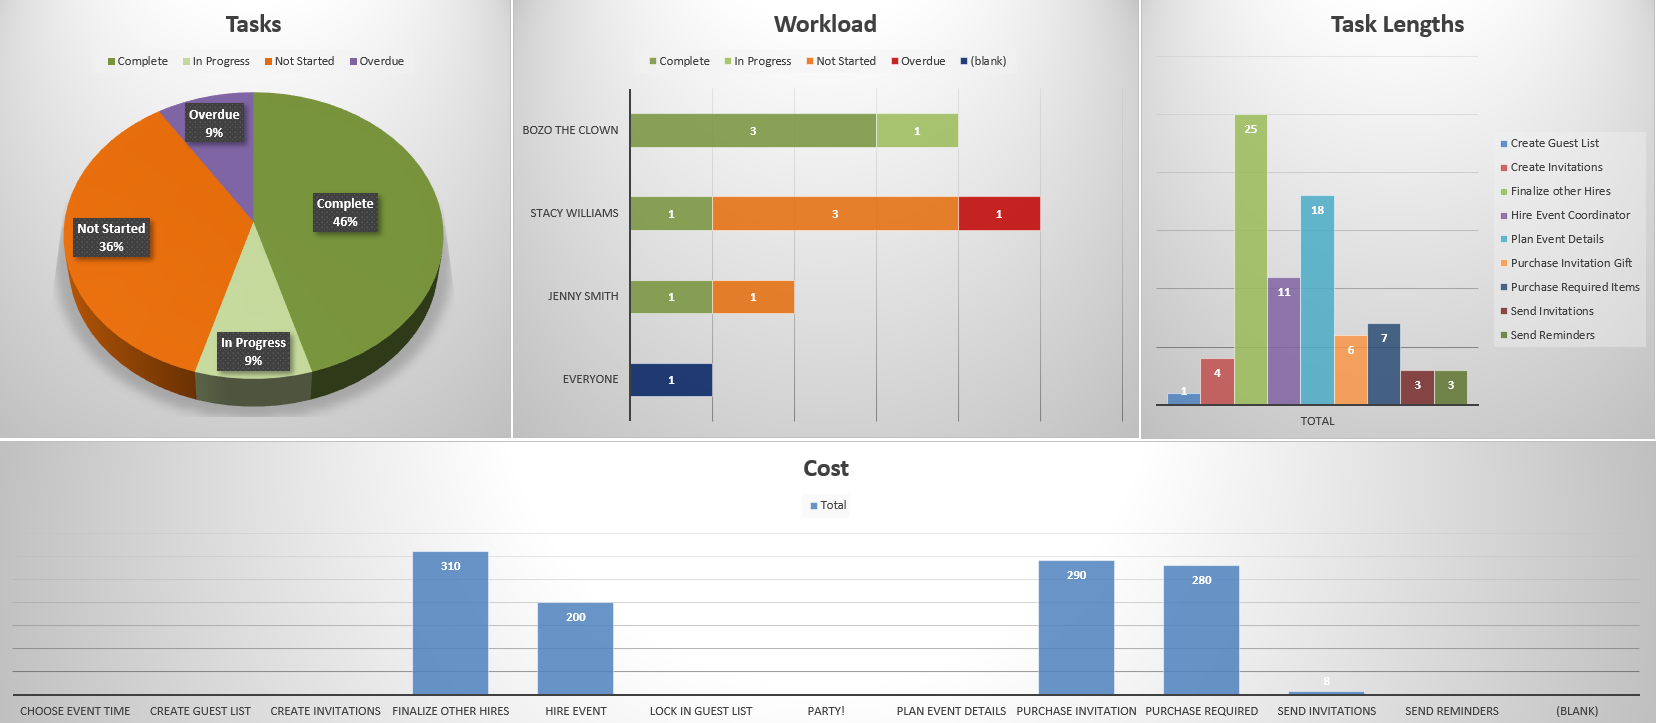
The free project dashboard template is a high-level view of your project. It gives project managers a glimpse into what’s going on in the project so they can make better decisions. This Excel report template makes for a great communicative tool. Numbers can end up floating around on the page if math isn’t your strong suit, but the visual elements of the free project dashboard template create a quick and easily digestible way to deliver project data to stakeholders.
ProjectManager software delivers more than any template. ProjectManager is online software that isn’t static like a template but instead connects to your project plan, schedule, resources and more. Our real-time dashboard receives live data as teams update their status so you’re always seeing current and accurate project information. There’s no data to input and it’s all done automatically. Get started with ProjectManager today for free.
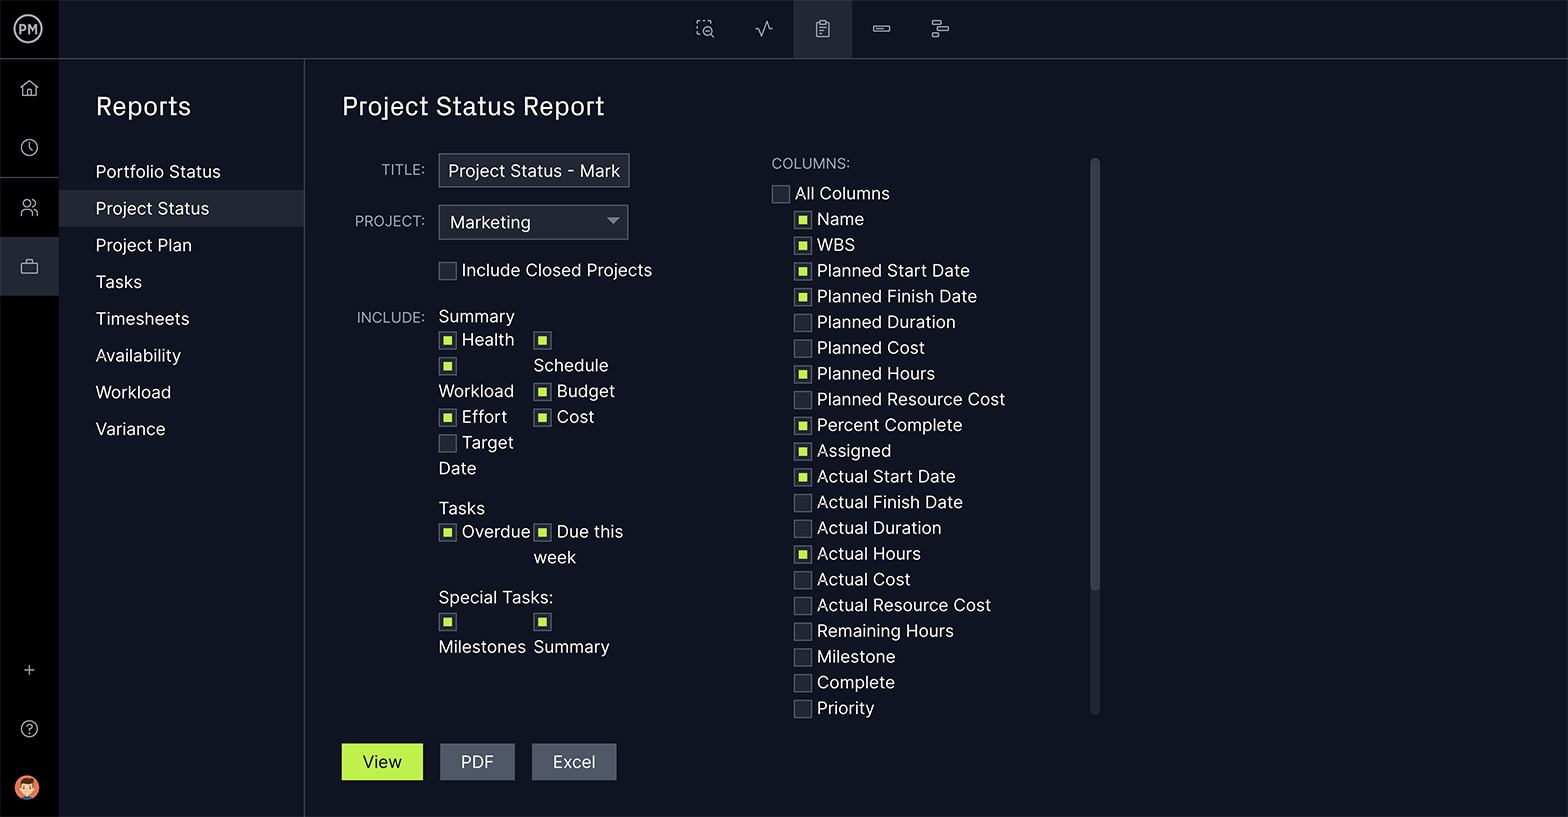
2. Project Status Report Template
Being able to get a snapshot of your project that shows its current state is critical for proper management. Our free project status report template lets you see the health of your project and how it’s progressing against your project plan. It can be used to communicate with stakeholders who prefer a more general synopsis of how the project is doing.
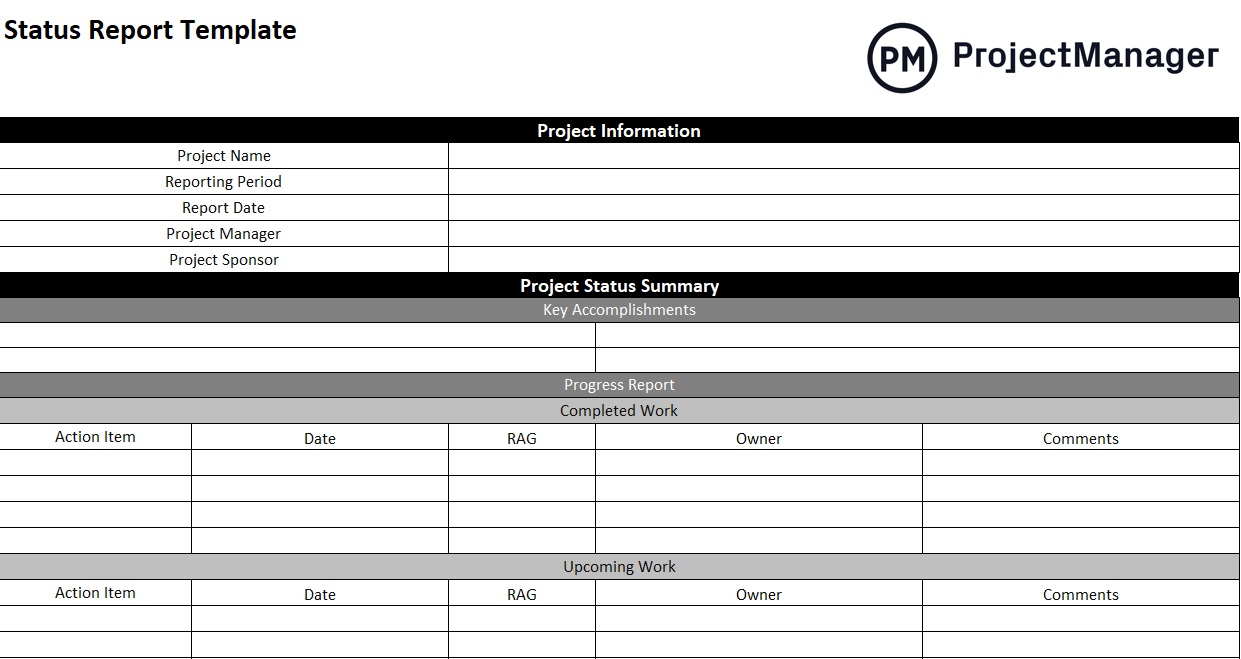
This Excel report template is still a wealth of important information, from a summary to project health to risks and recommendations. That includes key accomplishments, what work is completed, what’s still ahead, milestones that have been reached and deliverables. There’s also a place for action items, overviews of the budget, schedule, quality and scope, and even roadblocks that need to be addressed.
3. Progress Report Template
Knowing the progress of your project is one of the best ways to make sure you’re meeting scheduled milestones. Our free progress report template is a way to record the movement of your project over a specific period of time. That timeframe can be a week, a month or whatever is appropriate for your project Our free Excel report template captures the data.
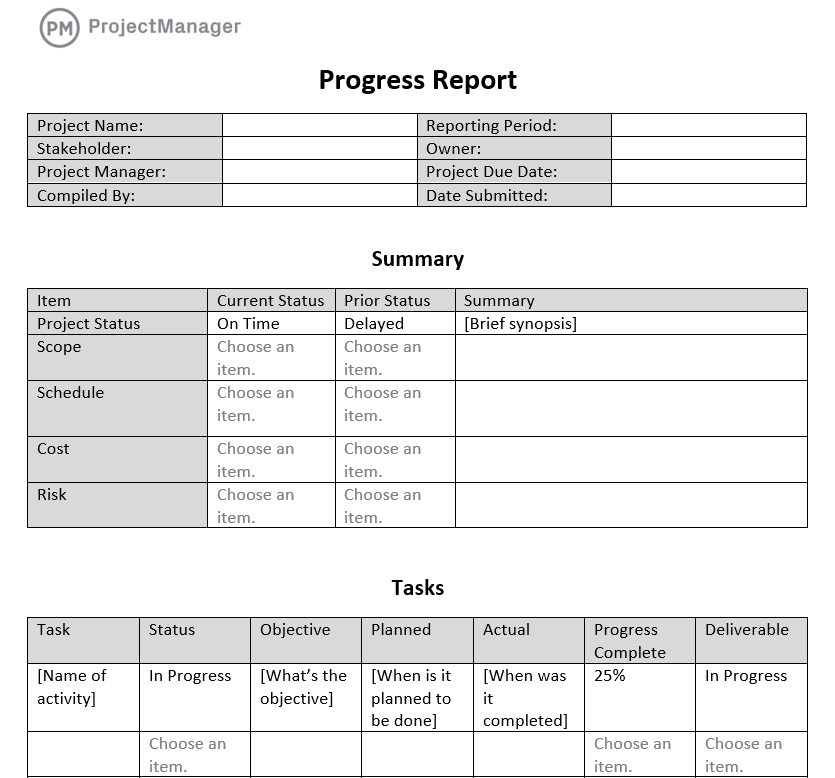
The Excel report template provides a summary of the project status, scope, schedule, cost and risk and then goes into more detail about all the tasks executed over the timeframe. It also looks at any issues that came up over this time period and how they impacted the budget. It then notes any existing or expected accomplishments.
4. Project Task Tracking Template
Keeping a project on schedule is one of the main responsibilities of a project manager. One way to accomplish this goal is with our free project task tracking template. It’s a tool that allows you to create a task list and use that to make sure each task in your project is on track to make its deadline. If not, you can reallocate resources to get it back on schedule.
![]()
The Excel report template is set up to capture the task and a brief description. It outlines if it’s a dependent task and who it’s assigned to. There are also pulldown menus to note the priority, start date, planned end date and actual end date for each task. There’s a status column to note if the tasks are opened or closed and a space to add other details not collected already.
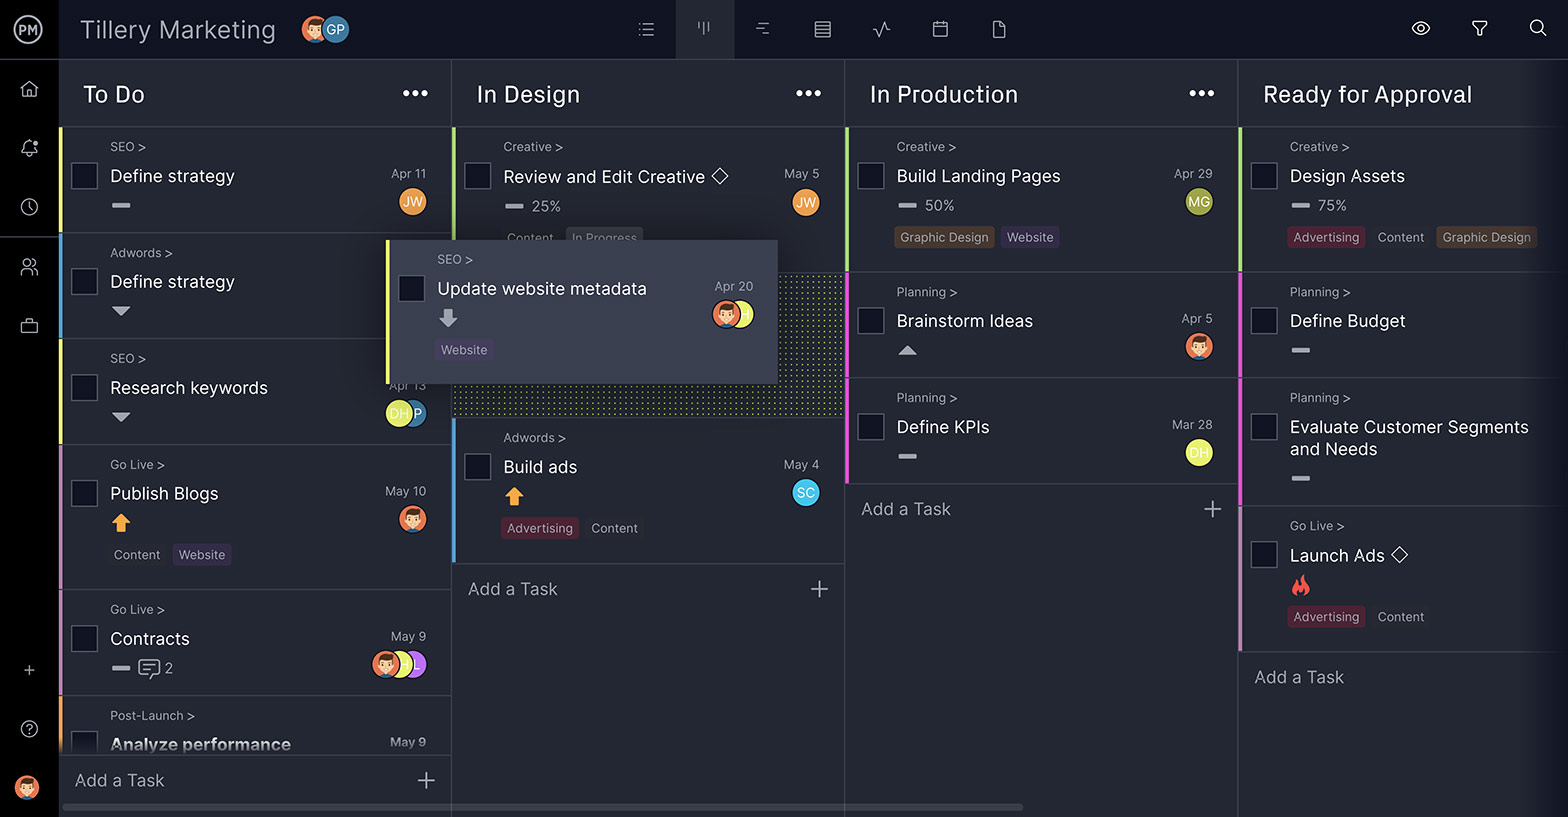
Of course, tracking tasks is even easier in project management software like ProjectManager. You can create subtasks, assign work, filter for tags and update progress in real time. Managing tasks in the kanban board lets you visually monitor a task’s lifecycle and eliminate bottlenecks to keep work moving.
5. Cost Benefit Analysis Template
This Excel report template is a bit different. You use a cost-benefit analysis template to see if the project is viable and worth funding. There are always questions to answer before initiating a project, such as whether will meet a need, provide a service and whether you can deliver on deadline and for a reasonable cost.
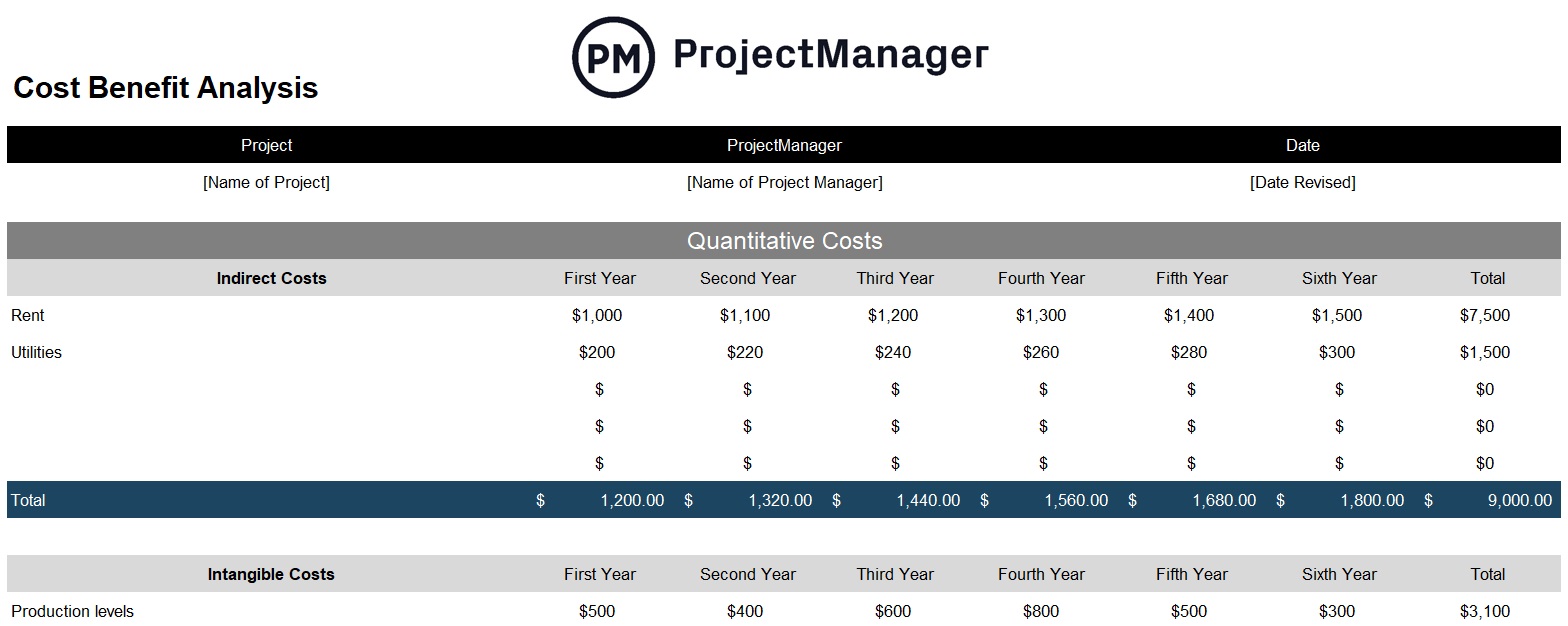
The cost-benefit analysis is a way to answer those questions before investing and risking the financial solvency of the organization. It lets you examine the numbers and make a knowledgeable decision about whether to go through with the project or not. This might be one of the most important Excel report templates you’ll use and it should always be part of your research.
6. Gap Analysis Template
Whether you’re managing a project or an organization, you’re always on the lookout for ways to innovate and be more efficient and effective in meeting your long-term goals. A gap analysis template is a tool that helps conduct a strategic analysis of when you are, where you want to be and, most importantly, how to get there.
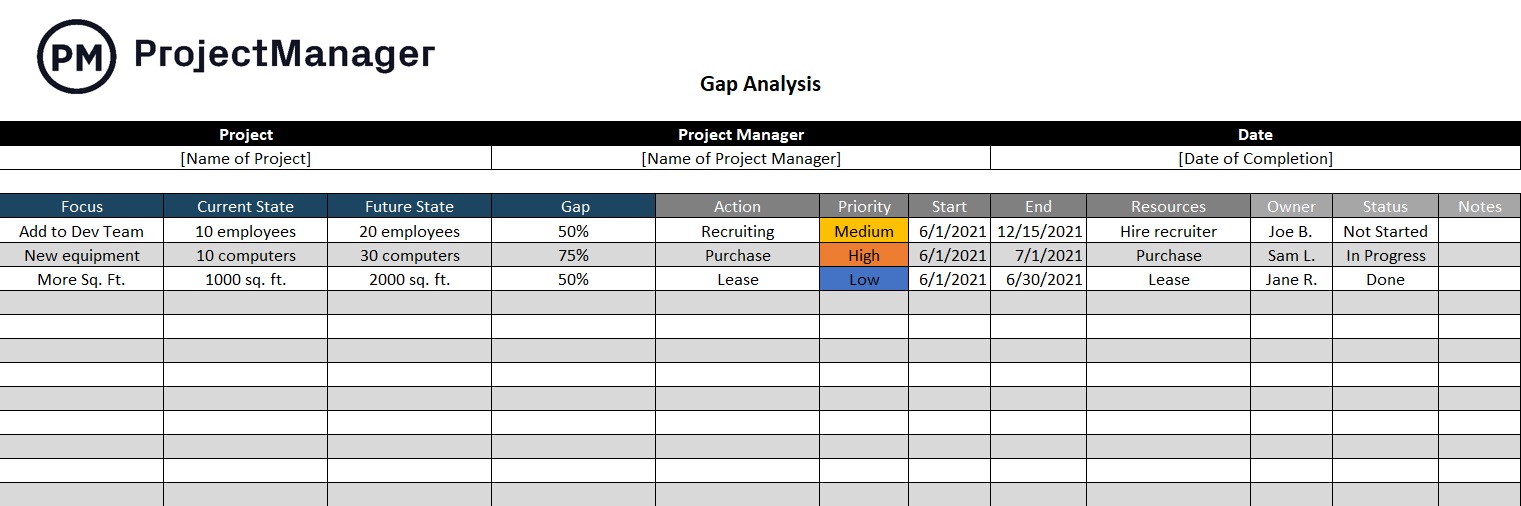
Using this Excel report template is the first step to making an action plan that can help you close the gap you’ve found in your analysis. It helps you see the path to achieving those strategic long-term goals that help you grow and stay competitive. Like many Excel report templates, it also acts as a communication tool for stakeholders and employees, providing a lodestar to follow.
7. Lessons Learned Template
After you’ve delivered a project, it’s important to learn from it. What worked? What didn’t work? You can then take that knowledge and apply it to future projects to manage them better. One of the most important Excel report templates you can use is this free lessons learned template.
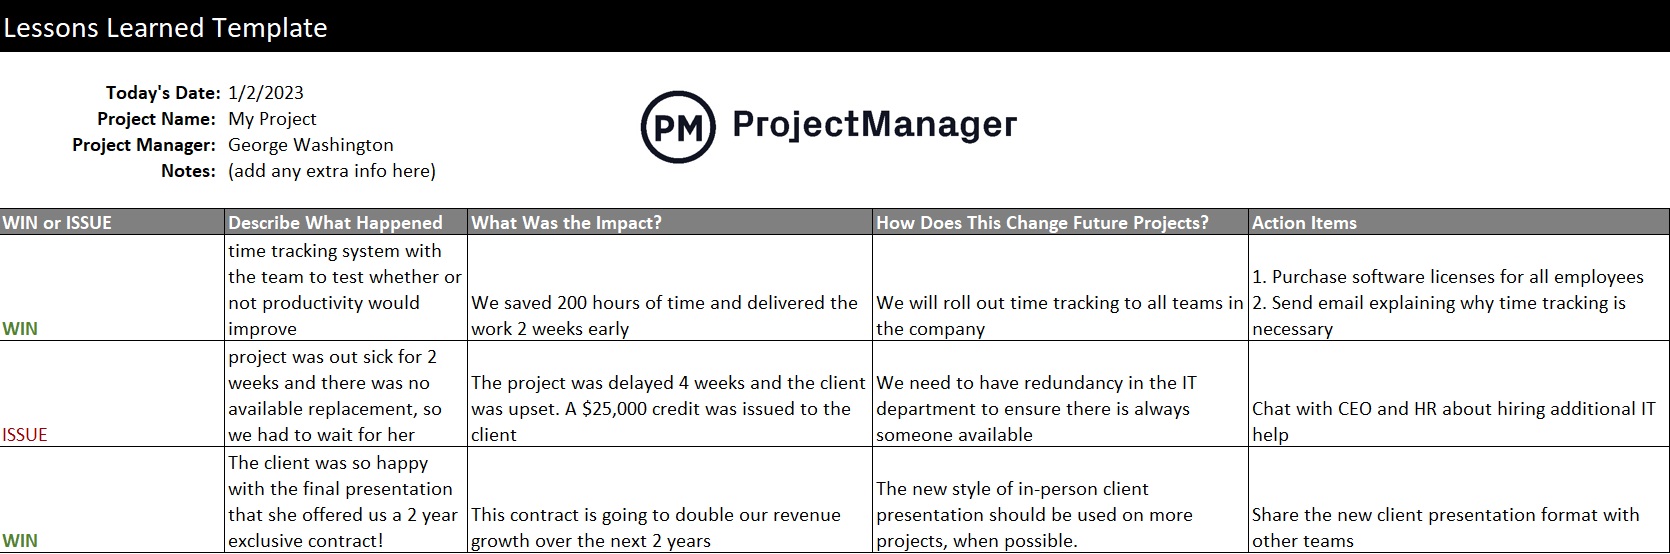
The lessons learned template creates a space in which you can capture all the information you need from what is a win or a loss, describing what happened, the impact, how to change things to improve and then a list of action items to implement those changes. Use this Excel report template when doing a post-mortem with the project team. Get their feedback as they were on the front lines of the project and can offer a unique perspective.
8. Timesheet Template
Another Excel report template is our free timesheet template. It’s a tool that not only helps with payroll but allows project managers to track the time each team member is spending on their tasks. You can track cost per hour, vacation and overtime to help stay on schedule.
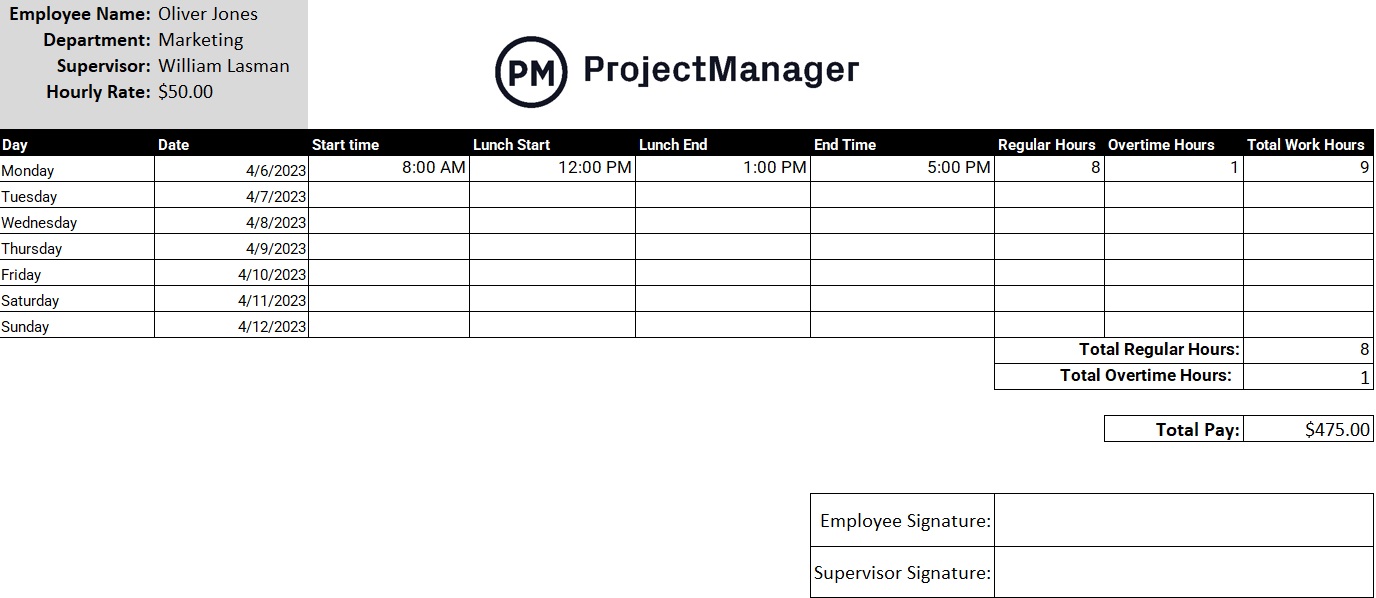
This free Excel report template captures the personal data of each team member, including the department in which they work, their supervisor and their hourly rate. Their weekly hours are then collected and totaled to show you how much time they put in and what tasks they’ve completed or are still working on. Finally, there’s a signature line for the employee and supervisor.
9. Risk Register Template
All projects have risks associated with them. We think of risks as bad, but some risks are good in that they open up an unforeseen opportunity. Our free risk register template helps you plan for risks, set priorities and outline who on the team is responsible for following through.
![]()
This free Excel report template is important in helping you identify and respond quickly to any issues that show up in the project. You can’t know every risk that might show up, but with the help of your team’s experience, you can outline a majority of the likely risks and have a plan in place to effectively mitigate risks or take advantage of them.
10. Change Log Template
Having a change log template is key to any change management process. Project plans are important but they’re not etched in stone. When changes occur in your project, whether external or internal, you need to have this free Excel report template to capture that change and track it throughout the project or until it’s resolved.
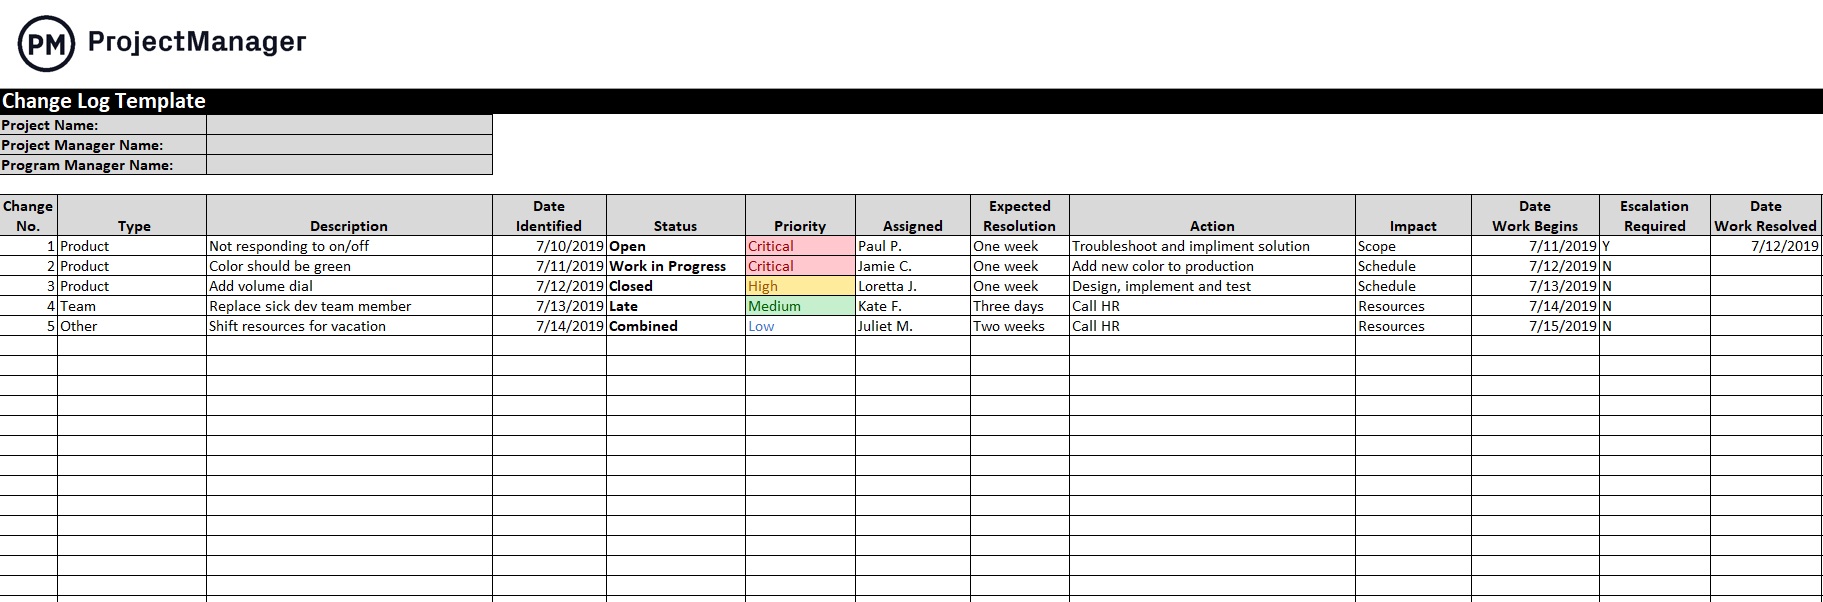
The free change log template has a place for everything you need to identify and track changes in your project, such as when it was first discovered and who discovered it. The more data around the change, the more you can control it and make sure it doesn’t derail your project.
How ProjectManager Makes Reporting More Robust
These Excel report templates are a good start, but if you want to cross that project finish line on time and without accruing extra costs, then you need project management software. ProjectManager is online project management software that automates reporting and delivers real-time data for more accuracy and better decision-making.
Use Real-Time Dashboards
The dashboard template only gives you a taste of what a dashboard can do. Our real-time dashboard automatically captures live data. You don’t have to manually input it. It also does the calculations for you and then displays the results in easy-to-read graphs and charts. This high-level view is constantly updating so it’s like a high-level status report that’s always at your fingertips. While other project management tools have dashboards, often you have to set them up. That wastes time. Our dashboard is ready to go when you are.

Get Customizable Reports
All of the Excel report templates we’ve featured for free download are static documents. Our reports can be generated quickly and each can be filtered to show only the data you want to see or share with stakeholders. There are reports on portfolio status, project status, project plan, task, timesheets, availability, workload and various others to help you see in real time how the project is progressing and performing. Excel report templates don’t take the complex data from your project and turn it into helpful and digestible information, but our software does.
The dashboard and reports are all collecting data from the many features that make our software unique in the project management space. We have robust Gantt charts that schedule tasks, resources and costs. Our kanban boards help to visualize your workflow while the sheet, list and calendar views are all designed to help you work how you want. Our collaborative platform connects everyone on your team, different departments and even outside enterprises so your reports can be shared with those who need to see them.
ProjectManager is award-winning project management software that creates efficiencies by connecting everyone in real time. With features to plan, monitor and report on projects, and manage resources and risks, we have the one tool for all your project management needs. Join teams from NASA, Siemens and Nestle, among other organizations, delivering success. Get started with ProjectManager today for free.