
Often you may be interested in plotting an equation or a function in Excel. Fortunately this is easy to do with built-in Excel formulas.
This tutorial provides several examples of how to plot equations/functions in Excel.
Example 1: Plot a Linear Equation
Suppose you’d like to plot the following equation:
y = 2x + 5
The following image shows how to create the y-values for this linear equation in Excel, using the range of 1 to 10 for the x-values:

Next, highlight the values in the range A2:B11. Then click on the Insert tab. Within the Charts group, click on the plot option called Scatter.

The following plot will automatically appear:

We can see that the plot follows a straight line since the equation that we used was linear in nature.
Example 2: Plot a Quadratic Equation
Suppose you’d like to plot the following equation:
y = 3x2
The following image shows how to create the y-values for this equation in Excel, using the range of 1 to 10 for the x-values:

Next, highlight the values in the range A2:B11. Then click on the Insert tab. Within the Charts group, click on the plot option called Scatter.
The following plot will automatically appear:

We can see that the plot follows a curved line since the equation that we used was quadratic.
Example 3: Plot a Reciprocal Equation
Suppose you’d like to plot the following equation:
y = 1/x
The following image shows how to create the y-values for this equation in Excel, using the range of 1 to 10 for the x-values:

Next, highlight the values in the range A2:B11. Then click on the Insert tab. Within the Charts group, click on the plot option called Scatter.
The following plot will automatically appear:

We can see that the plot follows a curved line downwards since this represents the equation y = 1/x.
Example 4: Plot a Sine Equation
Suppose you’d like to plot the following equation:
y = sin(x)
The following image shows how to create the y-values for this equation in Excel, using the range of 1 to 10 for the x-values:

Next, highlight the values in the range A2:B11. Then click on the Insert tab. Within the Charts group, click on the plot option called Scatter with Smooth Lines and Markers.
The following plot will automatically appear:

Conclusion
You can use a similar technique to plot any function or equation in Excel. Simply choose a range of x-values to use in one column, then use an equation in a separate column to define the y-values based on the x-values.
Return to Charts Home
This tutorial will demonstrate how to graph a Function in Excel & Google Sheets.
How to Graph an Equation / Function in Excel
Set up your Table
- Create the Function that you want to graph
- Under the X Column, create a range. In this example, we’re range from -5 to 5
Fill in Y Column
Create a formula using the Function, substituting x with what is in Column B.
After using this formula for all the rows, you should have a table that looks like below.
Creating Scatterplot
- Highlight Dataset
- Select Insert
- Select Scatterplot
- Select Scatter with Smooth Lines
This will create a graph that should look similar to below.
Add Equation Formula to Graph
- Click Graph
- Select Chart Design
- Click Add Chart Element
- Click Trendline
- Select More Trendline Options
6. Select Polynomial
7. Check Display Equation on Chart
Final Scatterplot with Equation
Your final equation on the graph should match the function that you began with.
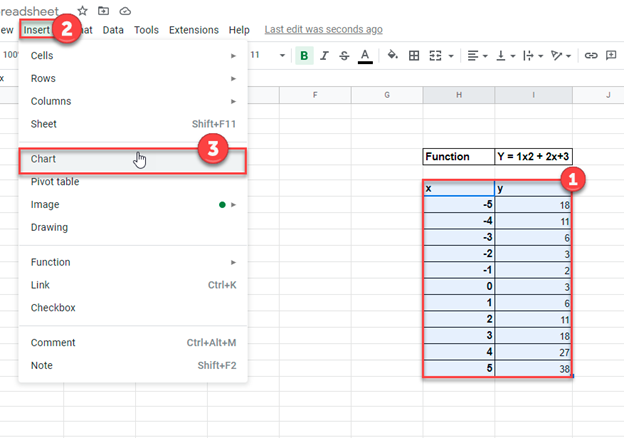
How to Graph an Equation / Function in Google Sheets
Creating a Scatterplot
- Using the same table that we made as explained above, highlight the table
- Click Insert
- Select Chart
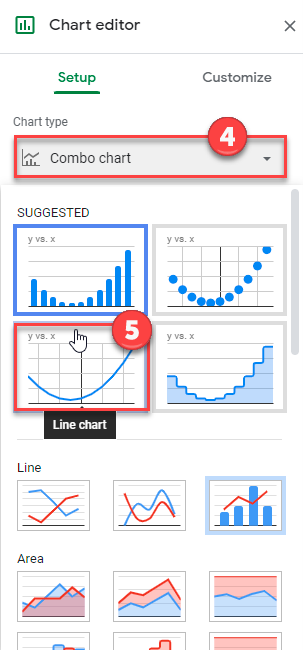
4. Click on the dropdown under Chart Type
5. Select Line Chart
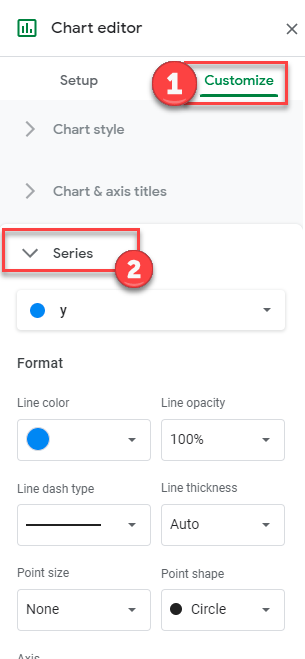
Adding Equation
- Click on Customize
- Select Series
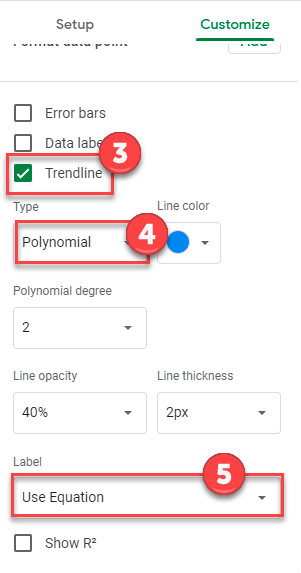
3. Check Trendline
4. Under Type, Select Polynomial
5. Under Label, Select Use Equation
Final Scatterplot with Equation
As you can see, similar to the exercise in Excel, the equation matches the function that we began with.
Содержание
- How to Graph a Linear Equation using Excel?
- Graph a linear equation using Excel
- How To Show Equation In Excel Graph?
- How do you find an equation from a graph?
- How do you find R and R2 in Excel?
- How do you find the equation of a line?
- How do you display an equation on a scatter plot in Excel?
- How do you show equations in Excel for Mac?
- What is Y MX B?
- What is R2 in Excel graph?
- How do you find the equation of a straight line graph?
- How do you add an equation to a scatter plot?
- How do you graph y MX B in Excel?
- How do you find M and B on a graph?
- What does M and B stand for in math?
- How do you find r 2?
- How to add equation to graph – Excelchat
- Tabulate Data
- Instant Connection to an Expert through our Excelchat Service
- How to Graph an Equation / Function – Excel & Google Sheets
- How to Graph an Equation / Function in Excel
- Set up your Table
- Fill in Y Column
- Creating Scatterplot
- Add Equation Formula to Graph
- Final Scatterplot with Equation
- How to Graph an Equation / Function in Google Sheets
- Creating a Scatterplot
- Adding Equation
- Final Scatterplot with Equation
- How to Plot an Equation in Excel
- Example 1: Plot a Linear Equation
- Example 2: Plot a Quadratic Equation
- Example 3: Plot a Reciprocal Equation
- Example 4: Plot a Sine Equation
- Conclusion
How to Graph a Linear Equation using Excel?
The equation having the highest degree is 1 is known as a linear equation. If we plot the graph for a linear equation, it always comes out to be a straight line. There are different forms of linear equations such as linear equations in one variable, and linear equations in two variables.
- Linear equations in one variable: standard form of this equation is ‘ax + b = 0’, where a and b are real numbers and x is a variable.
- Linear equation in two variables: standard form or this equation is, ‘ax + by = c’, where a, b and c are real numbers, and x is a variable.
Graph a linear equation using Excel
Graph of Linear equation (one variable)
In only one variable, the value of only one variable is needed to be found. Therefore, the equation can be solved directly. Let’s take one linear equation in one variable i.e 2x + 3 = 9.
Step 1: Solve the linear equation
Step 2: Plot the graph
For a linear equation in one variable, the graph will always have a line parallel to any axis.
For x = 3, the graph will be a line parallel to the y-axis which intersects the x-axis at 3, because for any value of y, the value of x is 3. Below table data can be used to plot the graph,

Co-ordinates taken is (3, 0), (3, 5), (3, 10), (3, 15), (3, -5), (3, -10), (3, -15).
Plot the graph using the following steps
Step 1: Select the data

Step 2: Click on the ‘Insert’ tab and select scatter with marker chart.

Output

Graph of Linear equation (two variables)
Let’s take one linear equation in one variable i.e 2x + 3y = 6. In order to get the data points for plotting the graph, assume some value of x and find the corresponding y value.
For example, If x = 0
Substitute value of x in given equation,
Then, the data point is (0, 2). Similarly, we can get different coordinates, those are (3, 0), (-3, 4), and (6, -2).

Plot the graph using the following steps
Step 1: Select the data

Step 2: Click on the ‘Insert’ tab and select scatter with marker chart.
Источник
How To Show Equation In Excel Graph?
To show the equation, click on “Trendline” and select “More Trendline Options…” Then check the “Display Equation on chart” box.
How do you find an equation from a graph?
To find the equation of a graphed line, find the y-intercept and the slope in order to write the equation in y-intercept (y=mx+b) form. Slope is the change in y over the change in x. Find two points on the line and draw a slope triangle connecting the two points.
How do you find R and R2 in Excel?
There are two methods to find the R squared value: Calculate for r using CORREL, then square the value.
Enter the following formulas into our worksheets:
- In cell G3, enter the formula =CORREL(B3:B7,C3:C7)
- In cell G4, enter the formula =G3^2.
- In cell G5, enter the formula =RSQ(C3:C7,B3:B7)
How do you find the equation of a line?
How to Find the Equation of a Line from Two Points
- Find the slope using the slope formula.
- Use the slope and one of the points to solve for the y-intercept (b).
- Once you know the value for m and the value for b, you can plug these into the slope-intercept form of a line (y = mx + b) to get the equation for the line.
How do you display an equation on a scatter plot in Excel?
To show the equation, click on “Trendline” and select “More Trendline Options…” Then check the “Display Equation on chart” box.
How do you show equations in Excel for Mac?
Right click (two finger click with a trackpad) the trendline and select Format Trendline. When the box shown below appears, select Display Equation on chart and Display R-squared value on chart. Now you’re all done!
What is Y MX B?
y = mx + b is the slope intercept form of writing the equation of a straight line. In the equation ‘y = mx + b’, ‘b’ is the point, where the line intersects the ‘y axis’ and ‘m’ denotes the slope of the line. The slope or gradient of a line describes how steep a line is.
What is R2 in Excel graph?
What is r squared in excel? The R-Squired of a data set tells how well a data fits the regression line. It is used to tell the goodness of fit of data point on regression line. It is the squared value of correlation coefficient. It is also called co-efficient of determination.
How do you find the equation of a straight line graph?
The general equation of a straight line is y = mx + c, where m is the gradient, and y = c is the value where the line cuts the y-axis. This number c is called the intercept on the y-axis. The equation of a straight line with gradient m and intercept c on the y-axis is y = mx + c.
How do you add an equation to a scatter plot?
Add a linear regression line to the scatter chart by clicking the “Layout” tab, selecting the “Trendline” drop-down box and clicking “Trendline Options.” Select the “Linear” option and click the “Display Equation on Chart” box. Excel displays the linear equation on the chart in the y=mx+b format.
How do you graph y MX B in Excel?
To draw a straight line thru the data, right click on a data point, and select “Add Trendline”. Select Linear regression. If the plot is to go thru the origin, check the “Set Intercept” box, and enter 0 in the box. To show the equation of the line (y=mx +b), check the “Show Equation” box.
How do you find M and B on a graph?
In the equation y = mx + b for a straight line, the number m is called the slope of the line. Let x = 0, then y = m • 0 + b, so y = b. The number b is the coordinate on the y-axis where the graph crosses the y-axis.
What does M and B stand for in math?
m is the slope of the line (change in y/change in x) and b is the y intercept of the line (where the line crosses the y axis).
How do you find r 2?
To calculate R2 you need to find the sum of the residuals squared and the total sum of squares. Start off by finding the residuals, which is the distance from regression line to each data point. Work out the predicted y value by plugging in the corresponding x value into the regression line equation.
Источник
How to add equation to graph – Excelchat
We can add an equation to a graph in excel by using the excel equation of a line . Graph equations in excel are easy to plot and this tutorial will walk all levels of excel users through the process of showing line equation and adding it to a graph .
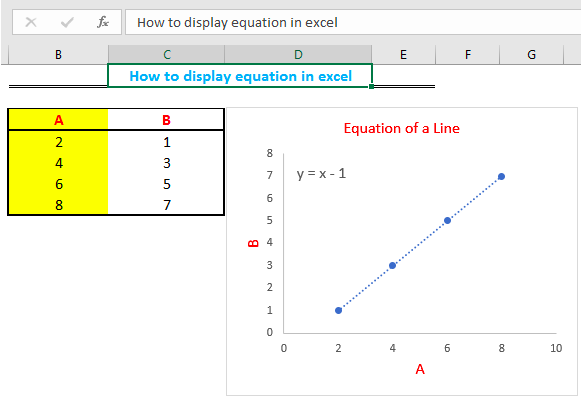 Figure 1: Graph equation
Tabulate Data
- We will tabulate our data in two columns.
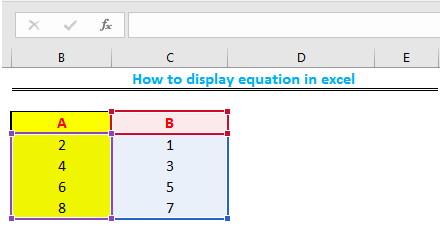 Figure 2: Table of Data
- We will then highlight our entire table and click on “insert ”, then we will then select the “scatter chart” icon to display a graph
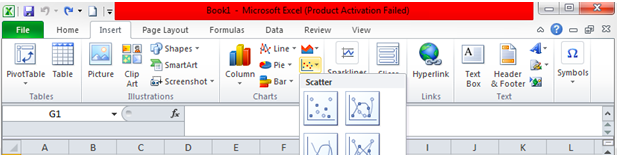 Figure 3 – Scatter chart
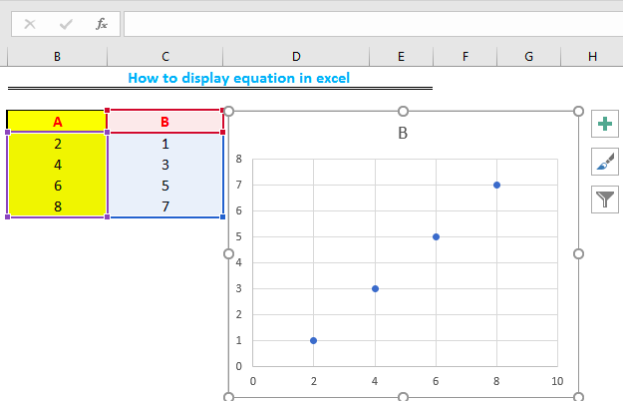 Figure 4: Graphical Representation of Data
- We will now click on the “+” icon beside the chart to edit our graph by including the Chart Title and Axes. We will also remove the gridlines.
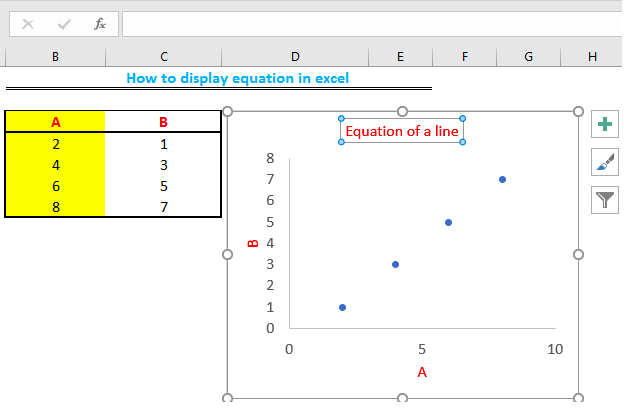 Figure 5: Edited Graph Parameters
- We will now add the equation of the chart by right clicking on any of the point on the chart, select “add trendline” , then scroll down and finally select “Display Equation on Chart” .
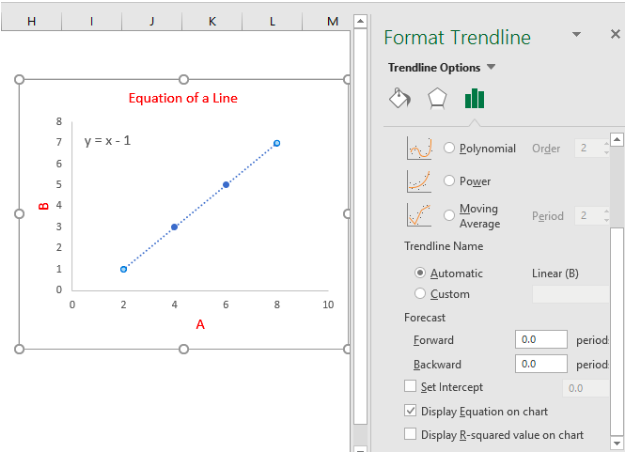 Figure 6: Equation of a line
Instant Connection to an Expert through our Excelchat Service
Most of the time, the problem you will need to solve will be more complex than a simple application of a formula or function. If you want to save hours of research and frustration, try our live Excelchat service! Our Excel Experts are available 24/7 to answer any Excel question you may have. We guarantee a connection within 30 seconds and a customized solution within 20 minutes.
Источник
How to Graph an Equation / Function – Excel & Google Sheets
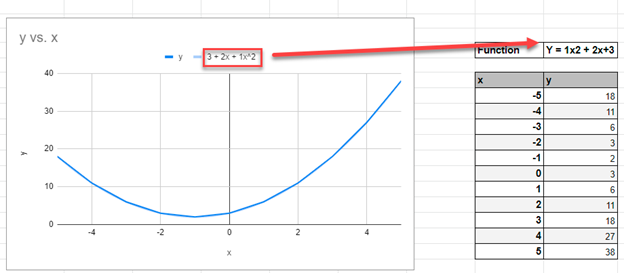
This tutorial will demonstrate how to graph a Function in Excel & Google Sheets.
How to Graph an Equation / Function in Excel
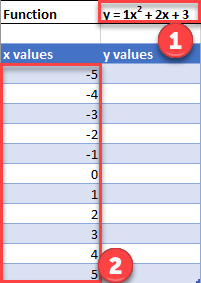
Set up your Table
- Create the Function that you want to graph
- Under the X Column, create a range. In this example, we’re range from -5 to 5
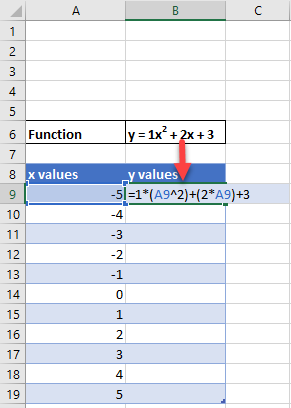
Fill in Y Column
Create a formula using the Function, substituting x with what is in Column B.
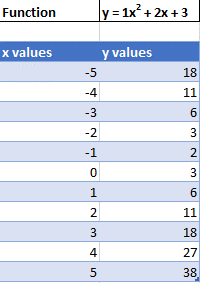
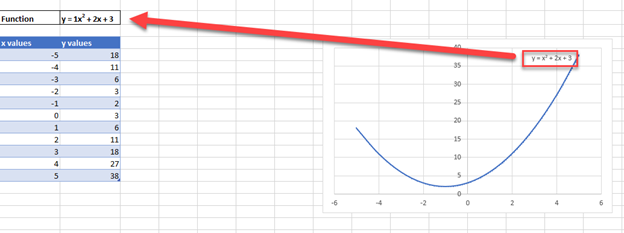
After using this formula for all the rows, you should have a table that looks like below.
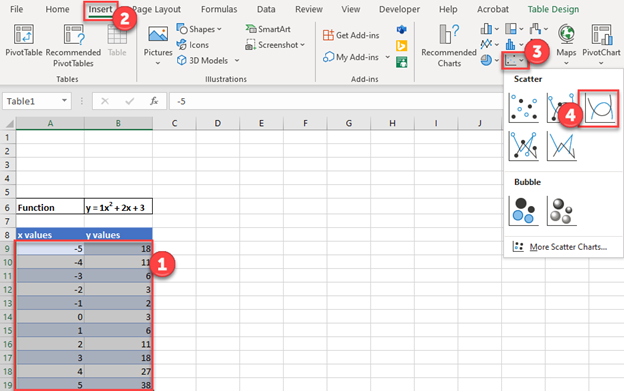
Creating Scatterplot
- Highlight Dataset
- Select Insert
- Select Scatterplot
- Select Scatter with Smooth Lines
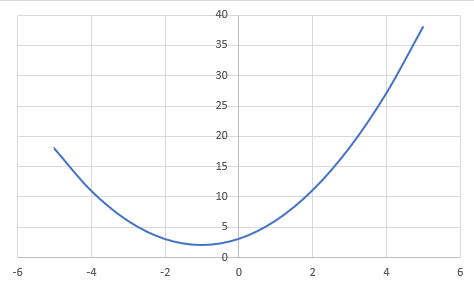
This will create a graph that should look similar to below.
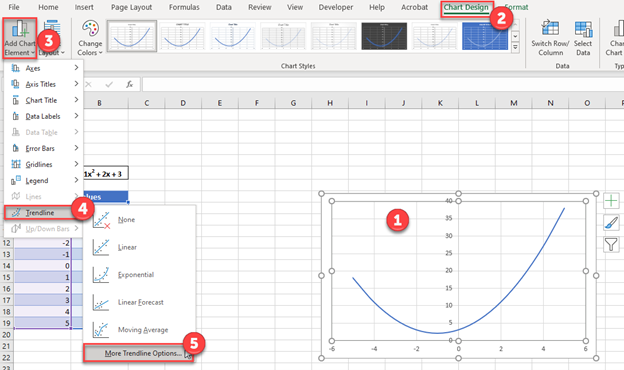
Add Equation Formula to Graph
- Click Graph
- Select Chart Design
- Click Add Chart Element
- Click Trendline
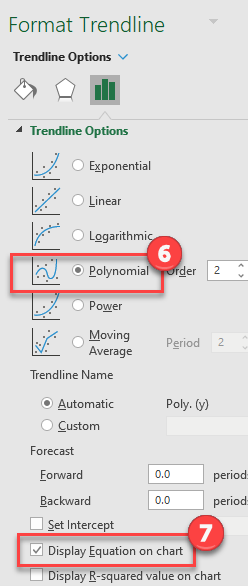
- Select More Trendline Options
6. Select Polynomial
7. Check Display Equation on Chart
Final Scatterplot with Equation
Your final equation on the graph should match the function that you began with.
How to Graph an Equation / Function in Google Sheets
Creating a Scatterplot
- Using the same table that we made as explained above, highlight the table
- Click Insert
- Select Chart
4. Click on the dropdown under Chart Type
5. Select Line Chart
Adding Equation
- Click on Customize
- Select Series
3. Check Trendline
4. Under Type, Select Polynomial
5. Under Label, Select Use Equation
Final Scatterplot with Equation
As you can see, similar to the exercise in Excel, the equation matches the function that we began with.
Источник
How to Plot an Equation in Excel
Often you may be interested in plotting an equation or a function in Excel. Fortunately this is easy to do with built-in Excel formulas.
This tutorial provides several examples of how to plot equations/functions in Excel.
Example 1: Plot a Linear Equation
Suppose you’d like to plot the following equation:
y = 2x + 5
The following image shows how to create the y-values for this linear equation in Excel, using the range of 1 to 10 for the x-values:
Next, highlight the values in the range A2:B11. Then click on the Insert tab. Within the Charts group, click on the plot option called Scatter.
The following plot will automatically appear:
We can see that the plot follows a straight line since the equation that we used was linear in nature.
Example 2: Plot a Quadratic Equation
Suppose you’d like to plot the following equation:
y = 3x 2
The following image shows how to create the y-values for this equation in Excel, using the range of 1 to 10 for the x-values:
Next, highlight the values in the range A2:B11. Then click on the Insert tab. Within the Charts group, click on the plot option called Scatter.
The following plot will automatically appear:
We can see that the plot follows a curved line since the equation that we used was quadratic.
Example 3: Plot a Reciprocal Equation
Suppose you’d like to plot the following equation:
y = 1/x
The following image shows how to create the y-values for this equation in Excel, using the range of 1 to 10 for the x-values:
Next, highlight the values in the range A2:B11. Then click on the Insert tab. Within the Charts group, click on the plot option called Scatter.
The following plot will automatically appear:
We can see that the plot follows a curved line downwards since this represents the equation y = 1/x.
Example 4: Plot a Sine Equation
Suppose you’d like to plot the following equation:
y = sin(x)
The following image shows how to create the y-values for this equation in Excel, using the range of 1 to 10 for the x-values:
Next, highlight the values in the range A2:B11. Then click on the Insert tab. Within the Charts group, click on the plot option called Scatter with Smooth Lines and Markers.
The following plot will automatically appear:
Conclusion
You can use a similar technique to plot any function or equation in Excel. Simply choose a range of x-values to use in one column, then use an equation in a separate column to define the y-values based on the x-values.
Источник
Contents
- 1 How do you plot an equation?
- 2 Can I plot a function in Excel?
- 3 How do I graph an equation in Excel 2016?
- 4 Is an equation a formula?
- 5 How do you find the equation of a line?
- 6 What is graph of quadratic equation?
- 7 What is Y MX B?
- 8 What are formulas in Excel?
- 9 What is an example of a equation?
- 10 How do you find the equation of a line that has the given slope and passes through the given point?
- 11 Can Excel solve a quadratic equation?
- 12 Can Excel solve equations?
- 13 How do you solve for a variable in an equation in Excel?
To graph an equation using the slope and y-intercept, 1) Write the equation in the form y = mx + b to find the slope m and the y-intercept (0, b). 2) Next, plot the y-intercept. 3) From the y-intercept, move up or down and left or right, depending on whether the slope is positive or negative.
Can I plot a function in Excel?
A quick and easy way to plot y = f(x) functions in Excel available with the XLSTAT add-on statistical software. This tool allows you to plot a function of the type y = f (x) on an existing or new chart.
How do I graph an equation in Excel 2016?
On the Layout tab, in the Analysis group, click Trendline, and then click More Trendline Options. To display the trendline equation on the chart, select the Display Equation on chart check box.
Is an equation a formula?
An equation is any expression with an equals sign, so your example is by definition an equation. Equations appear frequently in mathematics because mathematicians love to use equal signs. A formula is a set of instructions for creating a desired result.
How do you find the equation of a line?
To find an equation of a line given the slope and a point.
- Identify the slope.
- Identify the point.
- Substitute the values into the point-slope form, y − y 1 = m ( x − x 1 ) .
- Write the equation in slope-intercept form.
What is graph of quadratic equation?
The graph of a quadratic function is a U-shaped curve called a parabola.The extreme point ( maximum or minimum ) of a parabola is called the vertex, and the axis of symmetry is a vertical line that passes through the vertex. The x-intercepts are the points at which the parabola crosses the x-axis.
What is Y MX B?
y = mx + b is the slope intercept form of writing the equation of a straight line. In the equation ‘y = mx + b’, ‘b’ is the point, where the line intersects the ‘y axis’ and ‘m’ denotes the slope of the line. The slope or gradient of a line describes how steep a line is.
What are formulas in Excel?
A formula is an equation that makes calculations based on the data in your spreadsheet. Formulas are entered into a cell in your worksheet. They must begin with an equal sign, followed by the addresses of the cells that will be calculated upon, with an appropriate operand placed in between.
What is an example of a equation?
An equation is a mathematical sentence that has two equal sides separated by an equal sign. 4 + 6 = 10 is an example of an equation. We can see on the left side of the equal sign, 4 + 6, and on the right hand side of the equal sign, 10.For example, 12 is the coefficient in the equation 12n = 24.
How do you find the equation of a line that has the given slope and passes through the given point?
These are the two methods to finding the equation of a line when given a point and the slope:
- Substitution method = plug in the slope and the (x, y) point values into y = mx + b, then solve for b.
- Point-slope form = y − y 1 = m ( x − x 1 ) , where ( x 1 , y 1 ) is the point given and m is the slope given.
Can Excel solve a quadratic equation?
A quadratic equation can be solved by using the quadratic formula. You can also use Excel’s Goal Seek feature to solve a quadratic equation.We can solve the quadratic equation 3x2 – 12x + 9.5 – 24.5 = 0 by using the quadratic formula.
Can Excel solve equations?
The Solver in Excel can perform many of the same functions as EES and MathCAD. It can be used to solve single equations (for example x2+3x-22=5) or multiple equations (for example x3-14x=z, z12-1=x2+1).
How do you solve for a variable in an equation in Excel?
How to Use Solver in Excel
- Click Data > Solver. You’ll see the Solver Parameters window below.
- Set your cell objective and tell Excel your goal.
- Choose the variable cells that Excel can change.
- Set constraints on multiple or individual variables.
- Once all of this information is in place, hit Solve to get your answer.
The equation having the highest degree is 1 is known as a linear equation. If we plot the graph for a linear equation, it always comes out to be a straight line. There are different forms of linear equations such as linear equations in one variable, and linear equations in two variables.
- Linear equations in one variable: standard form of this equation is ‘ax + b = 0’, where a and b are real numbers and x is a variable.
- Linear equation in two variables: standard form or this equation is, ‘ax + by = c’, where a, b and c are real numbers, and x is a variable.
Graph a linear equation using Excel
Graph of Linear equation (one variable)
In only one variable, the value of only one variable is needed to be found. Therefore, the equation can be solved directly. Let’s take one linear equation in one variable i.e 2x + 3 = 9.
Step 1: Solve the linear equation
2x + 3 = 9
2x = 9 – 3
2x = 6
x = 6/2
x = 3
Step 2: Plot the graph
For a linear equation in one variable, the graph will always have a line parallel to any axis.
For x = 3, the graph will be a line parallel to the y-axis which intersects the x-axis at 3, because for any value of y, the value of x is 3. Below table data can be used to plot the graph,
Co-ordinates taken is (3, 0), (3, 5), (3, 10), (3, 15), (3, -5), (3, -10), (3, -15).
Plot the graph using the following steps
Step 1: Select the data
Step 2: Click on the ‘Insert’ tab and select scatter with marker chart.
Output
Graph of Linear equation (two variables)
Let’s take one linear equation in one variable i.e 2x + 3y = 6. In order to get the data points for plotting the graph, assume some value of x and find the corresponding y value.
For example, If x = 0
Substitute value of x in given equation,
2(0) + 3y = 6
3y = 6
y = 2
Then, the data point is (0, 2). Similarly, we can get different coordinates, those are (3, 0), (-3, 4), and (6, -2).
Plot the graph using the following steps
Step 1: Select the data
Step 2: Click on the ‘Insert’ tab and select scatter with marker chart.

Output
