
How much time do you need to build something like this in Excel?
At least 20 minutes + a lot of lost nerves for the formatting. Unless you use VBA and you build it within some seconds 🙂
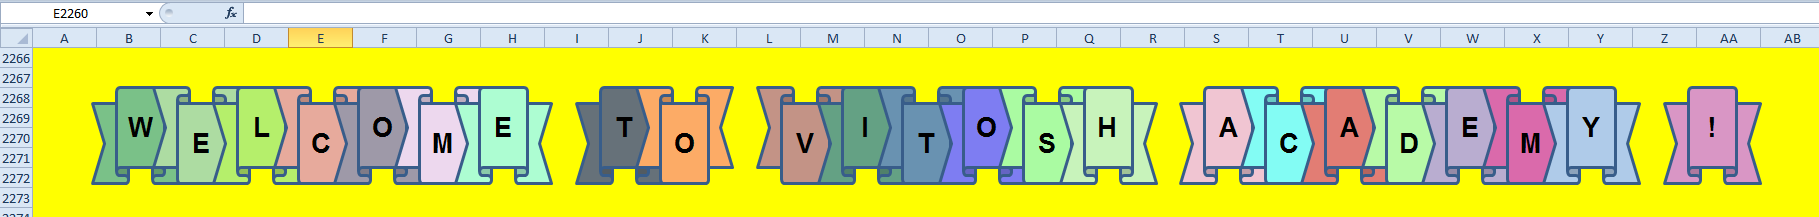
Pretty much the code is quite easy to be understood and modified – what is interesting is the name of the shape and the randomizing function. The name of the shape is taken from the Excel Macro Recorder and in my case I use two forms – msoShapeDownRibbon and msoShapeUpRibbon. The randomizing function is pretty obvious and can be reused in any project.
Something else, quite useful for working with forms – calculating their x and y position. In my case the y is standard, as all the shapes are in line and the x is calculated with the formula x = n * i / k, where n is a constant for the size of the shape, i is the position of the character in the string and k is the total characters of the string. To convert this numbers to points from inches (as far as Excel uses this metric system), we use the build-in function InchesToPoints – press F2 in VBE and write “InchesToPoints” for more information:

Last but not least, we use module calculation in order to select which shape to use – if i mod 2 returns 1, we use the msoShapeUpRibbon, and if it returns 0 we use the msoShapeDownRibbon. And it works! 🙂
|
1 2 3 4 5 6 7 8 9 10 11 12 13 14 15 16 17 18 19 20 21 22 23 24 25 26 27 28 29 30 31 32 33 34 35 36 37 38 39 40 41 42 43 44 45 46 47 48 49 50 51 52 53 54 55 |
Sub DrawName() Dim i As Integer Dim x As Single Dim y As Single Dim z As Single Dim rng As Range Dim n As Single Dim k As Integer Dim sSize As Single Dim sh As Shape Dim sName As String Dim StartLeft As Single Dim StartTop As Single StartLeft = ActiveCell.Left StartTop = ActiveCell.Top sName = «Welcome to Vitosh Academy !» n = 17 k = Len(sName) sSize = Application.InchesToPoints(1) For i = 1 To k If Mid(sName, i, 1) <> » « Then x = n * i / k x = Application.InchesToPoints(x) y = Application.InchesToPoints(z) If i Mod 2 = 1 Then Set sh = ActiveSheet.Shapes.AddShape(msoShapeUpRibbon, StartLeft + x, StartTop + y, sSize, sSize) Else Set sh = ActiveSheet.Shapes.AddShape(msoShapeDownRibbon, StartLeft + x, StartTop + y, sSize, sSize) End If sh.Fill.ForeColor.RGB = RGB(GiveRandom(150, 200), GiveRandom(200, 255), GiveRandom) sh.Fill.Visible = msoTrue sh.TextFrame.Characters.text = UCase(Mid(sName, i, 1)) sh.TextFrame.Characters.Font.Size = 20 sh.TextFrame.Characters.Font.Name = «Arial» sh.TextFrame.Characters.Font.Bold = True sh.TextFrame.Characters.Font.Color = RGB(0, 0, 0) sh.TextFrame2.VerticalAnchor = msoAnchorMiddle sh.TextFrame2.TextRange.ParagraphFormat.Alignment = msoAlignCenter End If Next i End Sub Function GiveRandom(Optional lowerBound As Integer = 100, Optional upperBound As Integer = 255) As Integer Randomize Timer GiveRandom = Int((upperBound — lowerBound + 1) * Rnd + lowerBound) End Function |
Enjoy it!
Since I know nothing about your problem domain or your programming skills, I can only give some general thoughts:
Excel is really good for modeling and building certain prototypes. Modeling this problem and building some charts by hand should give you and your users a good idea if the Excel solution is going to fly. If you can’t get the graphics you want I would look elsewhere. Perhaps Visual Studio and Visual Basic or C#. These have mature drawing capabilities and also charting controls in recent editions.
Excel VBA has a pretty good programming layer for charts. You can also draw custom objects with VBA. I have not done this but I am sure there are references on the web. In any event, if the manually built Excel prototype looks good, it might be worthwhile to automate it with VBA.
Another factor is how many, and of what skill set will the users be? Fewer users, who know Excel pretty well make a case for using Excel. Supporting a large number of users could become onerous as it is possible to change the code in an individual file.
Finally, how long will this application be around? Versioning Excel applications can be done, but it easier to do this with more sophisticated programming environments. Also if you are going to continue to add features you might run into a wall with VBA’s feature set. Hope this helps.
VBA Coding With Shape Objects
In this comprehensive guide, you will be learning all the ways you can create and manipulate shapes with VBA macros.
Shapes are objects you can insert into your spreadsheet through the Insert Tab via the Shapes gallery button. These objects can add visualizations to your dashboards, store text, or even serve as buttons to launch macro code.
Here is an outline of the topics covered in this guide:
Creating A New Shape With AddShape()
To create a shape object in Excel using VBA, you must call the AddShape function.
The AddShape function has 4 required inputs in order to generate a new shape:
-
Type — Name of the type of shape you wish to generate
-
Left — Where on the spreadsheet the left side of the shape should be located
-
Top — Where on the spreadsheet the top of the shape should be located
-
Width — How wide your shape should be
-
Height — How tall your shape should be
Here is a snippet of VBA code showing how to create 2 shapes and store the newly created shape to a variable for easy reference later on in your code.
Sub CreateShape()
Dim shp1 As Shape
Dim shp2 As Shape
‘Create & Store New Shape to Variable
Set shp1 = ActiveSheet.Shapes.AddShape(msoShape16pointStar, _
ActiveCell.Left, ActiveCell.Top, 80, 27)
‘Create & Store New Shape to Variable (use Enum Code)
Set shp2 = ActiveSheet.Shapes.AddShape(94, _
ActiveCell.Left, ActiveCell.Top, 80, 27)
End Sub
Continue reading through the next few sections to learn how to determine the type, size, and position values you should be using to create your desired shape.
Choosing A Shape Type
There are a TON of shape types available to you through VBA. There are so many in fact, that I have painstakenly gone through and visually cataloged them for your ease in the below slide show.
Once you have determined which shape you would like to create, grab either the shape textual name or the enumeration number. You will use this MSOAutoShapeType reference to code the exact shape you want.
If you have a shape already created on your spreadsheet, you can use the following code to figure out its enumeration code that you can reference in your VBA code.
Sub DetermineShapeType()
‘PURPOSE: Display The Shape Type of Selected Shape
‘SOURCE: www.TheSpreadsheetGuru.com
Dim ActiveShape As Shape
Dim UserSelection As Variant
‘Pull-in what is selected on screen
Set UserSelection = ActiveWindow.Selection
‘Determine if selection is a shape
On Error GoTo NoShapeSelected
Set ActiveShape = ActiveSheet.Shapes(UserSelection.Name)
On Error Resume Next
‘Tell User the Shape Type Enumeration Number
MsgBox «The Select Shape Type = » & ActiveShape.AutoShapeType
Exit Sub
‘Error Handler
NoShapeSelected:
MsgBox «You do not have a shape selected!»
End Sub
Determining Shape Position
There are two properties you can modify to change the location of a shape on the spreadsheet with VBA. These two properties are the Left and Top values of the shape.

If you are unsure what the size of your shape should be, there are two popular ways you can size your shape:
Method 1: You can base it on the left and top positions of a cell on your spreadsheet.
The following VBA code shows you how to use the Left value of Cell B1 and the Top value of Cell B10 to reposition the rectangle shape that is created.
Sub ShapePositionFromCell()
Dim shp As Shape
‘Create Shape
Set shp = ActiveSheet.Shapes.AddShape(msoShapeRectangle, _
Range(«B1»).Left, Range(«B10»).Top, 100, 50)
End Sub
Method 2: You can position the shape to your liking manually on the spreadsheet and read the left and top positions using VBA.
The following VBA code will output a message box that displays the Left and Top positions of a currently selected shape (ActiveShape).
Sub DetermineShapePosition()
‘PURPOSE: Display Selected Shape’s Position
‘SOURCE: www.TheSpreadsheetGuru.com
Dim ActiveShape As Shape
Dim UserSelection As Variant
‘Pull-in what is selected on screen
Set UserSelection = ActiveWindow.Selection
‘Determine if selection is a shape
On Error GoTo NoShapeSelected
Set ActiveShape = ActiveSheet.Shapes(UserSelection.Name)
On Error Resume Next
‘Tell User the Shape Position Values
MsgBox «Left Position = » & ActiveShape.Left & vbNewLine & _
«Top Position = » & ActiveShape.Top
Exit Sub
‘Error Handler
NoShapeSelected:
MsgBox «You do not have a shape selected!»
End Sub
Determining Shape Size
There are two properties you can modify to change the size of a shape with VBA. These two properties are the Width and Height values of the shape.

If you are unsure what the size of your shape should be, there are two popular ways you can size your shape:
Method 1: You can base it on the size of a range of cells
Sub ShapeSizeFromRange()
Dim shp As Shape
Dim rng As Range
‘Provide Range for Shape Size
Set rng = Range(«A1:C4»)
‘Create Shape
Set shp = ActiveSheet.Shapes.AddShape(msoShapeRectangle, _
ActiveCell.Left, ActiveCell.Top, rng.Width, rng.Height)
End Sub
Method 2: You can create the shape to your liking manually and read the width and height using VBA
Sub DetermineShapeSize()
‘PURPOSE: Display Selected Shape’s Size
‘SOURCE: www.TheSpreadsheetGuru.com
Dim ActiveShape As Shape
Dim UserSelection As Variant
‘Pull-in what is selected on screen
Set UserSelection = ActiveWindow.Selection
‘Determine if selection is a shape
On Error GoTo NoShapeSelected
Set ActiveShape = ActiveSheet.Shapes(UserSelection.Name)
On Error Resume Next
‘Tell User the Shape Position Values
MsgBox «Width = » & ActiveShape.Width & vbNewLine & _
«Height = » & ActiveShape.Height
Exit Sub
‘Error Handler
NoShapeSelected:
MsgBox «You do not have a shape selected!»
End Sub
Text Formatting
Sub CreateShapeWithText()
Dim shp As Shape
‘Create & Store New Shape to Variable
Set shp = ActiveSheet.Shapes.AddShape(msoShape16pointStar, _
ActiveCell.Left, ActiveCell.Top, 80, 27)
‘Add Text To Shape
shp.TextFrame2.TextRange.Text = «My Awesome Shape!»
‘Bold/Italicize/Underline Text
shp.TextFrame2.TextRange.Font.Bold = True
shp.TextFrame2.TextRange.Font.Italic = True
shp.TextFrame2.TextRange.Font.UnderlineStyle = msoUnderlineDottedLine
‘Change Text Color
shp.TextFrame2.TextRange.Font.Fill.ForeColor.RGB = RGB(225, 140, 71)
‘Change Text Size
shp.TextFrame2.TextRange.Font.Size = 14
‘Center Align Text
shp.TextFrame.HorizontalAlignment = xlHAlignCenter
shp.TextFrame.VerticalAlignment = xlVAlignCenter
End Sub
Fill Color & Borders
Sub CreateShapeWithBorder()
Dim shp As Shape
‘Create & Store New Shape to Variable
Set shp = ActiveSheet.Shapes.AddShape(msoShapeRoundedRectangle, _
ActiveCell.Left, ActiveCell.Top, 80, 27)
‘Light Orange Fill
shp.Fill.ForeColor.RGB = RGB(253, 234, 218)
‘Add Dotted Border
shp.Line.DashStyle = msoLineDashDotDot
‘Dark Orange Border
shp.Line.ForeColor.RGB = RGB(252, 213, 181)
‘Adjust Border Thickness
shp.Line.Weight = 2
‘Remove Border
shp.Line.Visible = False
End Sub
Change Shape Type
If you are looking to change the shape type of an existing type, you can do so by setting the AutoShapeType to a different shape type value.
Sub ChangeShapeType()
Dim shp As Shape
‘Store specific shape on spreadsheet to a variable
Set shp = ActiveSheet.Shapes(«Shape1»)
‘Change shape type to oval
shp.AutoShapeType = msoShapeOval
End Sub
Create Your Own Macro Button With VBA Code
I personally cannot stand the native Excel form control button. It looks so outdated and really makes your spreadsheets look unprofessional. That is why I prefer to use VBA code to create a shape that looks like a button.
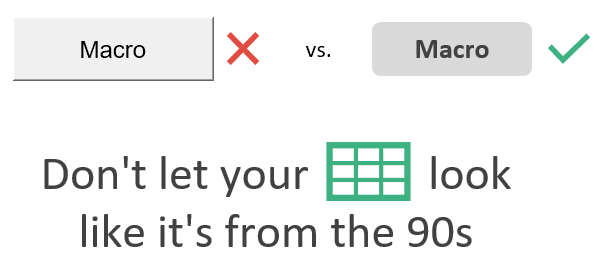
I thought this would be a great example to show you a real-world coding example where I need to create and format a shape to have a specific appearance. The following VBA macro code puts everything we have covered in this guide together and provides you with some sample code that comprises of a true shape-building solution.
Sub Create_Button()
‘PURPOSE: Creates a SpreadsheetGuru macro button shape
‘SOURCE: www.TheSpreadsheetGuru.com
Dim bttn As Shape
‘Create & Position Macro Button
Set bttn = ActiveSheet.Shapes.AddShape(msoShapeRoundedRectangle, _
ActiveCell.Left, ActiveCell.Top, 80, 27)
‘Modify Text Formatting
With bttn.TextFrame2.TextRange
.Text = «Macro»
.Font.Bold = msoTrue
.Font.Fill.ForeColor.RGB = RGB(0, 0, 0)
.Font.Size = 14
End With
‘Center Alignment
bttn.TextFrame.HorizontalAlignment = xlHAlignCenter
bttn.TextFrame.VerticalAlignment = xlVAlignCenter
‘Light Gray Fill
bttn.Fill.ForeColor.RGB = RGB(217, 217, 217)
‘No Border
bttn.Line.Visible = msoFalse
End Sub
Loop Through All Shapes Of Specific Type
If you need to target a specific shape type on your spreadsheet, you can create a loop that tests the AutoShapeType value to filter your results.
The following VBA code example loops through all shape objects in the currently selected spreadsheet and only changes the fill color of the rectangle shapes.
Sub ChangeRectangleShapes()
Dim shp As Shape
‘Loop through each shape on ActiveSheet
For Each shp In ActiveSheet.Shapes
‘Only modify rectangle shapes
If shp.AutoShapeType = msoShapeRectangle Then
shp.Fill.ForeColor.RGB = RGB(253, 234, 218)
End If
Next shp
End Sub
I Hope This Microsoft Excel Article Helped!
Hopefully, I was able to explain how you use VBA code to create and format shapes on your Excel spreadsheets. If you have any questions about these techniques or suggestions on how to improve them, please let me know in the comments section below.

About The Author
Hey there! I’m Chris and I run TheSpreadsheetGuru website in my spare time. By day, I’m actually a finance professional who relies on Microsoft Excel quite heavily in the corporate world. I love taking the things I learn in the “real world” and sharing them with everyone here on this site so that you too can become a spreadsheet guru at your company.
Through my years in the corporate world, I’ve been able to pick up on opportunities to make working with Excel better and have built a variety of Excel add-ins, from inserting tickmark symbols to automating copy/pasting from Excel to PowerPoint. If you’d like to keep up to date with the latest Excel news and directly get emailed the most meaningful Excel tips I’ve learned over the years, you can sign up for my free newsletters. I hope I was able to provide you with some value today and I hope to see you back here soon!
— Chris
| title | keywords | f1_keywords | ms.prod | ms.assetid | ms.date | ms.localizationpriority |
|---|---|---|---|---|---|---|
|
Working with shapes (drawing objects) |
vbaxl10.chm5206010 |
vbaxl10.chm5206010 |
excel |
aef5dc81-d54f-a01a-f949-a30688a3cf23 |
11/13/2018 |
medium |
Shapes, or drawing objects, are represented by three different objects:
| Object | Description |
|---|---|
| Shapes collection | Use to create shapes and to iterate through all the shapes on a given worksheet. |
| ShapeRange collection | Use to modify multiple shapes the same way you work with multiple shapes in the user interface. |
| Shape object | Use to format or modify a single shape. |
Setting properties for a shape
Many formatting properties of shapes are not set by properties that apply directly to the Shape or ShapeRange object. Instead, related shape attributes are grouped under secondary objects, such as the FillFormat object, which contains all the properties that relate to the shape’s fill, or the LinkFormat object, which contains all the properties that are unique to linked OLE objects.
To set properties for a shape, you must first return the object that represents the set of related shape attributes and then set properties of that returned object. For example, you use the Fill property to return the FillFormat object, and then you set the ForeColor property of the FillFormat object to set the fill foreground color for the specified shape, as shown in the following example.
Worksheets(1).Shapes(1).Fill.ForeColor.RGB = RGB(255, 0, 0)
Applying a property or method to several shapes at the same time
In the user interface, you can perform some operations with several shapes selected; for example, you can select several shapes and set all their individual fills at once. You can perform other operations with only a single shape selected; for example, you can edit the text in a shape only if a single shape is selected.
In Visual Basic, there are two ways to apply properties and methods to a set of shapes. These two ways allow you to perform any operation that you can perform on a single shape on a range of shapes, whether or not you can perform the same operation in the user interface.
-
If the operation works on multiple selected shapes in the user interface, you can perform the same operation in Visual Basic by constructing a ShapeRange collection that contains the shapes you want to work with, and applying the appropriate properties and methods directly to the ShapeRange collection.
-
If the operation does not work on multiple selected shapes in the user interface, you can still perform the operation in Visual Basic by looping through the Shapes collection or through a ShapeRange collection that contains the shapes you want to work with, and applying the appropriate properties and methods to the individual Shape objects in the collection.
Many properties and methods that apply to the Shape object and ShapeRange collection fail if applied to certain kinds of shapes. For example, the TextFrame property fails if applied to a shape that cannot contain text.
If you are not positive that each of the shapes in a ShapeRange collection can have a certain property or method applied to it, don’t apply the property or method to the ShapeRange collection. If you want to apply one of these properties or methods to a collection of shapes, you must loop through the collection and test each individual shape to make sure it is an appropriate type of shape before applying the property or method to it.
Creating a ShapeRange collection that contains all shapes on a sheet
You can create a ShapeRange object that contains all the Shape objects on a sheet by selecting the shapes and then using the ShapeRange property to return a ShapeRange object containing the selected shapes.
Worksheets(1).Shapes.Select
Set sr = Selection.ShapeRange
In Microsoft Excel, the Index argument is not optional for the Range property of the Shapes collection, so you cannot use this property without an argument to create a ShapeRange object containing all shapes in a Shapes collection.
Applying a property or method to a ShapeRange collection
If you can perform an operation on multiple selected shapes in the user interface at the same time, you can do the programmatic equivalent by constructing a ShapeRange collection and then applying the appropriate properties or methods to it. The following example constructs a shape range that contains the shapes named «Big Star» and «Little Star» on myDocument and applies a gradient fill to them.
Set myDocument = Worksheets(1)
Set myRange = myDocument.Shapes.Range(Array("Big Star", _
 "Little Star"))
myRange.Fill.PresetGradient _
 msoGradientHorizontal, 1, msoGradientBrass
The following are general guidelines for how properties and methods behave when they are applied to a ShapeRange collection.
-
Applying a method to the collection is equivalent to applying the method to each individual Shape object in that collection.
-
Setting the value of a property of the collection is equivalent to setting the value of the property of each individual shape in that range.
-
A property of the collection that returns a constant returns the value of the property for an individual shape in the collection if all shapes in the collection have the same value for that property. If not all shapes in the collection have the same value for the property, it returns the «mixed» constant.
-
A property of the collection that returns a simple data type (such as Long, Single, or String) returns the value of the property for an individual shape if all shapes in the collection have the same value for that property.
-
The value of some properties can be returned or set only if there is exactly one shape in the collection. If the collection contains more than one shape, a run-time error occurs. This is generally the case for returning or setting properties when the equivalent action in the user interface is possible only with a single shape (actions such as editing text in a shape or editing the points of a freeform).
The preceding guidelines also apply when you are setting properties of shapes that are grouped under secondary objects of the ShapeRange collection, such as the FillFormat object. If the secondary object represents operations that can be performed on multiple selected objects in the user interface, you’ll be able to return the object from a ShapeRange collection and set its properties.
For example, you can use the Fill property to return the FillFormat object that represents the fills of all the shapes in the ShapeRange collection. Setting the properties of this FillFormat object will set the same properties for all the individual shapes in the ShapeRange collection.
Looping through a Shapes or ShapeRange collection
Even if you cannot perform an operation on several shapes in the user interface at the same time by selecting them and then using a command, you can perform the equivalent action programmatically by looping through a Shapes or ShapeRange collection that contains the shapes you want to work with, applying the appropriate properties and methods to the individual Shape objects in the collection.
The following example loops through all the shapes on myDocument and changes the foreground color for each AutoShape shape.
Set myDocument = Worksheets(1)
For Each sh In myDocument.Shapes
 If sh.Type = msoAutoShape Then
 sh.Fill.ForeColor.RGB = RGB(255, 0, 0)
 End If
Next
The following example constructs a ShapeRange collection that contains all the currently selected shapes in the active window and sets the foreground color for each selected shape.
For Each sh in ActiveWindow.Selection.ShapeRange
 sh.Fill.ForeColor.RGB = RGB(255, 0, 0)
Next
Aligning, distributing, and grouping shapes in a ShapeRange
Use the Align and Distribute methods to position a set of shapes relative to one another or relative to the document that contains them.
Use the Group method or the Regroup method to form a single grouped shape from a set of shapes.
See also
- Excel functions (by category)
[!includeSupport and feedback]
Figure 10.20
XY points were plotted in a scatter chart to draw this shape.
Figure 10.20
XY points were plotted in a scatter chart to draw this shape.

The concept of using XY charts for drawing has been perfected by Mala Singh of XLSoft Consulting in India. Mala has been able to use XY charts to draw just about anything. This blueprint is actually an XY chart in Excel (see Figure 10.21).
Figure 10.21
This blueprint is actually an XY Chart in Excel. It takes about 25 seconds to draw the chart.
Figure 10.21
This blueprint is actually an XY Chart in Excel. It takes about 25 seconds to draw the chart.

Continue reading here: Speedometer Chart
Was this article helpful?