
Updated on March 3rd, 2023 by Bob Ciura
Income investors are always on the hunt for high-quality dividend stocks. There are many ways to measure high-quality stocks. One way for investors to find great dividend stocks is to focus on those with the longest histories of raising dividends.
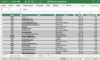
With this in mind, we created a downloadable list of all 150 Dividend Champions.
You can download your free copy of the Dividend Champions list, along with relevant financial metrics like price-to-earnings ratios, dividend yields, and payout ratios, by clicking on the link below:
Investors are likely familiar with the Dividend Aristocrats, a group of 65 stocks in the S&P 500 Index with 25+ consecutive years of dividend increases. Meanwhile, investors should also familiarize themselves with the Dividend Champions, which have also raised their dividends for at least 25 years in a row.
While their length of dividend increases is the same, leading to some overlap, there are also some important differences between the Dividend Aristocrats and Dividend Champions. As a result, the Dividend Champions list is much more expansive. There are many high-quality Dividend Champions that are not included on the Dividend Aristocrats list.
This article will discuss large cap stocks, and an analysis of our top 7 Dividend Champions, ranked according to expected total returns in the Sure Analysis Research Database.
Table of Contents
You can instantly jump to any specific section of the article by clicking on the links below:
- Overview of Dividend Champions
- Top Dividend Champion #7: Eversource Energy (ES)
- Top Dividend Champion #6: Lowe’s Companies (LOW)
- Top Dividend Champion #5: Sanofi SA (SNY)
- Top Dividend Champion #4: 3M Company (MMM)
- Top Dividend Champion #3: Westamerica Bancorp (WABC)
- Top Dividend Champion #2: Sonoco Products (SON)
- Top Dividend Champion #1: Albemarle Corporation (ALB)
Overview of Dividend Champions
The requirement to become a Dividend Champion is simple: 25+ years of consecutive annual dividend increases. The Dividend Aristocrats have the same requirement when it comes to number of years, but with a few additional requirements.
To be a Dividend Aristocrat, a company must also be included in the S&P 500 Index, must have a float-adjusted market cap of at least $3 billion, and must have an average daily value traded of at least $5 million. These added requirements preclude many companies that possess a sufficient track record of annual dividend increases, but do not qualify based on market cap or liquidity reasons.
As a result, while there is some overlap between the Dividend Aristocrats and the Dividend Champions, there are also many Dividend Champions that are not Dividend Aristocrats. Income investors might want to consider these stocks due to their impressive histories of annual dividend increases, so we have compiled them in the downloadable spreadsheet above.
In addition, we have ranked the top 7 Dividend Champions according to total expected annual returns over the next five years. Our top 7 Dividend Champions right now are ranked below.
The Top 7 Dividend Champions To Buy Right Now
The following 7 stocks represent Dividend Champions with at least 25 consecutive years of dividend increases, but they also have durable competitive advantages, long-term growth potential, and high expected total returns.
Stocks have been ranked by expected total annual return over the next five years, from lowest to highest.
Top Dividend Champion #7: Eversource Energy (ES)
- 5-year expected returns: 14.0%
Eversource Energy is a diversified holding company with subsidiaries that provide regulated electric, gas, and water distribution service in the Northeast U.S. The company’s utilities serve more than 4 million customers after acquiring NStar’s Massachusetts utilities in 2012, Aquarion in 2017, and Columbia Gas in 2020.
The company has increased its dividend for 25 consecutive years.
Source: Investor Presentation
On February 13th, 2023, Eversource Energy released its fourth quarter 2022 results for the period ending December 31st, 2022. For the quarter, the company reported revenue of $3.0 billion, an increase of 22.1% versus same quarter of last year. The company reported earnings of $320.2 million and earnings-per-share of $0.92 compared with earnings of $306.7 million and earnings-per-share of $0.89 in the prior year. Eversource Energy earned $1,419.9 million, or $4.09 per share, for the full-year 2022.
The company expects earnings per share to grow at a 5% to 7% compound annual rate from 2023 through 2027, the same as for dividend growth. The company projects 2023 earnings of between $4.25 per share and $4.43 per share.
Click here to download our most recent Sure Analysis report on ES (preview of page 1 of 3 shown below):

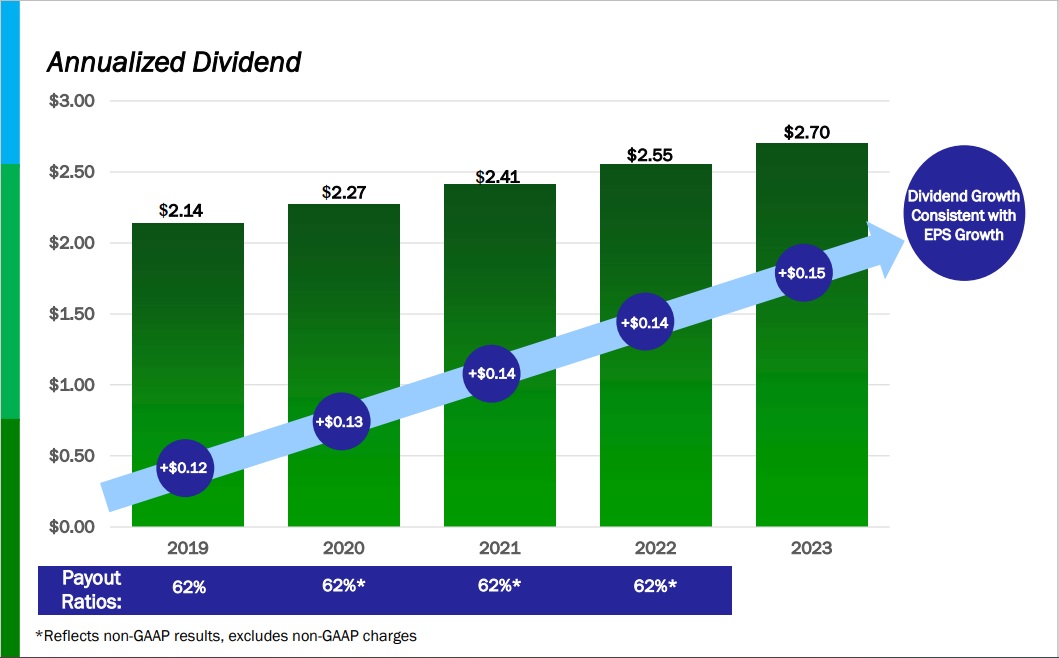
Top Dividend Champion #6: Lowe’s Companies (LOW)
- 5-year expected returns: 14.5%
Lowe’s Companies is the second-largest home improvement retailer in the US (after Home Depot). Lowe’s operates or services more than 2,200 home improvement and hardware stores in the U.S. and Canada.
Lowe’s reported third quarter 2022 results on November 16th. Total sales for the third quarter came in at $23.5 billion compared to $22.9 billion in the same quarter a year ago. Comparable sales increased 2.2%, while the U.S. home improvement comparable sales increased 3.0%. Of note, pro customer sales rose 19% year-over-year.
The company took a $2.1 billion pre-tax non-cash asset impairment charge related to its Canadian retail business. The sale of the Canadian retail business is expected to close in early 2023. Adjusted net earnings, which excludes this significant impairment charge, rose 19.8% year-over-year to $3.27 per share.
The combination of multiple expansion, 6% expected EPS growth and the 2.1% dividend yield lead to total expected returns of 14.1% per year.
Click here to download our most recent Sure Analysis report on Lowe’s (preview of page 1 of 3 shown below):
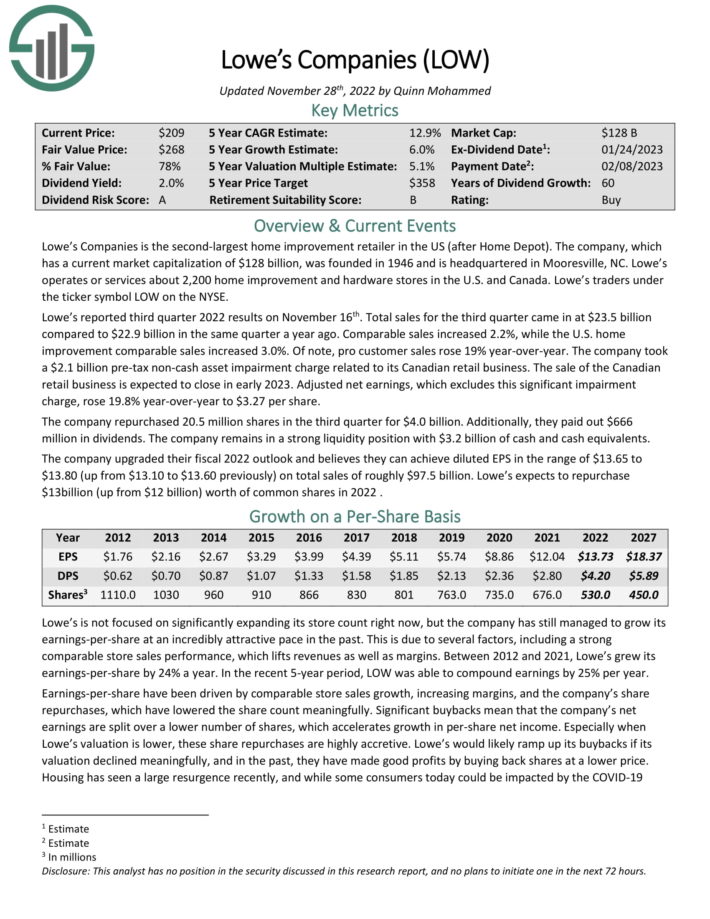
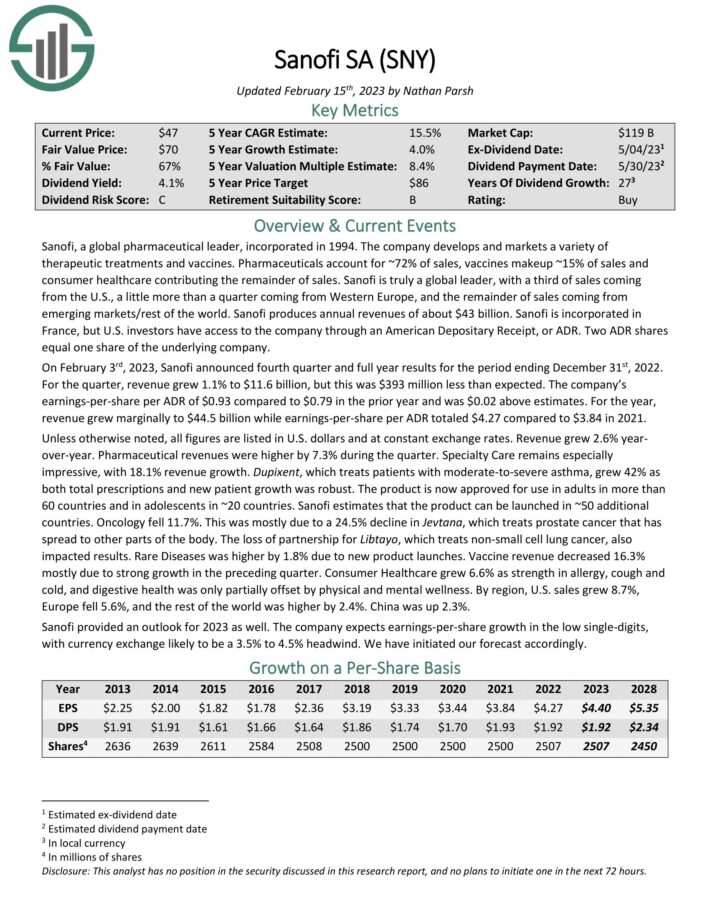
Top Dividend Champion #5: Sanofi SA (SNY)
- 5-year expected returns: 15.0%
Sanofi develops and markets a variety of therapeutic treatments and vaccines. Pharmaceuticals account for ~72% of sales, vaccines makeup ~15% of sales and consumer healthcare contributing the remainder of sales. Sanofi is incorporated in France, but U.S. investors have access to the company through an American Depositary Receipt, or ADR. Two ADR shares equal one share of the underlying company.
On February 3rd, 2023, Sanofi announced fourth quarter and full year results for the period ending December 31st
, 2022. For the quarter, revenue grew 1.1% to $11.6 billion, but this was $393 million less than expected. The company’s earnings-per-share per ADR of $0.93 compared to $0.79 in the prior year and was $0.02 above estimates.

Source: Investor Presentation
For the year, revenue grew marginally to $44.5 billion while earnings-per-share per ADR totaled $4.27 compared to $3.84 in 2021. Unless otherwise noted, all figures are listed in U.S. dollars and at constant exchange rates. Revenue grew 2.6% year-over-year. Pharmaceutical revenues were higher by 7.3% during the quarter.
Sanofi provided an outlook for 2023 as well. The company expects earnings-per-share growth in the low single-digits.
Click here to download our most recent Sure Analysis report on Sanofi (preview of page 1 of 3 shown below):
Top Dividend Champion #4: 3M Company (MMM)
- 5-year expected returns: 15.1%
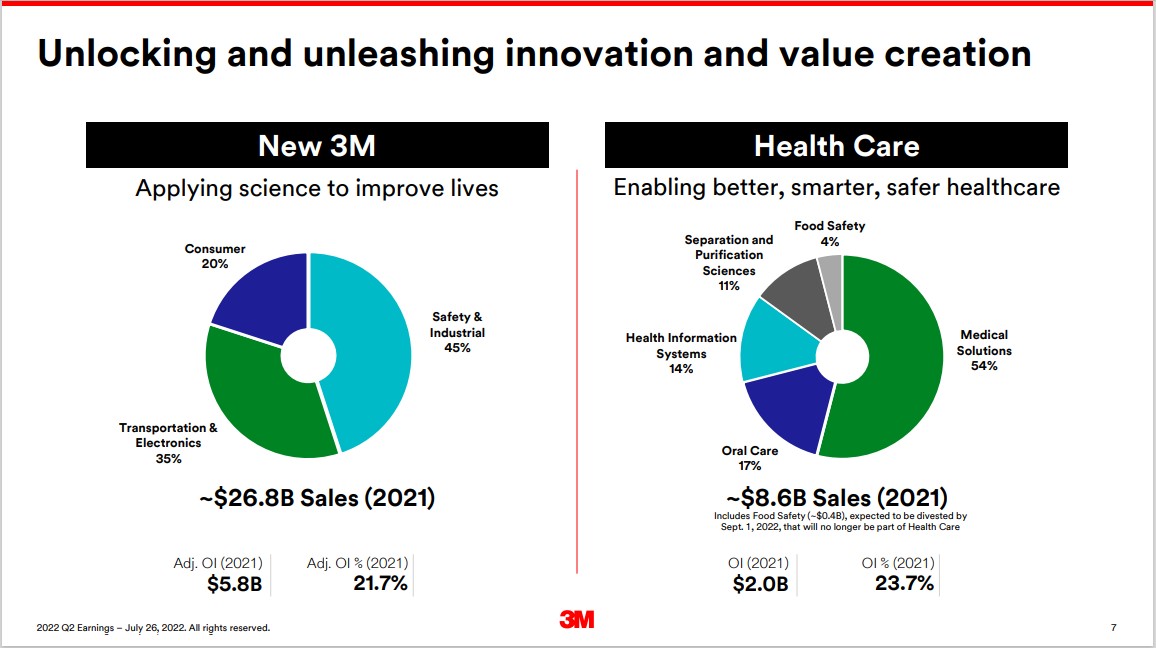
3M sells more than 60,000 products that are used every day in homes, hospitals, office buildings and schools around the world. It has about 95,000 employees and serves customers in more than 200 countries. 3M is now composed of four separate divisions.
Source: Investor Presentation
The company also announced that it would be spinning off its Health Care segment, which would have had $8.6 billion of revenue in 2021. The transaction is expected to close by the end of 2023.
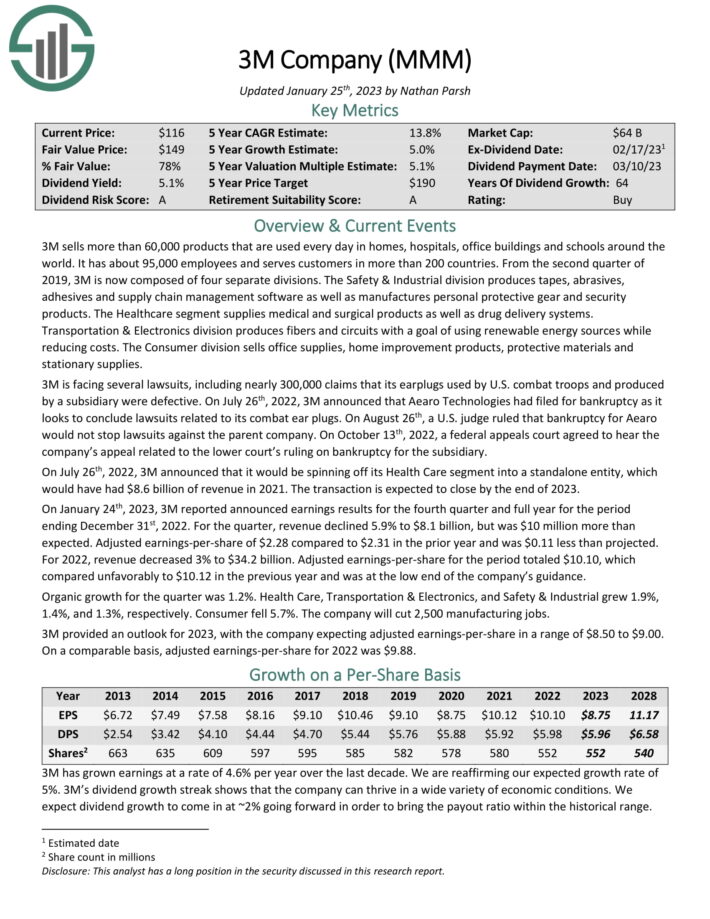
On January 24th, 2023, 3M reported announced earnings results for the fourth quarter and full year for the period ending December 31st, 2022. For the quarter, revenue declined 5.9% to $8.1 billion, but was $10 million more than expected. Adjusted earnings-per-share of $2.28 compared to $2.31 in the prior year and was $0.11 less than projected.
For 2022, revenue decreased 3% to $34.2 billion. Adjusted earnings-per-share for the period totaled $10.10, which compared unfavorably to $10.12 in the previous year and was at the low end of the company’s guidance.
Organic growth for the quarter was 1.2%. Health Care, Transportation & Electronics, and Safety & Industrial grew 1.9%, 1.4%, and 1.3%, respectively. Consumer fell 5.7%. The company will cut 2,500 manufacturing jobs. 3M provided an outlook for 2023, with the company expecting adjusted earnings-per-share in a range of $8.50 to $9.00.
Click here to download our most recent Sure Analysis report on 3M (preview of page 1 of 3 shown below):
Top Dividend Champion #3: Westamerica Bancorp (WABC)
- 5-year expected returns: 16.0%
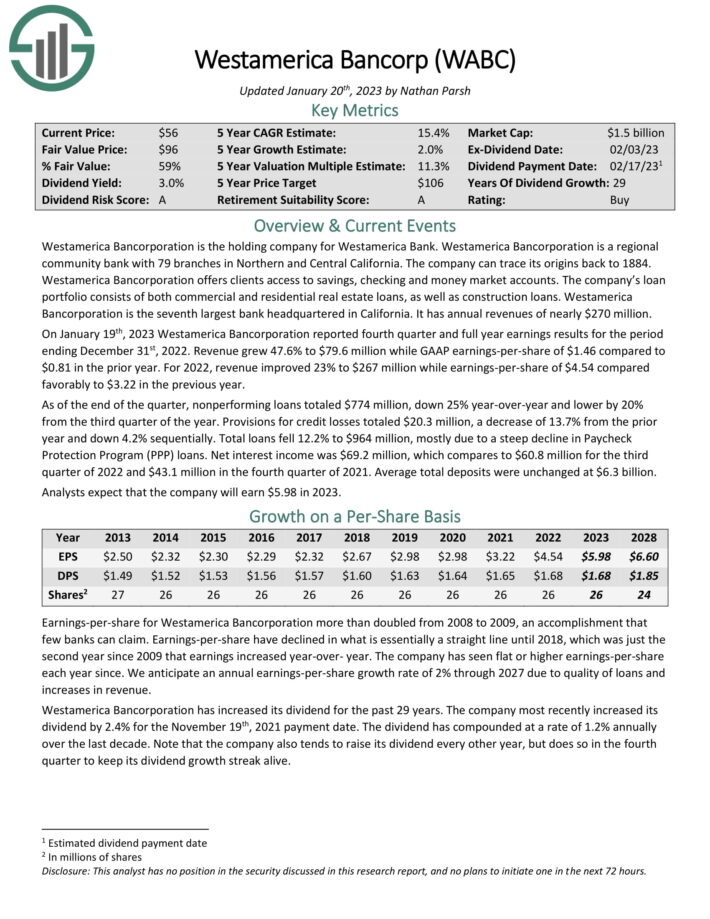
Westamerica Bancorporation is the holding company for Westamerica Bank. Westamerica is a regional community bank with 79 branches in Northern and Central California. The company can trace its origins back to 1884. Westamerica offers clients access to savings, checking and money market accounts.
The company’s loan portfolio consists of both commercial and residential real estate loans, as well as construction loans. Westamerica is the seventh largest bank headquartered in California. It has annual revenues of nearly $270 million.
On January 19th, 2023 Westamerica reported fourth quarter and full year earnings results. Revenue grew 47.6% to $79.6 million while GAAP earnings-per-share of $1.46 compared to $0.81 in the prior year. For 2022, revenue improved 23% to $267 million while earnings-per-share of $4.54 compared favorably to $3.22 in the previous year.
As of the end of the quarter, nonperforming loans totaled $774 million, down 25% year-over-year and lower by 20% from the third quarter of the year. Provisions for credit losses totaled $20.3 million, a decrease of 13.7% from the prior year and down 4.2% sequentially. Total loans fell 12.2% to $964 million, mostly due to a steep decline in Paycheck Protection Program (PPP) loans.
Net interest income was $69.2 million, which compares to $60.8 million for the third quarter of 2022 and $43.1 million in the fourth quarter of 2021. Average total deposits were unchanged at $6.3 billion. Analysts expect that the company will earn $5.98 in 2023.
The company has a long history of paying dividends and has increased its payout for 29 consecutive years. Shares currently yield 3%. We expect 2% annual EPS growth, while the stock also appears to be significantly undervalued. Total returns are estimated at 15.2% per year.
Click here to download our most recent Sure Analysis report on WABC (preview of page 1 of 3 shown below):
Top Dividend Champion #2: Sonoco Products Company (SON)
- 5-year expected returns: 16.8%
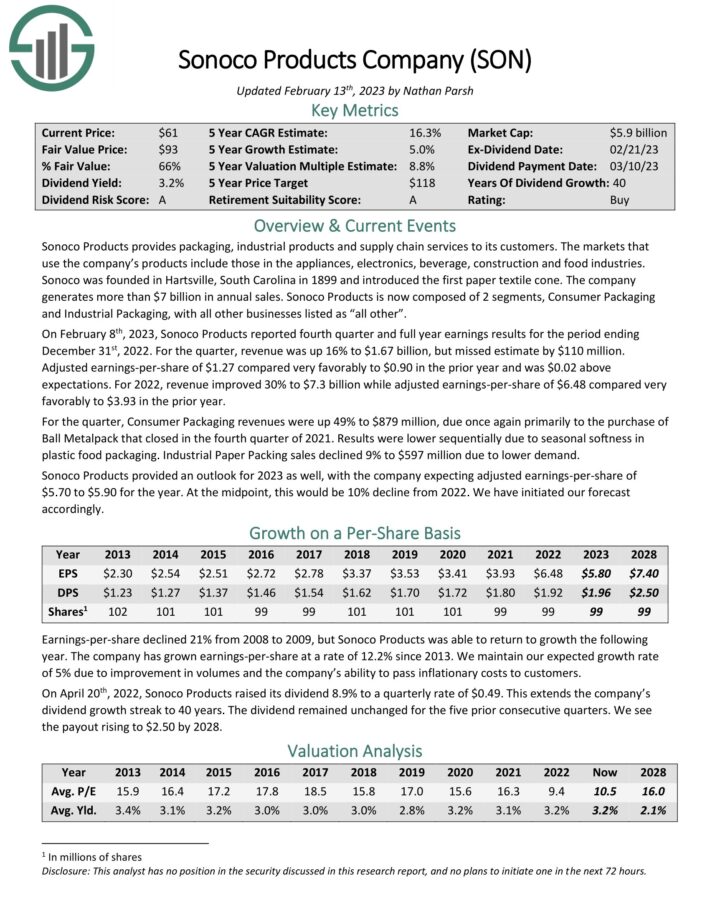
Sonoco Products provides packaging, industrial products and supply chain services to its customers. The markets that use the company’s products include those in the appliances, electronics, beverage, construction and food industries. The company generates about $7.2 billion in annual sales.
Sonoco Products is now composed of 2 core segments, Consumer Packaging and Industrial Packaging, with all other businesses listed as “all other”.

Source: Investor Presentation
On February 8th, 2023, Sonoco Products reported fourth quarter and full year earnings results for the period ending December 31st, 2022. For the quarter, revenue was up 16% to $1.67 billion, but missed estimate by $110 million. Adjusted earnings-per-share of $1.27 compared very favorably to $0.90 in the prior year and was $0.02 above expectations.
For 2022, revenue improved 30% to $7.3 billion while adjusted earnings-per-share of $6.48 compared very favorably to $3.93 in the prior year.
For the quarter, Consumer Packaging revenues were up 49% to $879 million, due once again primarily to the purchase of Ball Metalpack that closed in the fourth quarter of 2021. Results were lower sequentially due to seasonal softness in plastic food packaging. Industrial Paper Packing sales declined 9% to $597 million due to lower demand.
Sonoco Products provided an outlook for 2023 as well, with the company expecting adjusted earnings-per-share of $5.70 to $5.90 for the year. At the midpoint, this would be 10% decline from 2022.
Click here to download our most recent Sure Analysis report on SON (preview of page 1 of 3 shown below):
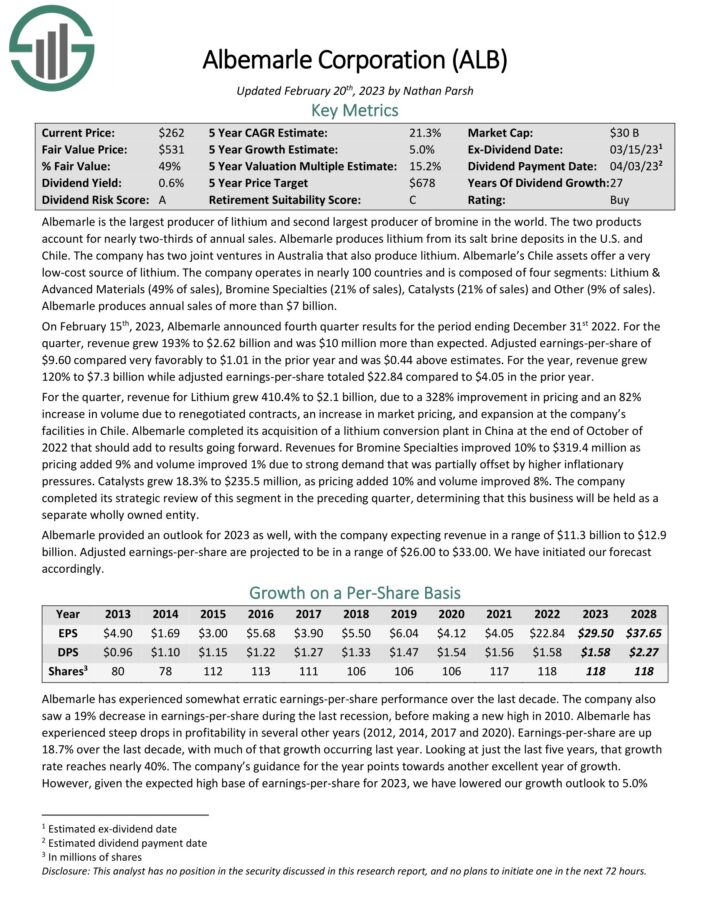
Top Dividend Champion #1: Albemarle Corporation (ALB)
- 5-year expected returns: 22.4%
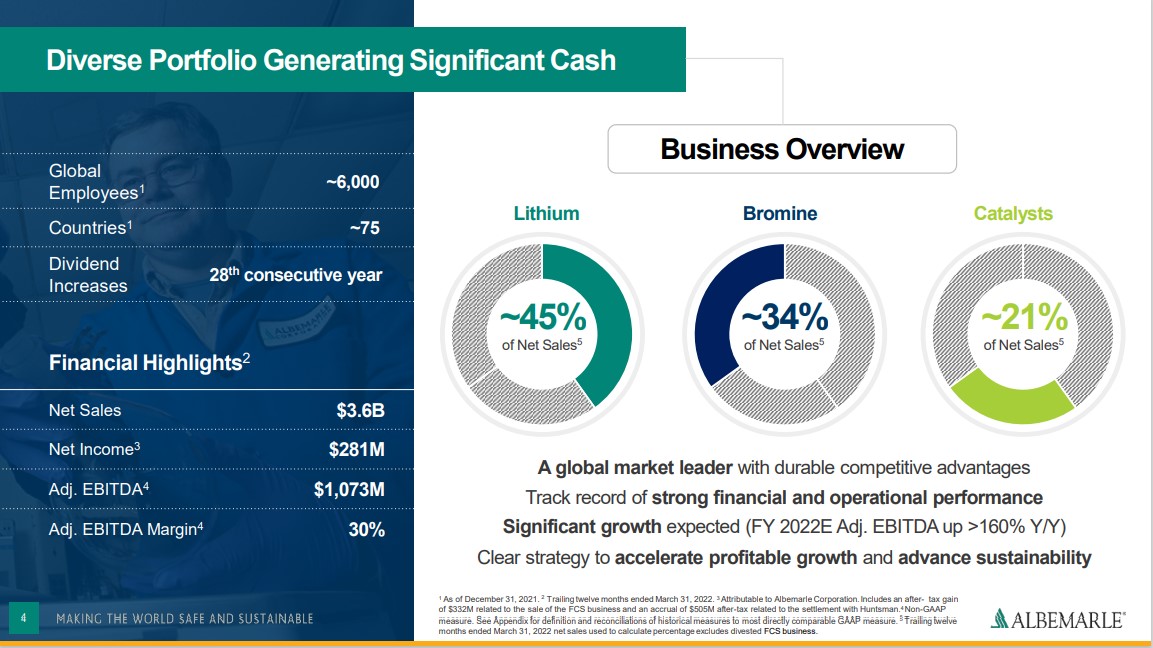
Albemarle is the largest producer of lithium and second largest producer of bromine in the world. The two products account for nearly two-thirds of annual sales. Albemarle produces lithium from its salt brine deposits in the U.S. and Chile. The company has two joint ventures in Australia that also produce lithium. Albemarle’s Chile assets offer a very low-cost source of lithium.
Related: 2023 Lithium Stocks List
The company operates in nearly 100 countries and is composed of four segments: Lithium & Advanced Materials (49% of sales), Bromine Specialties (21% of sales), Catalysts (21% of sales) and Other (9% of sales). Albemarle produces annual sales of more than $7.5 billion.
Source: Investor Presentation
Albemarle produces annual sales of $7.3 billion. It is one of the top lithium stocks.
On February 15th, 2023, Albemarle announced fourth quarter results for the period ending December 31st 2022. For the quarter, revenue grew 193% to $2.62 billion and was $10 million more than expected. Adjusted earnings-per-share of $9.60 compared very favorably to $1.01 in the prior year and was $0.44 above estimates.
For the year, revenue grew 120% to $7.3 billion while adjusted earnings-per-share totaled $22.84 compared to $4.05 in the prior year. For the quarter, revenue for Lithium grew 410.4% to $2.1 billion, due to a 328% improvement in pricing and an 82% increase in volume due to renegotiated contracts, an increase in market pricing, and expansion at the company’s facilities in Chile.
Albemarle completed its acquisition of a lithium conversion plant in China at the end of October of 2022 that should add to results going forward.
Click here to download our most recent Sure Analysis report on Albemarle (preview of page 1 of 3 shown below):
Final Thoughts
The various lists of stocks by length of dividend history are a good resource for investors who focus on high-quality dividend stocks.
In order for a company to raise its dividend for at least 25 years, it must have durable competitive advantages, highly profitable businesses, and leadership positions in their respective industries.
They also have long-term growth potential and the ability to navigate recessions while continuing to raise their dividends.
The top 7 Dividend Champions presented in this article have long histories of dividend growth, and the combination of high dividend yields, low valuations, and future earnings growth potential make them attractive buys right now.
The Dividend Champions list is not the only way to quickly screen for stocks that regularly pay rising dividends.
- The High Yield Dividend Aristocrats List is comprised of the 20 Dividend Aristocrats with the highest current yields.
- The Dividend Achievers List is comprised of ~350 stocks with 10+ years of consecutive dividend increases.
- The Dividend Kings List is even more exclusive than the Dividend Aristocrats. It is comprised of 48 stocks with 50+ years of consecutive dividend increases.
- The High Yield Dividend Kings List is comprised of the 20 Dividend Kings with the highest current yields.
- The Blue Chip Stocks List: stocks that qualify as Dividend Achievers, Dividend Aristocrats, and/or Dividend Kings
- The High Dividend Stocks List: stocks that appeal to investors interested in the highest yields of 5% or more.
- The Monthly Dividend Stocks List: stocks that pay dividends every month, for 12 dividend payments per year.
- The 20 Highest Yielding Monthly Dividend Stocks Now: The 20 monthly dividend stocks with the highest current yields.
- The Dividend Contenders List: 10-24 consecutive years of dividend increases.
- The Dividend Challengers List: 5-9 consecutive years of dividend increases.
- The Complete List of Russell 2000 Stocks: arguably the world’s best-known benchmark for small-cap U.S. stocks.
- The Best DRIP Stocks: The top 15 Dividend Aristocrats with no-fee dividend reinvestment plans.
- The 2022 High ROIC Stocks List: The top 10 stocks with high returns on invested capital.
- The 2022 High Beta Stocks List: The 100 stocks in the S&P 500 Index with the highest beta.
- The 2022 Low Beta Stocks List: The 100 stocks in the S&P 500 Index with the lowest beta.
Thanks for reading this article. Please send any feedback, corrections, or questions to support@suredividend.com.
Dividend Champions are US companies which have increased their dividend for 25 or more consecutive years. The Dividend Champions covers all companies listed on exchanges in the United States. The difference compared to the Dividend Aristocrats , Dividend Champions are not necessarily members of the S&P 500 index.
US Dividend Champions
The Dividend Champions list (currently 131 (2019)) is much larger than the Dividend Aristocrats list (currently 53). The goal of the Champions list is to identify all U.S. companies that have increased their dividends paid for 25+ consecutive years regardless of their size. The difference with the Dividend Aristocrats is that the Aristocrats are always part of the S&P 500 and have some requirements such as market cap. size as defined by S&P.
Next to the Dividend Champions, also often the terms Contenders and Challengers are mentioned or even “CCC” (Champions, Contenders, and Challengers). The Dividend Contenders List is based on all U.S. companies which have increased their dividend for 10 years or more, but less than 25 years. The Dividend Challengers list contains the U.S. companies which have increased their dividend between 5 to 9 years, in a consecutive way.
Dividend Champions excel
Instantly get access the Excel spreadsheet of all Dividend Champions Companies now.
Join our Newsletter and receive a link to download all excels for FREE!
The Dividend Champions Excel spreadsheet contains the following fundamental and stock price performance metric for each stock of this list.
Fundamental metrics:
- Dividend & earnings per share
- Dividend Yield
- Pay-out ratio
- Sector
- Dividend Aristocrat
- DRIP-indicator
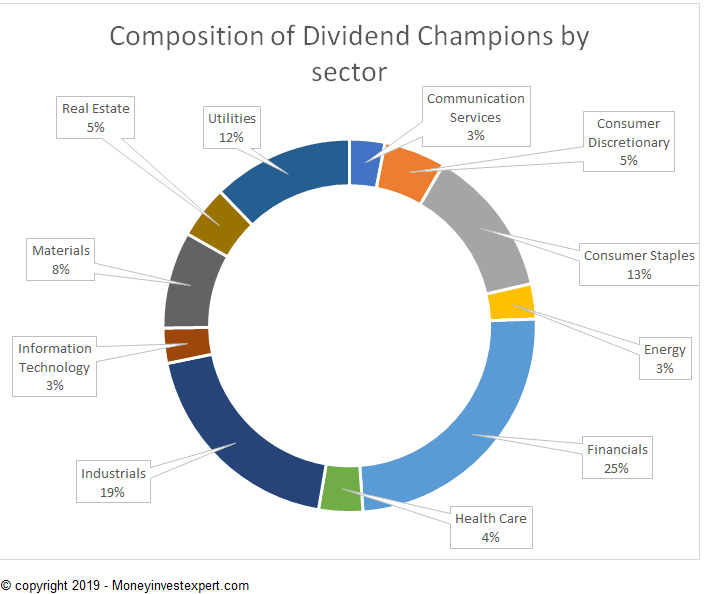
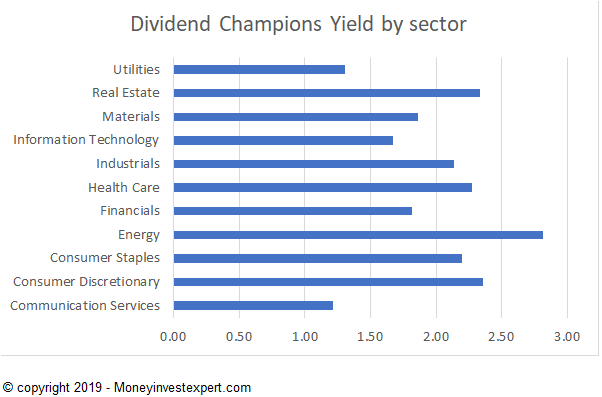
Sector and Dividend Yield overview of the Dividend Champions
Next to the individual companies in this dividend list, it is also interesting to look at the composition per sector and the average dividend yield. This could be relevant data in the search for dividend investing ideas.
More background and data on the Dividend CCC-list
The Dividend Champions list was created by David Fish in 2007 (deceased 2018) and is currently maintained by Justin Law. More information is available at The DRiP Investing Resource Center. An updated spreadsheet (and PDF) is available each month and contains additional valuable data, such as DGR (dividend growth rate) for several years, fundamental data from Finviz, dividend growth model and Technical data (SMA, etc)
 Next, to selecting the right dividend stocks, important principles for successful long-term investing are Discipline, Diversification, Defensive & indeed Dividend. Read more about this in our free e-book.
Other Sources of Dividend Investment Ideas
The Dividend Aristocrats list is not the only way to quickly screen for businesses that regularly pay rising dividends.
- The Dividend Kings List is even more exclusive than the Dividend Aristocrats. It is comprised of less than 20 businesses with 50+ years of consecutive dividend increases.
- The MoneyInvestExpert Defensive Aristocrats is a performance-based top-10 selection of the Dividend Aristocrats to outperform the market on the long-term.
- Portfolio lists like the Berkshire Hathaway Portfolio or Bill Gates’stock portfolio can be a source.
- For the European focused investors there is also the list of European Dividend Aristocrats.
- Dividend Champions are not necessarily members of the S&P 500 index, have increased their dividend for 25 or more consecutive years.
- 100+ years of dividend, the list of stocks that pay over 100 year of dividend can be an list of inspiration.
Next to selecting the right dividend stocks, important principles for successful long-term investing are Disciple, Diversification, Defensive & indeed Dividend. Read more about this in our free e-book.
Thanks for reading this article.
Please send any feedback, corrections, or questions to service[@]moneyinvestexpert.com.
«Вы платите высокую цену за входной билет, чтобы только переступить порог. Но когда вы уже оказались внутри, на вас проливается золотой дождь. И чем дольше вы остаетесь там, тем обильнее будет этот дождь» (Уоррен Баффетт)

Продолжая дивидендную тему (смотрите ранее «Дивидендные аристократы«) рекомендую хороший ресурс http://www.dripinvesting.org/Tools/Tools.asp
«Дивидендные чемпионы» — это более широкий список дивидендных акций, чем в «дивидендных аристократах», непрерывный рост дивидендов не от 25 лет, а допускается от 5 лет, и акции не только из индекса S&P500. Хорошая выборка для составления модельного портфеля.
Этот список был вдохновлен усилиями нескольких лиц и предназначен для свободного распространения для индивидуального, некоммерческого использования. Первоначальная цель заключалась в выявлении компаний, которые увеличили свои дивиденды, по крайней мере 25 лет подряд. Но это определение было расширено, чтобы включить дополнительные компаний, которые платили более высокие дивиденды (не обязательно увеличившись ежеквартального скорости в каждом календарном году).
Помимо Champions (дивиденды более 25 лет), в этом списке — Contenders компании, которые увеличили свои дивиденды за 10-24 лет подряд и Challengers компаний, которые увеличили свои дивиденды для 5-9 лет подряд. Сейчас в этом списке всего 753 американских компаний.
Скачайте файлы формата excel — U.S. Dividend Champions (большой массив актуальной информации, удобной для анализа) и dividend—champions—screener(скринер, в котором можно устанавливать свои параметры для отбора), не пожалеете. Информация периодически обновляется.
Еще на этом ресурсе есть информация и ссылки на сайты, где есть данные по компаниям из Канады, Еврозоны, Испании и Великобритании. Полезный сайт. Столько классных компаний на Западе, кругом идет голова 
Для меня эта информация имеет определенную практическую ценность. Я начал инвестировать в американские акции через Санкт-Петербургскую биржу. Сейчас торгуется 53 акции, в файле U.S. Dividend Champions – из них есть 25.
Я для удобства сформировал по этим акциям несколько таблиц для удобства анализа. Информация про дивиденды (размер дивидендов, EPS% Payout, Div. Yield, Dividend Growth Rate и прочее), все основные фундаментальные коэффициенты — P/E, P/Book, ROE и т.д.
Картинки отлично увеличиваются!

В форме есть данные по коэффициенту Грэхема (±% vs. Graham — вычисляет премию или скидку текущий цены в сравнении с «коэффициентом Грехема»). Грехем считал, что разумное соотношение цена / прибыль равно 15, и соотношение разумная цена / собственный капитал равно 1,5, в итоге Graham=Р/E*P/BV = max (22,5).
Фактическое значение коэффициента Грехема не показано, но оно разделено на текущую цену с целью получения премии или скидка в процентах, по сравнению с числом Грехема.
Две компании — Valero Energy Corp. и Chevron Corp. имеют скидку. Стоит обратить внимание. Возможно, в следующий раз куплю.
История выплат дивидендов и темпов роста дивидендов


На сайте U.S. Dividend Champions есть прогноз дивидендов до 2019 года. Довольно консервативный прогноз, большинство акций имеет прогнозный рост дивидендов в следующие 5 лет значительно меньше, чем произошло за предыдущие 5 лет.

Есть вопросы, по некоторым компаниям, например, Valero Energy – весьма скромный рост дивидендов до 2019 года, и какой-то всплеск в этом году? Нужно потом перепроверить.
Модель следующая.
Прибыль инвестора складывается из сумм полученных дивидендов за будущие 5 лет (смотри в таблицах выше) уже с учетом налогов (-30%, на Санкт-Петербургскую дивиденды приходят уже очищены от налогов, возможно позже будет -10%, тогда пересчитаю) и переоценки стоимости акции.
Переоценку стоимости акции произвел исходя из размера дивиденда в 2019 года, взяв сегодняшний уровень дивидендной доходности. Сейчас ДД в среднем по 25 акциям равна 3,14%, это выше доходности американских 10Т. Т.е. инвестор с начала инвестиций покупает «акцию-облигацию», у которой доходность выше 10Т (смотри самую первую картинку о компании P&G — акционеры получают всё больше и больше купон (дивиденд)!). История про золотой дождь.
Составил список по убыванию предполагаемого совокупного дохода инвестора (до 2019 г.)

Вполне себе хороший «золотой дождь», стоит заплатить за вход…
Думаю, можно выборочно инвестировать в лучшие акции из этого списка, хороший вариант – золотая середина этого списка (размер дивидендов + изменение цены акции): Procter & Gamble Co., General Electric Co., AT&T Inc., Cisco Systems Inc., McDonald‘s Corp., Verizon Communications, Johnson & Johnson, Chevron Corp., Philip Morris International, Pfizer Inc.
CME GroupInc., Tiffany & Company, Qualcomm Inc. – отдельная история, их пока за скобки убрал.
Данный анализ строитсяна прогнозе роста дивидендов и постоянство относительной оценки к размеру дивиденда. Положительный исход для данных акций, более, чем вероятен, но степень риска присутствует в любом случае.
Заметил, что почти одни и те же акции есть в каждом из списков, которые я составляю по разным критериям. Соглашусь, что такого рода анализ проводится несколько механически, но как первичный фильтр вполне приемлемо.
Ваша задача как инвестора заключается в том, чтобы по разумной цене приобрести долю компании, чья экономическая деятельность вам вполне понятна и чьи доходы будут существенно увеличиваться через 5, 10 и 20 лет. Спустя некоторое время вам удастся найти лишь несколько компаний, отвечающих этим стандартам. Поэтому когда вы увидите одну из них, лучше сразу приобрести значительное количество активов. И не поддавайтесь искушению отступиться от своих принципов. Если вы не собираетесь оставаться владельцем акций в течение десяти лет, нет смысла приобретать ее даже на десять минут. Если в своем инвестиционном портфеле вы соберете активы компаний, чей совокупный доход будет неизменно расти в течение нескольких лет, то соответственно будет расти и рыночная стоимость вашего портфеля.

Инвестор должен оценивать действительный риск. Этот риск заключается в том, сможет ли он за инвестиционный период получить совокупный доход после вычета налогов (включая тот, который он получает от продажи), покупательная способность которого хотя бы равна начальной. К этому доходу должен дополнительно приплюсовываться приличный процент на начальную ставку. Хотя этот риск технически невозможно подсчитать безошибочно, но в некоторых случаях его вполне можно оценить с необходимой точностью. Основные факторы, имеющие отношение к такой оценке, следующие:
— достоверность, с которой можно оценить долгосрочные экономические показатели компании;
— достоверность, с которой можно оценить деятельность руководства как по способности реализовывать весь потенциал компании, так и по разумности использования потоков денежных средств;
— уверенность в том, что руководство будет направлять результаты от эффективной деятельности компании не себе в карман, а акционерам;
— цена покупки компании;
— уровни налогообложения и инфляции, которые будут существовать и определять степень отличия покупательной способности доходов инвестора от валового дохода.
Возможно, некоторым аналитикам эти факторы могут показаться слишком неопределенными, поскольку не могут быть извлечены ни из какой статистической базы. Но сложность точного измерения этих факторов не является непреодолимой и не оспаривает их важность.
В итоге, чтобы купить акции компании: она должна быть понятна, имела привлекательные для нас долгосрочные перспективы, управлялась честными и компетентными специалистами и имела привлекательную цену покупки.
На Санкт-Петербургской бирже есть такие акции в достаточном количестве, думаю, у меня получится сформировать хороший портфель.
Успешных инвестиций!
U.S. Dividend Champions
Dividend Champions are companies that have increased their dividend every year for the past 25 years. Contenders have increased their dividend for the past 10 years, and Challengers the past five years. The idea for the spreadsheet was created in 2008 by Dave Fish (deceased in 2018), and is now available and updated every Friday afternoon at Dividend Radar.
~ Updated monthly on the 1st of the month ~
-
Dividend Champions Excel Spreadsheet
-
Dividend Champions in PDF Format
Dividend Radar is a weekly update of securities that have raised their yearly dividend payouts for at least five years, and has the most up-to-date listing. Why Dividend Radar?
Get a historic compilation of Dividend Champions here
Other Dividend Champions Lists
Canadian Dividend All-Star List
Canadian companies with five or more consecutive years of dividend increases. Download here Maintained by DGI&R of Dividend Growth Investing & Retirement
European Dividend Champions
European Dividend Champions is based on the 40 highest dividend-yielding Eurozone companies within the S&P Europe 350 index and a managed dividends policy of increasing or stable dividends for at least 10 consecutive years. Maintained by Patrick Neuwirth
Stock Rover has been named Best Buy and Hold Screener by Investopedia
Eurozone Dividend Champions
Eurozone Dividend Champions List is an Excel spreadsheet with a lot of stock information on Eurozone companies that have increased or maintained their dividend for 5 or more calendar years in a row. Maintained by Christophe Soulet
UK Dividend Champions
The UK Dividend Champions List is an excel spreadsheet with a lot of stock information on UK companies that have increased or maintained their dividend for 5 or more calendar years in a row. Maintained by Christophe Soulet
Global CCC List
The Global CCC List is a non-periodical publication tracking public companies with a history of increasing their dividends by SDS (Seductive Dividend Stocks).
Dividend Spreadsheet
A simple Google Sheets spreadsheet for tracking your dividend portfolio.
Dividend Calendar
The Dividend Calendar lets you see in which month you need to own the stock to get dividends according to the ex-date and when dividends get paid according to the payment date.
Dividend Tracking
Dividend Meter is a spreadsheet created in Google Sheets. It automatically imports current stock quotes and annual dividend figures,calculates dividend yields, and displays the total annual expected dividend amount in a colorful gauge chart.
Track Your Dividends makes it easy to track all your Canadian and US dividend income all in one easy to use interface.
DiviTrack displays all the important metrics you need to know and explains how they calculated them.
Investment Analysis
Stock Rover is a powerful investment analysis tool that goes well beyond what investors are used to from existing equity research sites. It is fully mobile, working seamlessly on desktops, laptops, tablets and phones.
Portfolio Management
Stock.Div lets you manage your portfolio easily and conveniently, where everything you need to make better decisions about your portfolio is right at your fingertips.
Spreadsheets
Portfolio Slicer is a free Excel workbook that lets you track your investments (stocks, ETFs, mutual funds) your way.
An Excel spreadsheet holding a sample budget
Calculators
Dividend Income Calculator was developed to help users better define particular companies ripe for investment.
RRSP Calculator and TFSA Calculator will help you understand how much you can contribute to your RRSP and TFSA and how your savings could grow in the future.
Financial Calculators in the finance section of The Calculator Site feature useful financial calculator tools for loans, car/auto loans, compound interest, savings, mortgages and more.
Good Calculators is a collection of online calculators for use in every day domestic and commercial use.
Retirement Calculator uses data from the S&P 500, 10 Year Treasury Bond, 30 Day Treasury Bills, and US inflation data to determine how long your savings and investments will last in retirement.
Forms
-
Computershare: AttestationInvestment Plans And SummariesTransfer & Declaration of Ownership FormsSearch for Companies That Allow Optional Cash Purchases
-
Canadian Stock Transfer: Participant Declaration FormSecurity Transfer Form
-
Medallion Stamps: Adocument with the branches that have Medallion Stamps
-
Enbridge: DRiP Enrollment and Optional Cash Purchase
-
H&R Real Estate Investment Trust: Declaration of Beneficial Ownership of Units
-
Imperial Oil: Dividend Reinvestment and Share Purchase Plan Authorization
-
Olympia Trust
-
General Securities Transfer Form DRS Request Form
-
TransAlta: Authorization
Размещённые в настоящем разделе сайта публикации носят исключительно ознакомительный характер, представленная в них информация не является гарантией и/или обещанием эффективности деятельности (доходности вложений) в будущем. Информация в статьях выражает лишь мнение автора (коллектива авторов) по тому или иному вопросу и не может рассматриваться как прямое руководство к действию или как официальная позиция/рекомендация АО «Открытие Брокер». АО «Открытие Брокер» не несёт ответственности за использование информации, содержащейся в публикациях, а также за возможные убытки от любых сделок с активами, совершённых на основании данных, содержащихся в публикациях. 18+
АО «Открытие Брокер» (бренд «Открытие Инвестиции»), лицензия профессионального участника рынка ценных бумаг на осуществление брокерской деятельности № 045-06097-100000, выдана ФКЦБ России 28.06.2002 (без ограничения срока действия).
ООО УК «ОТКРЫТИЕ». Лицензия № 21-000-1-00048 от 11 апреля 2001 г. на осуществление деятельности по управлению инвестиционными фондами, паевыми инвестиционными фондами и негосударственными пенсионными фондами, выданная ФКЦБ России, без ограничения срока действия. Лицензия профессионального участника рынка ценных бумаг №045-07524-001000 от 23 марта 2004 г. на осуществление деятельности по управлению ценными бумагами, выданная ФКЦБ России, без ограничения срока действия.
A dividend champion is a company which has a 25 year record of annual dividend increases. There are only 129 such companies in the US today. I believe that becoming a dividend champion is no accident, and it is a result of a strong business that has generated earnings growth for a long period of time. These are the types of businesses I like to study, and potentially consider at the right time for my dividend portfolio.
I have updated the list of dividend champions through December 31, 2018. I decided to update the list of dividend champions after the untimely passing of David Fish in May 2018.
Since I use the list of dividend champions in my investing research, I realized that my process is at risk, since it is dependent on a single person. This led me to develop ways to update the list on a monthly basis. The list is a result of a few things I do:
1) Obtain forward dividend information from Yahoo Finance, and compare it to existing information from the prior month’s list
2) Research differences, and verify if this is indeed a dividend increase. I like to verify new raises and dividend track records against press releases, which is a manual process. Very often, my research tells me that there is no increase, but my data feed or my calculations are incorrect.
3) Update the list using the inputs from 1) and 2) above, and add prices and trailing earnings per share.
4) The other step is more of a gut check. I like to keep plugged in the world of dividend growth investing. Between monitoring weekly dividend increases, monitoring my dividend portfolio holdings and following investors and companies, I develop a mental checklist of companies that have increased/decreased dividends. This is helpful when updating the list of dividend champions. I have also been around for a little bit, which is how I decided to promote certain companies like Abbott (ABT) to the rank of a dividend champion, but remove Realty Income (O) from the list.
5) I didn’t find a reliable source to update the trailing dividend payments for 2018 in a systematic way. As I didn’t feel like updating the annual dividend amounts for 2018 for over 100 companies, I skipped this step.
The 2019 dividend champions list can be downloaded from this location in an excel spreadsheet format. Subscribers to my free newsletter are receiving this as an attachment in their inboxes.
Additions to the list
I added two companies to the list of dividend champions, which raised their dividends for the 25th year in at row:
PSB Holdings Inc. (PSBQ)
Urstadt Biddle Properties (UBA)
I updated Praxair (PX), which merged with German company Linde a few months ago to the new company/symbol Linde (LIN). Based on the latest dividend announcement, it looks like the new company is continuing the dividend history of Praxair.
As a result, there are 129 dividend champions in the US.
There were several dividend increases over the past month from the dividend champion companies. These include:
|
Name |
Symbol |
Yrs |
Old |
New |
Increase |
Yield |
|
ABM |
ABM |
52 |
$ |
$ |
2.86% |
2.24 |
|
Abbott |
ABT |
47 |
$ |
$ |
14.29% |
1.77 |
|
AT&T |
T |
35 |
$ |
$ |
2.00% |
7.15 |
|
Ecolab |
ECL |
27 |
$ |
$ |
12.20% |
1.25 |
|
Erie |
ERIE |
28 |
$ |
$ |
7.35% |
2.52 |
|
Franklin |
BEN |
38 |
$ |
$ |
15.00% |
3.10 |
|
Nucor |
NUE |
46 |
$ |
$ |
5.26% |
3.09 |
|
Pentair |
PNR |
43 |
$ |
$ |
2.86% |
1.91 |
|
SEI |
SEIC |
28 |
$ |
$ |
10.00% |
1.43 |
|
Stryker |
SYK |
26 |
$ |
$ 0.5200 |
10.64% |
1.33 |
|
Universal |
UHT |
33 |
$ |
$ |
0.75% |
4.40 |
I have decided to discontinue updating the list of dividend champions for several reasons.
First of all, there is someone else who has taken on the task of updating the list of dividend champions, contenders and challengers. I have a great respect for this, given the fact that I know how time consuming this process can be. I am hopeful that they can continue updating the list for years to come. If they don’t, I am sure that someone else can pick up the torch. Either way, I have a backup process in place to update the list of dividend champions. But for the time being, it is no use to duplicate effort.
Second, I do not as much interest from my readers about those monthly updates of the dividend champions list. Readers tend to enjoy other articles I write, because of my personal spin on the situation. Given the fact that updating the list of dividend champions takes a lot of time, right around the time I am busy with updates for my dividend growth investor newsletter, I am choosing to prioritize my premium offering.
This was a great exercise in updating the dividend champions list however. It is a great exercise in independent thinking. For example, I disagree with some of the additions in the current list of dividend champions. Notably, the following companies have not increased dividends for 25 years in a row (e.g. Realty Income went public in 1994, so they would be eligible to become a dividend champion by the end of 2019):
|
Ticker |
Name |
Years |
|
ARTNA |
Artesian |
22 |
|
CAT |
Caterpillar |
24 |
|
O |
Realty |
24 |
In addition, the other list does not include Abbott Labs (ABT), which has increased dividends for 47 years in at row. The company split into two in 2013, when it spun-off Abbvie. Therefore, I believe that the company with the legacy name should inherit the historical record of annual dividend increases. If you disagree with this thinking, you should also remove Altria (MO) from the list of dividend champions. The latter spun-off Kraft in 2007 and Phillip Morris International (PM) in 2008, but is on the list of dividend champions. I believe that you need to have a consistency in methodology, when maintaining a list of companies.
Of course, the other list from Justin Law updates roughly 800 companies, which is why we should not be too picky. This is a massive undertaking to take on a monthly basis, as it is a gargantuan amount of work.
Thank you for reading along! The rest of the articles will continue next week!
Relevant Articles:
— Dividend Champions, Contenders & Challengers: The most complete list of US dividend growth stocks available
— October 2018 Dividend Champions List
— December 2018 Dividend Champions List
— RIP David Fish
| REIT Mutual Fund | Symbol |
|---|---|
| Alpine Realty Income and Growth Fund | AIGYX, AIAGX |
| American Century Real Estate Fund | REAIX, REACX, AREEX, AREWX, ARYCX, AREDX |
| Real Estate Securities Fund | MRESX |
| AR Capital Real Estate Income Fund | ARIAX, ARICX, ARIPX |
| AssetMark Real Estate Securities Fund | AFREX |
| Aston/Harrison Street Real Estate Fund | AARIX, ARFCX |
| Baron Real Estate Fund | BREIX, BREFX |
| BlackRock Real Estate Securities | BIREX, BAREX, BCREX |
| Brookfield U.S. Listed Real Estate Fund | BRUAX, BRUCX, BRUIX, BRUYX |
| CGM Realty Fund | CGMRX |
| West Loop Realty Fund | REIIX, REIAX, REICX |
| Cohen & Steers Institutional Realty Shares | CSRIX |
| Cohen & Steers Realty Income Fund | CSEIX, CSDIX, CSBIX, CSCIX |
| Cohen & Steers Realty Shares | CSRSX |
| Columbia Real Estate Equity Fund | CREAX, CREIX, CRRVX, CRERX, CREEX, CRRFX, CREWX, CRECX, CREBX |
| Compass EMP REC Enhanced Volatility Weighted Fund | CWRAX, CWRIX, CWRTX, CWRCX |
| Davis Real Estate Fund | RPFRX, DREYX, DRECX, DREBX |
| Delaware Real Estate Investment Trust Portfolio II | DPRTX, DPRBX |
| Delaware Real Estate Investment Trust Portfolio | DPREX, DPRSX, DPRRX, DPRCX |
| DFA Real Estate Securities Portfolio | DFREX |
| Dunham Real Estate Stock Fund | DAREX, DNREX, DCREX |
| DWS RREEF Real Estate Securities Fund | RRRRX, RRREX, RRRAX, RRRSX, RRRBX, RRRCX |
| DWS RREEF Real Estate Securities Income Fund | REFAX, REFCX, REFIX, REFSX |
| Eaton Vance Real Estate Fund | EAREX, EIREX |
| EII Realty Securities Fund | EIIRX |
| Fidelity Advisor Real Estate Fund | FHEIX, FHEAX, FHETX, FHECX, FHEBX |
| Fidelity Advisor Real Estate Income Fund | FRIRX, FRIQX, FRINX, FRIOX |
| Fidelity Real Estate Income Fund | FRIFX |
| Fidelity Real Estate Investment Portfolio | FRESX |
| Fidelity Spartan Real Estate Index Fund | FSRNX, FRXIX, FSRVX |
| Fidelity Series Real Estate Equity Fund | FREDX, FREFX |
| Fidelity Series Real Estate Income Fund | FSREX, FSRWX |
| Forward Real Estate Long/Short Fund | KSRYX, FRLSX, FFSRX, KSRAX, KSRCX, KSRBX |
| Forward Real Estate Fund | FPREX, FFREX, KREAX, KRECX |
| Forward Select Income Fund | KIFYX, FSIMX, FFSLX, KIFAX, KIFBX, KIFCX |
| Franklin Real Estate Securities Fund | FREEX, FRLAX, FRRSX, FSERX |
| GMO Real Estate Fund | GMORX |
| Goldman Sachs Real Estate Securities Fund | GREIX, GRETX, GREAX, GRESX, GRERX, GREBX, GRECX |
| Great-West Real Estate Fund | MXREX |
| Heitman REIT Fund | OARTX, OBRTX |
| ING Real Estate Fund | CRARX, IREWX, IDROX, CLARX, CRWRX, CRCRX, CRBCX |
| INVESCO Real Estate Fund | REINX, IARFX, IARIX, IARYX, IARAX, IARRX, IARCX, AARBX |
| Ivy Real Estate Securities Fund | IRSAX, IREIX, IRSYX, IRSRX, IREEX, IRSCX, IRSBX |
| John Hancock Real Estate Securities Fund | JIREX |
| Johnson Realty Fund | JRLTX |
| J.P.Morgan Realty Income Fund | URTLX, JRIRX, URTAX, URTBX, URTCX |
| J.P. Morgan Security Capital U.S. Core Real Estate Securities Fund | CEEAX, CEERX, CEEFX, CEESX, CEECX |
| J.P. Morgan U.S. Real Estate Fund | SUSIX |
| Lazard U.S. Realty Equity Portfolio | LREIX, LREOX |
| Lazard U.S. Realty Income Portfolio | LRIIX, LRIOX |
| Manning & Napier Real Estate Series | MNRIX, MNREX |
| Morgan Stanley Institutional U.S. Real Estate Portfolio | MSUSX, MUSDX, MSULX, MURSX |
| Natixis AEW Real Estate Fund | NRFAX, NRFYX, NRFBX, NRFCX, NRFNX |
| Neuberger Berman Real Estate Fund | NBRIX, NBRFX, NREAX, NRERX, NRECX, NRREX |
| Nuveen Real Estate Securities Fund | FREAX, FARCX, FRSSX, FREBX, FRLCX, FREGX |
| Oppenheimer Real Estate Fund | OREAX, OREIX, OREYX, ORENX, OREBX, ORECX |
| PHOCAS Real Estate Fund | PHREX |
| PIMCO RealEstateRealReturn Strategy Fund | PRRSX, PETPX, PETAX, PETDX, PETCX, PETBX |
| Pioneer Real Estate Shares | PWREX, PYREX, PCREX, PBREX |
| Principal Real Estate Securities Fund | PIREX, PIRPX, PREPX, PRETX, PREJX, PRRAX, PRERX, PRENX, PRAEX, PRCEX, PRLEX |
| ProFunds Real Estate UltraSector ProFund | REPIX |
| Prudential Select Real Estate Fund | SREAX |
| Prudential U.S. Real Estate Fund | PJEAX, PJEZX, PJECX, PJEBX |
| REMS Real Estate Income 50/50 Portfolio | RREIX |
| REMS Real Estate Value-Opportunity Fund | HLRRX, HLPPX |
| Rydex Real Estate Fund | RYREX, RYHRX, RYCRX |
| SA Real Estate Securities Fund | SAREX |
| SEI Institutional Mgd Real Estate Fund | SETAX, SEIRX |
| Spirit of America Real Estate Income & Growth Fund | SOAAX |
| SSgA Clarion Real Estate Fund | SSREX |
| Stratton Real Estate Fund | STMDX |
| T.Rowe Price Real Estate Fund | TRREX, PAREX |
| TIAA-CREF Real Estate Securities Fund | TIREX, TRRPX, TRRSX, TCREX |
| Vanguard REIT Index Fund | VGSNX, VGRSX, VGSLX, VGSIX |
| Virtus Real Estate Securities Fund | PHRAX, PHRIX, PHRCX, PHRBX |
Source: NAREIT