
На чтение 5 мин Просмотров 261к.
Рассмотрим такой инвестиционный показатель как срок окупаемости инвестиций, его модификации, примеры и формулы расчета.
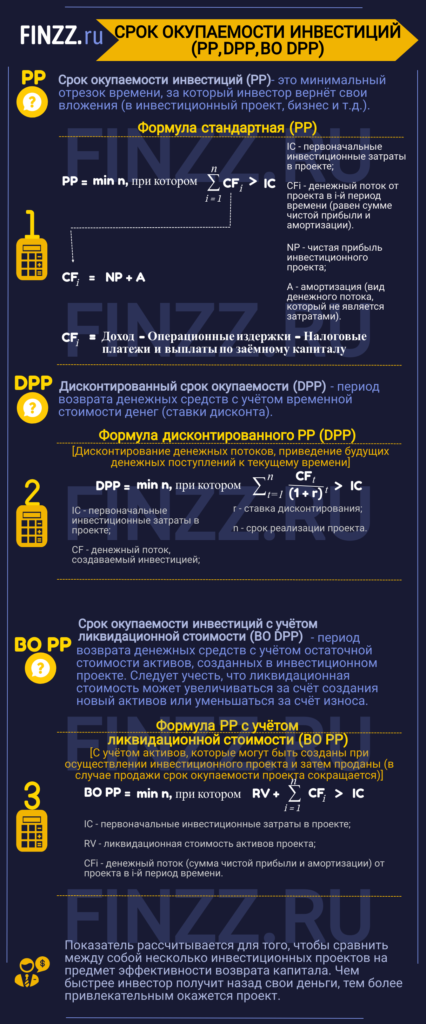
Срок окупаемости инвестиций (англ. PP, payback period) – это минимальный период времени возврата вложенных средств в инвестиционный проект, бизнес или любую другую инвестицию. Срок окупаемости является ключевым показателем оценки инвестиционной привлекательности бизнес плана, проекта и любого другого объекта инвестирования. Рассмотрим различные показатели срока окупаемости используемые на практике:
- Срок окупаемости инвестиций (PP).
- Дисконтированный срок окупаемости инвестиций (DPP).
- Срок окупаемости инвестиций с учетом ликвидационной стоимости (BO PP).
Содержание
- Инфографика: Срок окупаемости инвестиций (PP, DPP, BO DPP)
- #1 Срок окупаемости инвестиций (PP). Формула
- Cрок окупаемости инвестиций (PP). Пример расчета в Excel
- #2 Дисконтированный срок окупаемости инвестиций (DPP). Формула расчета
- Расчета дисконтированного срока окупаемости инвестиций в Excel
- Мастер-класс: «Как рассчитать срок окупаемости для бизнес плана: инструкция»
- #3 Срок окупаемости инвестиций с учетом ликвидационной стоимости
- Расчет срока окупаемости инвестиции с учетом ликвидационной стоимости в Excel
Инфографика: Срок окупаемости инвестиций (PP, DPP, BO DPP)
★ Инвестиционная оценка в Excel. Расчет NPV, IRR, DPP, PI за 5 минут
Данный показатель позволяет сравнивать между собой различные проекты по степени их эффективности возврата капитала.
#1 Срок окупаемости инвестиций (PP). Формула

где:
IC (Invest Capital) – первоначальные инвестиционные затраты в проекте;
CFi (Cash Flow) – денежный поток от проекта в i-й период времени, который представляет собой сумму чистой прибыли и амортизации.
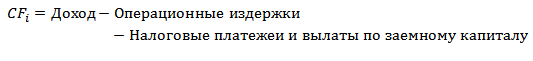
Для расчета денежного потока необходимо воспользоваться следующими формулами:
![]()
или
 где:
где:
А (Amortization) – амортизация, вид денежного потока, который не является затратами;
NP (Net Profit) – чистая прибыль инвестиционного проекта.
Cрок окупаемости инвестиций (PP). Пример расчета в Excel
Рассчитаем срок окупаемости инвестиций в проект с помощью программы Excel. Для этого необходимо определить первоначальные затраты, которые в нашем примере составили 100000 руб., далее необходимо спрогнозировать будущие денежные поступления (CF) и определить с какого периода сумма денежного потока превысит первоначальные инвестиционные затраты. На рисунке ниже показан расчет срока окупаемости проекта. Формула расчета денежного потока нарастающим итогом следующая:
Денежный поток нарастающим итогом (CF) =C6+D5
, бизнеса. Пример расчета в Excel")
На пятом месяце сумма денежных поступлений окупит первоначальные затраты, поэтому срок окупаемости составит 5 месяцев.
Основные недостатки использования данного показателя в оценке инвестиций заключаются:
- Отсутствие дисконтирования денежных потоков бизнес проекта.
- Не рассматриваются денежные поступления за пределами срока окупаемости.
#2 Дисконтированный срок окупаемости инвестиций (DPP). Формула расчета
Дисконтированный срок окупаемости (англ. DPP, Discounted Payback Period) – период возврата денежных средств с учетом временной стоимости денег (ставки дисконта). Главное отличие от простой формулы срока окупаемости – это дисконтирования денежных потоков и приведение будущих денежных поступлений к текущему времени.

где:
DPP (Discounted Payback Period) – дисконтированный срок окупаемости инвестиций;
IC (Invest Capital) – первоначальные инвестиционные затраты в проекте;
CF (Cash Flow) – денежный поток, создаваемый инвестицией;
r – ставка дисконтирования;
n – срок реализации проекта.
Рассмотрим пример оценки дисконтированного срока окупаемости инвестиций для бизнес-плана. Первоначальные инвестиции составили 100000 руб., денежный поток изменялся ежемесячно и отражен в столбце «С». Ставка дисконтирования была взята равной 10%. Для расчета дисконтированного денежного потока воспользуемся следующей формулой:
Дисконтированный денежный поток =C7/(1+$C$3)^A7
Денежные поступления нарастающим итогом =E7+D8

Проект окупится на 5 месяц, в котором денежные поступления составят 100860 руб.
Мастер-класс: «Как рассчитать срок окупаемости для бизнес плана: инструкция»
#3 Срок окупаемости инвестиций с учетом ликвидационной стоимости
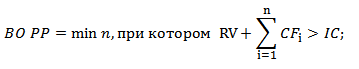
Срок окупаемости с учетом ликвидационной стоимости (англ. Bail-Out Payback Period) – представляет собой период возврата денежных средств с учетом остаточной стоимости активов, созданных в инвестиционном проекте. При осуществлении инвестиционного проекта могут создаваться активы, которые могут быть проданы (ликвидированы) в результате этого срок окупаемости проекта существенно сокращается.
где:
IC (Invest Capital) – первоначальные инвестиционные затраты в проекте;
RV (Residual Value)– ликвидационная стоимость активов проекта;
CFi (Cash Flow) – денежный поток от проекта в i-й период времени, который представляет собой сумму чистой прибыли и амортизации.
Ликвидационная стоимость может, как увеличиться в результате создания новых активов, так и уменьшаться за счет износа.
Расчет срока окупаемости инвестиции с учетом ликвидационной стоимости в Excel
На рисунке ниже показан расчет периода окупаемости проекта с учетом ликвидационной стоимости. Формула в Excel достаточно простая и имеет вид:
Денежные поступления с ликвидационной стоимостью =C6+E5+D6

В итоге, срок окупаемости с учетом ликвидационной стоимости составит ~4 лет. Данный способ оценки целесообразно применять при высокой ликвидности создаваемых активов. Как можно заметить, в данном варианте расчета срока окупаемости тоже может быть использована ставка дисконтирования.
Кроме срока окупаемости инвестиций существуют другие показатели оценки эффективности, позволяющие более точно провести анализ проекта. Более подробно о них вы можете узнать в статье: «6 методов оценки эффективности инвестиций в Excel. Пример расчета NPV, PP, DPP, IRR, ARR, PI«.
★ Инвестиционная оценка в Excel. Расчет NPV, IRR, DPP, PI за 5 минут
Резюме
Срок окупаемости является важнейшим показателем инвестиционного анализа проектов и бизнеса. Он позволяет определить целесообразность вложения в тот или иной проект. Использование дисконтирования денежных потоков и ликвидационной стоимости активов позволяет инвестору более точно оценить период возврата капитала. Помимо данного коэффициента необходим анализ через другие показатели эффективности: чистой приведенной стоимости (NPV), внутренней нормы доходности (IRR) индекса прибыльности (PI). Кроме точечной оценки необходим анализ динамики денежных потоков и их равномерность.
Автор: к.э.н. Жданов Иван Юрьевич
What is the Discounted Payback Period?
Discounted payback period refers to the time period required to recover its initial cash outlay and it is calculated by discounting the cash flows that are to be generated in future and then totaling the present value of future cash flows where discounting is done by the weighted average cost of capital or internal rate of return.
Table of contents
- What is the Discounted Payback Period?
- Discounted Payback Period Formula
- Example
- Example #2
- Example #3
- Discounted Payback Period Calculation in Excel
- Use and Relevance
- Discounted Payback Period Calculator
- Recommended Articles
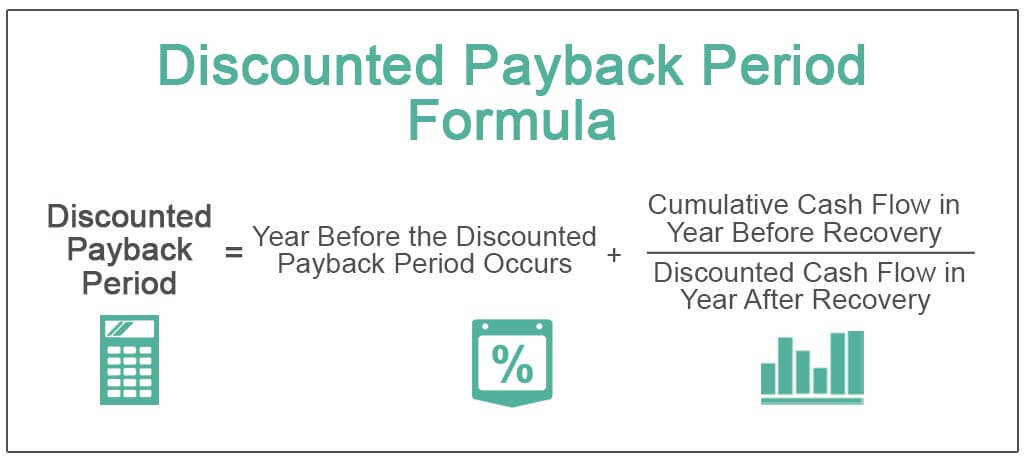
Discounted Payback Period Formula
Discounted Payback Period = Year Before the Discounted Payback Period Occurs + (Cumulative Cash Flow in Year Before Recovery / Discounted Cash Flow in Year After Recovery)
From a capital budgeting perspective, this method is a much better method than a simple payback period.
In this formula, there are two parts.
- The first part is “a year before the period occurs.” This is important because by taking the prior year, we can get the integer.
- The next part is the division between cumulative cash flow in the year before recovery and discounted cash flowDiscounted cash flow analysis is a method of analyzing the present value of a company, investment, or cash flow by adjusting future cash flows to the time value of money. This analysis assesses the present fair value of assets, projects, or companies by taking into account many factors such as inflation, risk, and cost of capital, as well as analyzing the company’s future performance.read more in the year after recovery. The purpose of this part is to find out the proportion of how much is yet to be recovered.
Example
You can download this Discounted Payback Period Excel Template here – Discounted Payback Period Excel Template
Funny Inc. would like to invest $150,000 into a project as an initial investment. The firm expects to generate $70,000 in the first year, $60,000 in the second year, and $60,000 in the third year. The + [Cost of Debt * % of Debt * (1-Tax Rate)]” url=”https://www.wallstreetmojo.com/weighted-average-cost-capital-wacc/”]weighted average cost of capital”The is 10%. Find out the discounted payback period of Funny Inc.
We will go step by step.
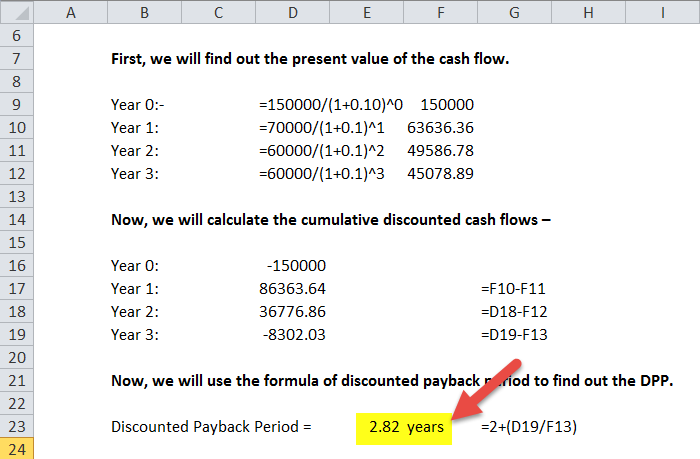
First, we will find out the present value of the cash flow.
Let’s look at the calculations.
Please note the formula of present value – PV = FV / (1+i) ^n
- Year 0: – $150,000 / (1+0.10) ^0 = $150,000
- Year 1: $70,000 / (1+0.10) ^1 = $63,636.36
- Year 2: $60,000 / (1+0.10) ^2 = $49,586.78
- Year 3: $60,000 / (1+0.10) ^3 = $45,078.89
Now, we will calculate the cumulative discounted cash flows –
- Year 0: – $150,000
- Year 1: – 86,363.64
- Year 2: – 36,776.86
- Year 3: $8,302.03
Discounted Payback Period = Year before the discounted payback period occurs + (Cumulative cash flow in year before recovery / Discounted cash flow in year after recovery)
= 2 + ($36.776.86 / $45,078.89) = 2 + 0.82 = 2.82 years.
Example #2
A project is having a cash outflow of $ 30,000 with annual cash inflows of $ 6,000, so let us calculate the discounted payback period, in this case, assuming companies WACC is 15% and the life of the project is 10 years.
| Year | Cash flow | Present value factorPresent value factor is factor which is used to indicate the present value of cash to be received in future and is based on time value of money. This PV factor is a number which is always less than one and is calculated by one divided by one plus the rate of interest to the power, i.e. number of periods over which payments are to be made.read more @ 15% | Present value of cash flows | Cumulative present value of cash flows |
|---|---|---|---|---|
| 1 | $ 6,000 | 0.870 | $ 5,220 | $ 5,220 |
| 2 | $ 6,000 | 0.756 | $ 4,536 | $ 9,756 |
| 3 | $ 6,000 | 0.658 | $ 3,948 | $ 13,704 |
| 4 | $ 6,000 | 0.572 | $ 3,432 | $ 17,136 |
| 5 | $ 6,000 | 0.497 | $ 2,982 | $ 20,118 |
| 6 | $ 6,000 | 0.432 | $ 2,592 | $ 22,710 |
| 7 | $ 6,000 | 0.376 | $ 2,256 | $ 24,966 |
| 8 | $ 6,000 | 0.327 | $ 1,962 | $ 26,928 |
| 9 | $ 6,000 | 0.284 | $ 1,704 | $ 28,632 |
| 10 | $ 6,000 | 0.247 | $ 1,482 | $ 30,114 |
In this case, the cumulative cash flows are $ 30,114 in the 10th year as, so the payback period is approx. 10 years
But, if you calculate the same in simple payback, the payback period is 5 years( $30,000/$6,000)
Please note that if the discount rate increases, the distortion between the simple rate of return and discounted payback period increases. Let me explain this further. Let us take the 10% discount rate in the above example and calculate the discounted payback period.
| Year | Cash flow | Present value factor @ 10% | Present value of cash flows | The cumulative present value of cash flows |
|---|---|---|---|---|
| 1 | $6,000 | 0.909 | $5,454 | $5,454 |
| 2 | $6,000 | 0.826 | $4,956 | $10,410 |
| 3 | $6,000 | 0.751 | $4,506 | $14,916 |
| 4 | $6,000 | 0.683 | $4,098 | $19,014 |
| 5 | $6,000 | 0.621 | $3,726 | $22,740 |
| 6 | $6,000 | 0.564 | $3,384 | $26,124 |
| 7 | $6,000 | 0.513 | $3,078 | $29,202 |
| 8 | $6,000 | 0.466 | $2,796 | $31,998 |
| 9 | $6,000 | 0.424 | $2,544 | $34,542 |
| 10 | $6,000 | 0.385 | $2,310 | $36,852 |
In this case, the discounting rate is 10% and the discounted payback period is around 8 years, whereas the discounted payback period is 10 years if the discount rate is 15%. But the simple payback period is 5 years in both cases. So, this means as the discount rate increases, the difference in payback periods of a discounted pay period and simple payback period increases.
| Discount Rate | Simple Payback(a) | Discounted Payback(b) | The difference in payback period (b)- (a) |
|---|---|---|---|
| 10% | 5 Years | 8 Years | 3 Years |
| 15% | 5 Years | 10 Years | 5 years |
I hope you guys got a reasonable understanding of what is payback period and discounted payback period. Let us take some more examples to understand the concept better.
Example #3
A company wants to replace its old semi-automatic machine with a new fully automatic machine. In the market, there are two models available in the market (Model A & Model B) at the cost of $ 5,00,000 each. The salvage valueSalvage value or scrap value is the estimated value of an asset after its useful life is over. For example, if a company’s machinery has a 5-year life and is only valued $5000 at the end of that time, the salvage value is $5000.read more of an old machine is $ 1,00,000.The utilities of existing machinery that can be used are company purchases model A, and additional utilities to be bought are only $1,00,000. However, in case the company buys the model B, then all the existing utilities will have to be replaced, and new utilities cost$ 2,00,000, and a salvage value of old utilities is $20,000. The cash flows expected are as follows, and the discount rate is 15%
| Year | A | B |
|---|---|---|
| 1 | $ 1,00,000 | $ 2,00,000 |
| 2 | $ 1,50,000 | $ 2,10,000 |
| 3 | $ 1,80,000 | $ 1,80,000 |
| 4 | $ 2,00,000 | $ 1,70,000 |
| 5 | $ 1,70,000 | $ 40,000 |
| Salvage value expected | $ 50,000 | $ 60,000 |
Expenditure at Year of investment (Year Zero)
| Particulars | A | B |
|---|---|---|
| Cost of machine | $ 5,00,000 | $ 5,00,000 |
| Cost of utilities | $ 1,00,000 | $ 2,00,000 |
| Salvage of old machine | ($ 1,00,000) | ($ 1,00,000) |
| Salvage of old machine | – | ($ 20,000) |
| Total Exp | $ 5,00,000 | $ 5,80,000 |
| Year | Present value factorPresent value factor is factor which is used to indicate the present value of cash to be received in future and is based on time value of money. This PV factor is a number which is always less than one and is calculated by one divided by one plus the rate of interest to the power, i.e. number of periods over which payments are to be made.read more @ 15% | Cash inflows (Machine A) | Present value of cash flows (Machine A) | Cumulative present value of cash flows (Machine A) | Cash inflows (Machine B) | Present value of cash flows (Machine B) | Cumulative present value of cash flows (Machine B) |
|---|---|---|---|---|---|---|---|
| 0 (As calculated above) |
1.00 | $500,000 | $500,000 | $500,000 | $580,000 | $580,000 | $580,000 |
| 1 | 0.87 | $100,000 | $87,000 | $87,000 | $200,000 | $174,000 | $174,000 |
| 2 | 0.76 | $150,000 | $114,000 | $201,000 | $210,000 | $159,600 | $333,600 |
| 3 | 0.66 | $180,000 | $118,800 | $319,800 | $180,000 | $118,800 | $452,400 |
| 4 | 0.57 | $200,000 | $114,000 | $433,800 | $170,000 | $96,900 | $549,300 |
| 5(Including salvage value of $ 50,000 for Mach A and $ 60,000 for Mach B) | 0.50 | $ 170000+ $50,000 | $110,000 | $543,800 | $100,000 | $50,000 | $599,300 |
In this case, the discounted payback for Machine A is as follows…
Machine A is getting $ 4,33,800 at the end of year 4, and only $66,200($50000-$433800) has to get in year 5. So, payback here is …
4 years+ (66,200/1,10,000) = 4.6 Years
Machine B is getting $ 5,49,300 at the end of year 4 and only $30,700 ($5,80,000- $5,49,300) has to get in year 5. So, payback here is …
4 years+ (30,700/50,000) = 4.6 Years
The discounted payback in both cases is the same.
Discounted Payback Period Calculation in Excel
Let us now do the same example above in Excel.
This is very simple. You need to provide the two inputs of Cumulative cash flow in a year before recovery and Discounted cash flow in a year after recovery. You can easily calculate the period in the template provided.
Use and Relevance
- The discounted payback period is a better option for calculating how much time a project would get back its initial investment; because, in a simple payback period, there’s no consideration for the time value of moneyThe Time Value of Money (TVM) principle states that money received in the present is of higher worth than money received in the future because money received now can be invested and used to generate cash flows to the enterprise in the future in the form of interest or from future investment appreciation and reinvestment.read more.
- It can’t be called the best formula for finding out the payback period.
- But from the perspective of capital budgetingCapital budgeting is the planning process for the long-term investment that determines whether the projects are fruitful for the business and will provide the required returns in the future years or not. It is essential because capital expenditure requires a considerable amount of funds.read more and accuracy, this method is far superior to a simple payback period; because in a simple payback period, there is no consideration for the time value of money and cost of capital.
- Many managers have been shifting their focus from a simple payback period to a discounted payback period to find a more accurate estimation of tenure for recouping the initial investments of their firms.
Discounted Payback Period Calculator
You can use the following Calculator
| Year before the discounted payback period occurs | |
| Cumulative cash flow in year before recovery | |
| Discounted cash flow in year after recovery | |
| Discounted Payback Period Formula = | |
| Discounted Payback Period Formula = | Year before the discounted payback period occurs + |
|
|||||||||
|
Recommended Articles
This has been a guide to the discounted payback period and its meaning. Here we learn how to calculate a discounted period using its formula along with practical examples. Here we also provide you with a discounted payback period calculator with a downloadable excel template.
- Discount on Bonds PayableDiscount on bonds payable is the markdown value of a bond’s coupon rate or selling price compared to its market interest rate or fair value. Such bonds trade at a lower price than their face value.read more
- DCF FormulaDiscounted Cash Flow (DCF) formula is an Income-based valuation approach and helps in determining the fair value of a business or security by discounting the future expected cash flows. Under this method, the expected future cash flows are projected up to the life of the business or asset in question, and the said cash flows are discounted by a rate called the Discount Rate to arrive at the Present Value.read more
- Reporting Period MeaningA reporting period is a month, quarter, or year during which an organization’s financial statements are prepared for external use uniformly across a period of time in order for the general public and users to interpret and evaluate the financial statements.read more
- Calculate Average Payment PeriodAverage payment period refers to the average time period taken by an organization for paying off its dues with respect to purchases of materials that are bought on the credit basis from the suppliers of the company. It doesn’t necessarily have any impact on the company’s working capital.read more
Contents
- 1 How do you find the discounted payback period?
- 2 What is discounted payback period with example?
- 3 How do you find the discount period in accounting?
- 4 How do you calculate payback period and NPV?
- 5 How do you calculate discount period in Excel?
- 6 How do you calculate discounted cash flows?
- 7 What is the payback period model?
- 8 What is a discount period *?
- 9 How do you calculate discount rate for NPV in Excel?
- 10 What is the NPV formula in Excel?
- 11 How do you calculate discount rate for NPV?
- 12 What is the formula to calculate discount?
- 13 How do you take 20% off in Excel?
- 14 How is discounted value calculated?
- 15 How do you find the discounted cash flow terminal value?
- 16 What is discount period in DCF?
- 17 How is credit period calculated?
- 18 How do we calculate net sales?
- 19 How do you calculate discount factor discount rate?
When the negative cumulative discounted cash flows become positive, or recover, DPB occurs. Discounted payback period is calculated by the formula: DPB = Year before DPB occurs + Cumulative Discounted Cash flow in year before recovery ÷ Discounted cash flow in year after recovery.
What is discounted payback period with example?
The discounted payback period process is applied to each additional period’s cash inflow to find the point at which the inflows equal the outflows. At this point, the project’s initial cost has been paid off, with the payback period being reduced to zero.
How do you find the discount period in accounting?
The discount period is the period between the last day on which the discount terms are still valid and the date when the invoice is normally due. For example, if the discount must be taken within 10 days, with normal payment due in 30 days, then the discount period is 20 days.
How do you calculate payback period and NPV?
To calculate the payback period you can use the mathematical formula: Payback Period = Initial investment / Cash flow per year For example, you have invested Rs 1,00,000 with an annual payback of Rs 20,000. Payback Period = 1,00,000/20,000 = 5 years.
How do you calculate discount period in Excel?
Discount Factor = 1 / (1 * (1 + Discount Rate)Period Number)
- Discount Factor = 1 / (1 * (1 + 10%) ^ 2)
- Discount Factor = 0.83.
How do you calculate discounted cash flows?
Here is the DCF formula:
- CF = Cash Flow in the Period.
- r = the interest rate or discount rate.
- n = the period number.
- If you pay less than the DCF value, your rate of return will be higher than the discount rate.
- If you pay more than the DCF value, your rate of return will be lower than the discount.
What is the payback period model?
The payback period is a method commonly used by investors, financial professionals, and corporations to calculate investment returns. It helps someone determine how long it takes to recover their initial investment costs.It is the cost of the investment divided by the average annual cash flow.
What is a discount period *?
Discount period. The period during which a customer can deduct the discount from the net amount of the bill when making payment.
How do you calculate discount rate for NPV in Excel?
How to Use the NPV Formula in Excel
- =NPV(discount rate, series of cash flow)
- Step 1: Set a discount rate in a cell.
- Step 2: Establish a series of cash flows (must be in consecutive cells).
- Step 3: Type “=NPV(“ and select the discount rate “,” then select the cash flow cells and “)”.
What is the NPV formula in Excel?
The NPV formula. It’s important to understand exactly how the NPV formula works in Excel and the math behind it. NPV = F / [ (1 + r)^n ] where, PV = Present Value, F = Future payment (cash flow), r = Discount rate, n = the number of periods in the future is based on future cash flows.
How do you calculate discount rate for NPV?
It’s the rate of return that the investors expect or the cost of borrowing money. If shareholders expect a 12% return, that is the discount rate the company will use to calculate NPV. If the firm pays 4% interest on its debt, then it may use that figure as the discount rate.
What is the formula to calculate discount?
Multiply the original price by the decimal
Take the original price of the item and multiply it by the decimal determined in step one. Example: Winter boots originally sold for $147. Multiply $147 by 0.25 to find the amount of the discount. $145 x 0.25 = $36.75, so the boots are discounted by $36.75.
How do you take 20% off in Excel?
If you want to calculate a percentage of a number in Excel, simply multiply the percentage value by the number that you want the percentage of. For example, if you want to calculate 20% of 500, multiply 20% by 500.
How is discounted value calculated?
For example, to calculate discount factor for a cash flow one year in the future, you could simply divide 1 by the interest rate plus 1. For an interest rate of 5%, the discount factor would be 1 divided by 1.05, or 95%.
How do you find the discounted cash flow terminal value?
Terminal value is calculated by dividing the last cash flow forecast by the difference between the discount rate and terminal growth rate. The terminal value calculation estimates the value of the company after the forecast period.
What is discount period in DCF?
You use it to represent the fact that a company’s cash flow does not come 100% at the end of each year – instead, it comes in evenly throughout each year. In a DCF without mid-year convention, we would use discount period numbers of 1 for the first year, 2 for the second year, 3 for the third year, and so on.
How is credit period calculated?
The Credit Period Formula
It is found by dividing the number of days in a period, in this case, a year, by the receivables turnover for that same time period.
How do we calculate net sales?
So, the formula for net sales is:
- Net Sales = Gross Sales – Returns – Allowances – Discounts.
- Gross sales: the total unadjusted sales of a business before discounts, allowance and returns.
- Returns: the return of goods for a refund of payment.
- Allowances: price reductions for defective or damaged goods.
How do you calculate discount factor discount rate?
For example, to calculate discount factor for a cash flow one year in the future, you could simply divide 1 by the interest rate plus 1. For an interest rate of 5%, the discount factor would be 1 divided by 1.05, or 95%.
Содержание
- Определение срока окупаемости
- Как рассчитать окупаемость проекта?
- Формула расчета простого срока окупаемости
- Ограничения для использования формулы
- Графическая модель чистого денежного потока проекта и срока окупаемости
- Пример расчета простого срока окупаемости
- Дисконтированный срок окупаемости
- Формула расчета дисконтированного срока окупаемости
- Пример расчета дисконтированного срока окупаемости
- Графическая модель сравнения простого и дисконтированного срока окупаемости
При расчете показателей проекта временные рамки являются наиболее важными показателями. С помощью них можно оценить не только срок жизни проекта, но и период возврата инвестиций. Именно для оценки скорости возврата вложений и применяется показатель срок окупаемости.
Для расчета срока окупаемости инвестиций существуют два вида показателей: простой и дисконтированный.
Определение срока окупаемости
Простой срок окупаемости (PP – payback period) – это период времени, за который сумма чистого денежного потока сможет покрыть все расходы, вложенные в запуск проекта, то есть первоначальные инвестиции.
Данный показатель, как правило, измеряется в годах и/или месяцах. Хотя может и в других величинах, например, кварталах.
Однако желательно, что бы единицы его измерения совпадали с размерностью шага горизонта расчета.
Для инвесторов недисконтированный срок окупаемости является базовым и наиболее простым в расчетах. С его помощью можно принять решение о вложении имеющихся денежных средств в тот или иной проект. Так, к примеру, если показатель будет меньше или хотя бы равен ожиданиям инвестора и не превышать горизонт расчета, то такой проект можно принять к реализации.
Хотя для полноты понимания эффективности вложений, необходимо оценить и другие показатели. К таким показателям могут быть отнесены: чистый доход, средняя норма прибыльности, индекс доходности и т.д.
При принятии решения о кредитовании проекта этот показатель также важен, поскольку может оказывать существенное влияние на выбор срока кредита. Для многих банков временные рамки для запуска нового бизнеса являются обязательным критерием.
Как рассчитать окупаемость проекта?
Формула расчета простого срока окупаемости
Простой срок окупаемости инвестиционного проекта рассчитывается по следующей формуле:

где I – первоначальные инвестиции; CFt– денежные потоки за период; Т – горизонт планирования.
Ограничения для использования формулы
Расчет простого срока окупаемости будет полностью корректным только при соблюдении следующих условий:
- Вложения в проект осуществляются только в предынвестиционном периоде, то есть на старте проекта и являются единовременными;
- Равный отчетный период (для сравнения разных проектов по данному показателю);
- Доход поступает постоянно и равными платежами (допустимо незначительное отклонение).
Графическая модель чистого денежного потока проекта и срока окупаемости

Исходя из рисунка можно отметить, что период окупаемости находится в той точке, в которой накопленный денежный поток проекта переходит из отрицательной области в положительную.
Пример расчета простого срока окупаемости
Рассмотрим пример расчета срока окупаемости, в том числе и с использованием программы Excel.
Ниже приведены данные по размерам инвестиций, а также операционных доходов и расходов.
На основании имеющихся данных определим срок окупаемости, предварительно рассчитав величину чистого денежного потока. Для этого учтем все доходы и расходы (затраты) по проекту. На основе этих данных определим, через какой период вложения вернутся инвестору.


Для нахождения простого срока окупаемости данного инвестиционного проекта поделим первоначальные инвестиции на средний чистый денежный поток. Получим следующее выражение:
Так как ответ – дробное число (2,4 года), его можно преобразовать в года и месяца, так как ПСО измеряется именно в этих величинах. Перевод дробной части в месяцы осуществляется путем умножения её на 12 месяцев и округление полученной суммы.
Вывод: Так как 2 года и 5 месяцев меньше, чем горизонт планирования, равный 4 годам, то можно сделать вывод, что нормативный показатель соблюден и проект по простому показателю является инвестиционно-привлекательным.

Дисконтированный срок окупаемости
В реальной жизни доходы, поступающие от проекта, со временем изменяют свою покупательную стоимость, так как в обществе присутствует инфляция – изменение стоимости денег с течением времени. Именно поэтому существует такой показатель, как дисконтированный срок окупаемости инвестиций.
Он применяется для того, чтобы учесть данные изменения. Он основывается на том, что стоимость будущих доходов приводится к настоящему времени.
Перед началом расчетов дисконтированного срока окупаемости, нужно определиться со ставкой дисконтирования, которая должна отражать альтернативные издержки вложения капитала в тот или иной проект. Более подробно о выборе ставки дисконтирования можно прочитать здесь.
Формула расчета дисконтированного срока окупаемости
Дисконтированный срок окупаемости (DPP – Discounted Payback Period) инвестиционного проекта рассчитывается по следующей формуле:

где CFt – денежный поток в момент t; r – ставка дисконтирования; I – инвестиции.
Дисконтированный срок окупаемости инвестиционного проекта рассчитывается по следующей формуле:

где Т – горизонт планирования.
Пример расчета дисконтированного срока окупаемости
Далее рассмотрим пример расчета дисконтированного срока окупаемости в программе Excel. Исходные данные для задачи совпадают с данными, которые были использованы для расчета простого показателя выше.


Для нахождения дисконтированного срока окупаемости инвестиционного проекта разделим первоначальные инвестиции на средний дисконтированный денежный поток. Получим следующее выражение:

Вывод: Дисконтированный срок окупаемости не превышает горизонт планирования проекта. Следовательно можно считать, что нормативный показатель соблюден и проект является инвестиционно-привлекательным. Однако, если в ставке дисконтирования не заложена нормальная прибыль предпринимателя, а проект через 4 года (горизонт расчета) продолжать не планируется, то стоит это учесть при принятии решения об осуществлении проекта, несмотря на то, что полученное значение соответствует критерию отбора.
Графическая модель сравнения простого и дисконтированного срока окупаемости

По данным рисунка можно заметить, что простой срок окупаемости отличается от дисконтированного только пройденным периодом времени с момента запуска проекта и его выходом в нулевую точку – точку безубыточности проекта. Это связано с тем, что при расчете ДСО учитывается ставка дисконтирования, которая прямо связана со стоимостью денег во времени.
What Is a Payback Period?
The payback period is the amount of time (usually measured in years) it takes to recover an initial investment outlay, as measured in after-tax cash flows. It is an important calculation used in capital budgeting to help evaluate capital investments. For example, if a payback period is stated as 2.5 years, it means it will take 2½ years to receive your entire initial investment back.
Key Takeaways
- The payback period is the amount of time needed to recover an initial investment outlay.
- The main advantage of the payback period for evaluating projects is its simplicity.
- A few disadvantages of using this method are that it does not consider the time value of money and it does not assess the risk involved with each project.
- Microsoft Excel provides an easy way to calculate payback periods.
- The formula for calculating the payback period is the initial investment divided by incoming cash flows.
Advantages and Disadvantages of the Payback Period
One primary advantage of evaluating a project or an asset by its payback period is that it is straightforward. Basically, you’re asking: «How many years until this investment breaks even?» It is also easy to apply across several projects. When analyzing which project to undertake or invest in, you could consider the project with the shortest payback period.
The discounted payback period determines the payback period using the time value of money.
But there are a few important disadvantages that disqualify the payback period from being a primary factor in making investment decisions. First, it ignores the time value of money, which is a critical component of capital budgeting. For example, three projects can have the same payback period; however, they could have varying flows of cash.
Without considering the time value of money, it is difficult or impossible to determine which project is worth considering. Also, the payback period does not assess the riskiness of the project. Projecting a break-even time in years means little if the after-tax cash flow estimates don’t materialize.
How to Calculate the Payback Period in Excel
Financial modeling best practices require calculations to be transparent and easily auditable. The trouble with piling all of the calculations into a formula is that you can’t easily see what numbers go where or what numbers are user inputs or hard-coded.
The easiest method to audit and understand is to have all the data in one table and then break out the calculations line by line.
Calculating the payback period by hand is somewhat complex. Here is a brief outline of the steps to calculate it in Excel, with the exact formulas in the table below (note: if it’s hard to read, right-click and view it in a new tab to see full resolution):
- Enter the initial investment in the Time Zero column/Initial Outlay row.
- Enter after-tax cash flows (CF) for each year in the Year column/After-Tax Cash Flow row.
- Calculate cumulative cash flows (CCC) for each year and enter the result in the Year X column/Cumulative Cash Flows row.
- Add a Fraction Row, which finds the percentage of remaining negative CCC as a proportion of the first positive CCC.
- Count the number of full years the CCC was negative.
- Count the fraction year the CCC was negative.
- Add the last two steps to get the exact amount of time in years it will take to break even.
What Is the Formula for Payback Period in Excel?
Calculating the payback period in Excel is the simplest when the annual cash flows are the same for each year. First, input the initial investment into a cell (e.g., A3). Then, enter the annual cash flow into another (e.g., A4). To calculate the payback period, enter the following formula in an empty cell: «=A3/A4» as the payback period is calculated by dividing the initial investment by the annual cash inflow.
How Do I Calculate a Discounted Payback Period in Excel?
The discounted payback period is the number of years it takes to pay back the initial investment after discounting cash flows. In Excel, create a cell for the discounted rate and columns for the year, cash flows, the present value of the cash flows, and the cumulative cash flow balance. Input the known values (year, cash flows, and discount rate) in their respective cells. Use Excel’s present value formula to calculate the present value of cash flows.
To calculate the cumulative cash flow balance, add the present value of cash flows to the previous year’s balance. The cash flow balance in year zero is negative as it marks the initial outlay of capital. Therefore, the cumulative cash flow balance in year 1 equals the negative balance from year 0 plus the present value of cash flows from year 1. Identify the last year in which the cumulative balance was negative. The discounted payback period is calculated by adding the year to the absolute value of the period’s cumulative cash flow balance and dividing it by the following year’s present value of cash flows.
How Do You Calculate Payback Period?
The payback period is calculated by dividing the initial capital outlay of an investment by the annual cash flow.
Payback Period = Initial Investment / Annual Cash Flow