
In this tutorial, you’ll learn how to download and install DAX Studio and Tabular Editor 3 in your computer, and how to configure them for use in Power BI and in Excel.
This demonstration includes a detailed step-by-step instruction. Some points to remember are also included to ensure that you have a seamless experience when using these tools in Power BI.
Download DAX Studio
To install DAX Studio, you need to do a Google search. Look for the official website of DAX Studio.

On the homepage, you’ll notice a green button which says DAX Studio v2.17.3. Clicking this will install the DAX Studio application in your system.

If you don’t want an installation on your system, you can also use a portable version. This second option is most helpful when your organization doesn’t allow installations from any external tool or application.
However, when using the portable version, you won’t be able to call DAX Studio within Power BI or MS Excel. And this becomes a nuisance when you’re doing the same thing over again.
Before starting the download, check the changelog to view the fixes that have been done on the version of the DAX Studio you’re downloading. If you click changelog, you can see that two fixes have been made.

In case you want to look at a more detailed log of the changes for each version, click the here option. You’ll then see the bugs and fixes for each version.

You can read that to understand the improvements that have been made over time or monitor for specific updates you want.
Install DAX Studio For Use In Power BI
Once you download the application, it’s then time to install it. Choose the recommended settings.

For selecting the components, it’s recommended to choose Custom because it allows you to include or exclude an Excel Addin.

But if you’ve already decided to download all the components, choose Full Install.
Moreover, for the Additional Tasks, it’s recommended to keep the second option unchecked since this tutorial is going to use the DAX formatting capability of DAX Studio.

If you check that option, you won’t be able to instantaneously format the DAX code inside DAX Studio.
When you’re done configuring the installation details, click Install and then Finish.

Once done, DAX Studio will then automatically launch and you can check if it has been installed correctly.

Open DAX Studio In Power BI
You need to relaunch Power BI to be able to see the External Tools option.

Click External Tools and then DAX Studio. If this launches, then you’ve successfully installed DAX Studio in Power BI.
Take note that if you installed the portable version, this option will not be made available to you.
Install DAX Studio In Excel
You can also install DAX Studio in Excel. First, open Excel and go to the Developer tab.

You can see that the DAX Studio add-in is not yet visible.

To enable it, go to the COM Add-ins option.

Check the DAX Studio Excel Add-in option and then click Okay.

Depending on your version of Excel, the DAX Studio Add-in may not appear right away. If this happens, simply restart Excel. You’ll then see the Add-ins option with DAX Studio.

Install Tabular Editor
The next thing you need to do is install Tabular Editor.
Go to Google and search for Tabular Editor 3. Make sure to click on the official website.

Once you’re on the website, go to Downloads.

Depending on the architecture of your system, choose to install either the 64-bit or 32-bit version.

Once the application has been downloaded, begin the installation. Choose the recommended or default settings. Continue choosing Next after each configuration. Once done, click Install and then Finish.

When Tabular Editor is launched, a window will appear saying that Tabular Editor needs to be activated.

If you don’t have a license, you can use a free trial period good for 30 days.

Restart Power BI to ensure that Tabular Editor works properly.
***** Related Links *****
Query Performance And DAX Studio Setup
What Is DAX Studio In Power BI Desktop
DAX Coding Inside Tabular Editor 3
Conclusion
To learn more about how to use Tabular Editor 3, you can view this Enterprise DNA course. Through this course, you’ll learn how to optimize your workflow in Power BI or analysis services.
This tutorial was a quick run through of how to install DAX Studio and Tabular Editor 3 in Power BI and in Excel. Do take note that if you downloaded the portable version, some functionalities will not be available to you. So, make sure to carefully follow the steps to avoid any problems in the future.
Enterprise DNA Experts


Build Status
| Branch | Status |
|---|---|
| master |  |
| develop | |
Building Dax Studio
All of the dependencies for DAX Studio are available as nuget packages,
so doing a nuget restore should be enough to build this solution in Visual Studio 2022
When preparing to make changes in order to submit a pull request you should create a feature
branch off the develop branch. The develop branch contains the current development build of the code
including any new features. The master branch only contains the code for the last stable release.
(we merge from develop to master when doing a public release)
See the following for details about debugging DAX Studio
TL;DR
We can
connect almost any data source in Power Query, but PowerPivot data model is not
included in that extensive list of sources out of the box.
But with
the help of the fabulous DAX Studio we can do it (although in my opinion it is
still inconvenient and tricky) at least locally – from the same workbook in Excel
or from Power BI Desktop.
All you
need is to open your Excel workbook, run DAX Studio add-in and connect it to
this workbook. Then you can just connect to the PowerPivot model as to SQL
Server Analysis Services cube.
But this is
an undocumented and extremely limited feature not supported by Microsoft, which
can only be used under your own risk.
Step 1: Ready…
First, we
need the Source. In other words, the Excel workbook with some data, loaded to
the PowerPivot data model. If you can see a table in the PowerPivot window, it
is good.
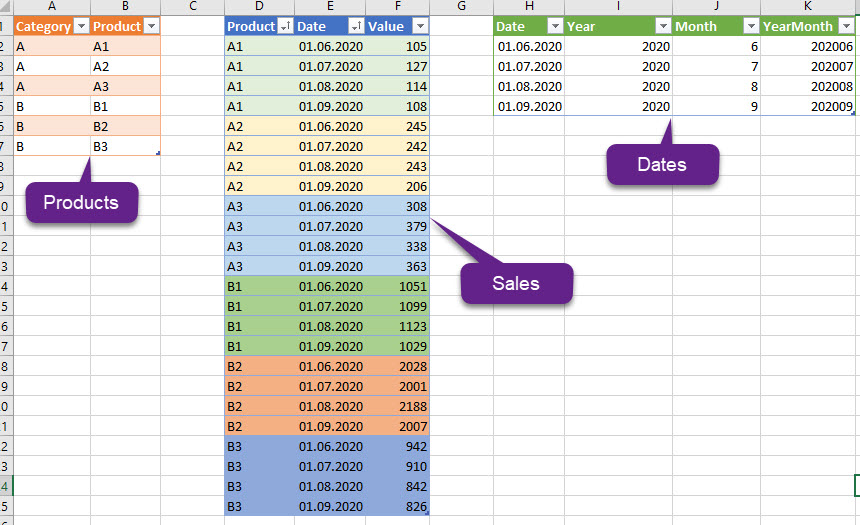
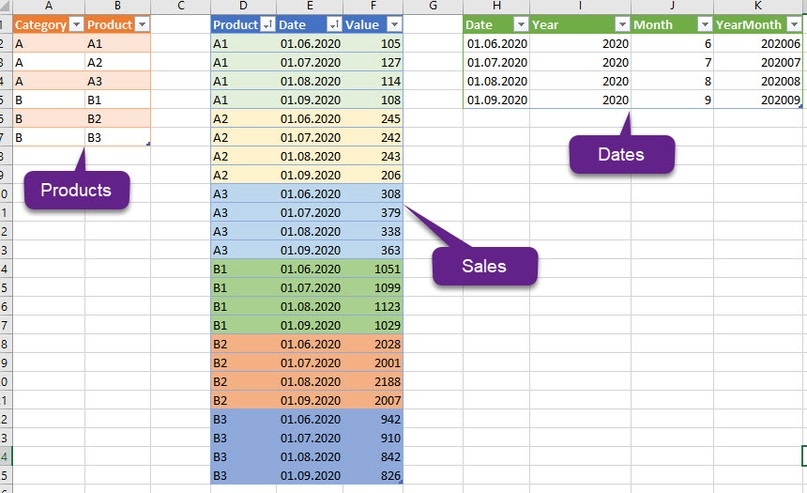
I have a
workbook with these sample tables:
which form this simple data model:
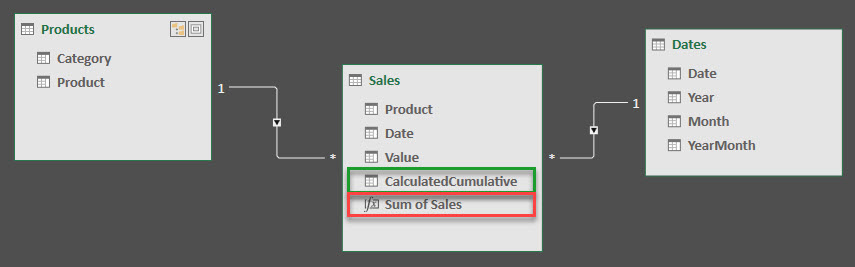
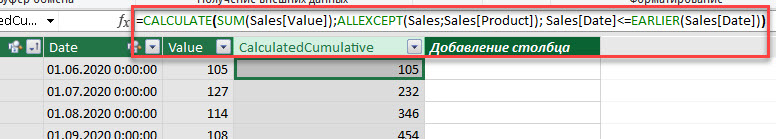
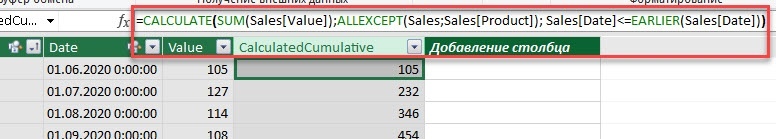
In the ‘Sales’ table I have already created the calculated column to calculate cumulative total for the product by date:
And the simple measure:
|
Sum of Sales := SUM(Sales[Value]) |
The source of
tables in PowerPivot model is the tables from this workbook, but they could also
be from Power Query.
Second, we
need DAX Studio add-in for Excel installed. If you are working with
Power BI or PowerPivot and do not have DAX Studio installed, I have bad news
for you… If so, or if you haven’t installed add-in for Excel, go to the https://daxstudio.org/, click the big green button to download
the latest release and install it. During the installation, do not forget to
install not only application alone, but the Excel add-in, too. It is
necessary.
Step 2: Steady…
To connect
Power Query to your workbook data model, open your workbook :). For some
reasons I insist that only this workbook is opened! This and only this one. If several
workbooks are opened simultaneously, there could be mess and problems.
Run DAX
Studio add-in from the “Add-ins” ribbon group in Excel. After the DAX Studio
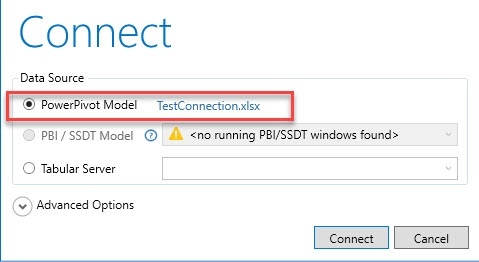
starts, you will see connection window, where you must select the first option:
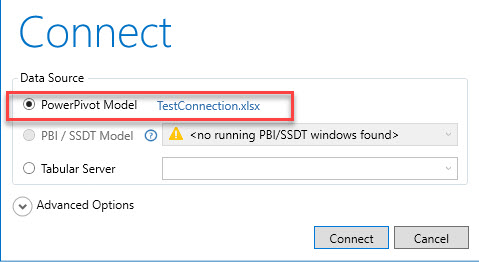
Click “Connect”.
After the connection is established, do not close DAX Studio, it must be
running. You can minimize it if you want.
Now all is
ready to connect.
Step 3: Go!
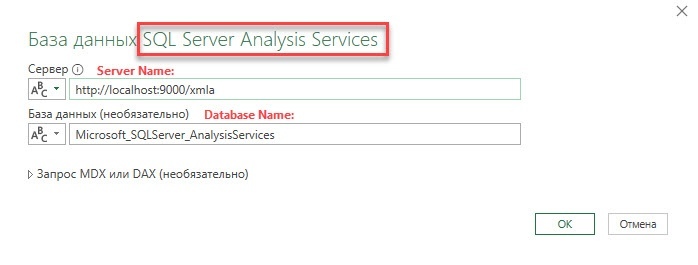
Now go to
the Power Query and connect to the «SQL Server Analysis Services database
(import)».
We need to know
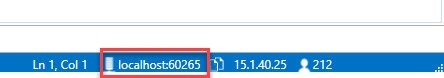
the server address for it. If this connection was to some server or Power BI
Desktop, we could then see its address in the bottom right corner of DAX Studio
window:
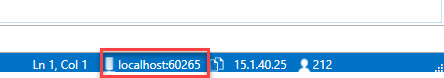
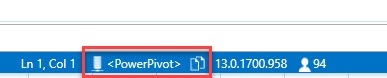
But when connected to the Excel file, we see only this:

No server name, no address, no port number.
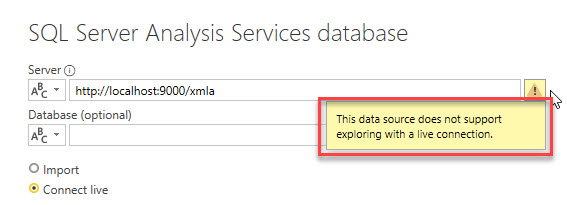
Now I
reveal the main secret:
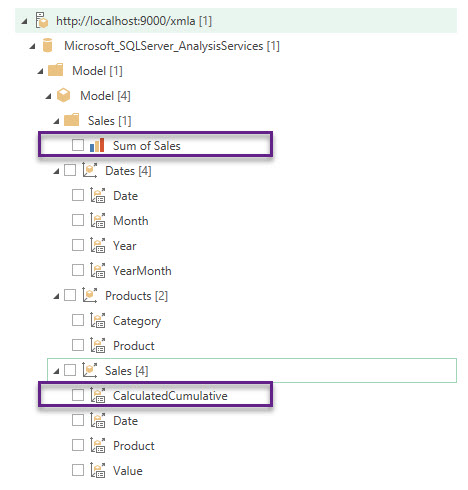
You need to use http://localhost:9000/xmla as the server name/address. That’s all.
Of course, you can also use this database name (it is necessary to write it down if you want to use custom MDX or DAX query in connection): “Microsoft_SQLServer_AnalysisServices”

How did I
reveal this address is too TL;DR even for me 😊. You need to know that these server address and database name are always
the same, at least, at the time when I write this post, so you don’t need
to search for the server address every time.
When Power
Query asks you about the data source credentials, just use your current Windows
authorization (sorry if you cannot read the screenshot in Russian, just look which
options I selected):

Ta-dam!!!
Now you see the model, all its calculated columns and measures as the OLAP cube. You can build any tables you need from it.
If you are
familiar with MD cubes and their behavior, then you are ok 😊 If no, you will need some time to adjust to
cubes logic and use.
Read PowerPivot model from
Power BI
If for some
reason you do not want to import Excel data model in Power BI, you can use this
trick to connect to PowerPivot in Power BI Desktop. But again, only in import
mode, no live connection.
All the steps are THE SAME.
Purposes
For me,
this trick is one of the long “just because I can” list. To be honest, I do not
see any useful applications for this connection today. It is too tricky, limited
to manual refresh, and cannot be used across other workbooks. But if you have
an urgent need to extract some data from the Excel data model to PQ, you can
use this approach carefully. For example, you may need to do some data mashup
operations in Power Query, but some of them are too complex in Power Query and
have a very bad performance there (usually it is about mashups which require a
lot of scans of the same table), or there are other reasons to do some
calculations in DAX rather than in M. You can export mid-step results in the
data model and perform required calculations in PowerPivot, then read it again
in the Power Query.
Or you can use it to perform any suitable MDX or DAX query over your data:
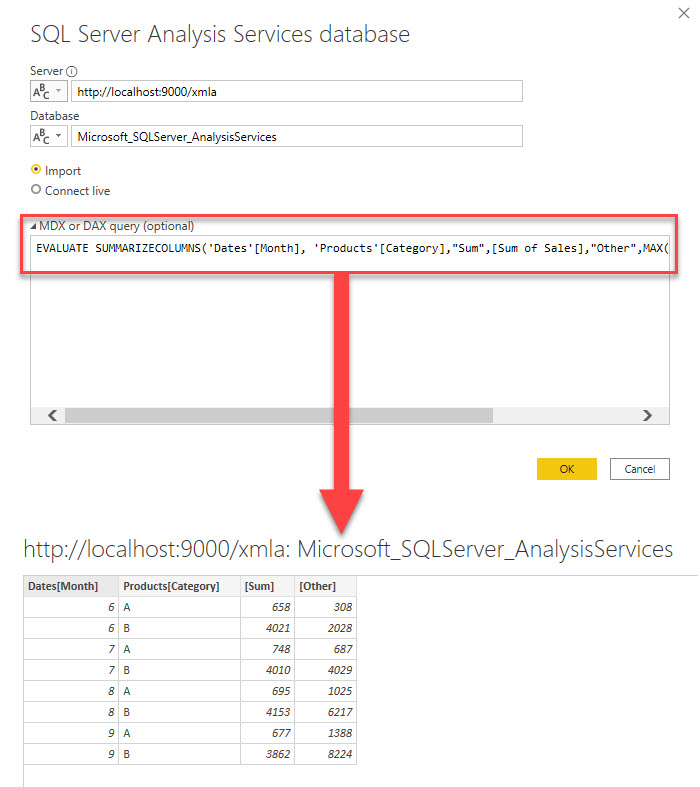
I think that there could be other needs which could be satisfied with this trick and which I did not meet yet. If you have some in mind do not hesitate to share.
Cautions and known
problems
- This is undocumented
- This is unsupported
- This could change any moment, no guarantee.
- When connecting from Power BI
Desktop, be sure that only one workbook is opened – at least, only one workbook
with data model in it - No, I do not know how to read PowerPivot
model in another workbook. All my attempts failed; you only see the data model
from this one workbook. - To get correct refresh order of your
queries and tables, you need to do it manually (or via VBA macro). Clicking “Refresh
All” button in Excel do not guarantee refresh order, so not all your changes
could be reflected correctly. Or press “Refresh All” twice.
There are a lot of other interesting things and pitfalls with this connection, but I don’t want to spend too much time on it now. At least not until I see a good reason or a use case for it.
Good luck!
Follow me:
Share this:
Содержание
- Getting Connected
- Connecting to PowerPivot in Excel
- Connecting to Power BI Desktop
- Connecting to SSDT (SQL Server Developer Tools)
- Connecting to Analysis Services
- Connecting to Azure Analysis Services
- Connecting to Power BI Premium XMLA Endpoint
- Power Query Connection to Excel PowerPivot Data Model
- Step 1: Ready…
- Step 2: Steady…
- Step 3: Go!
- Ta-dam.
- Read PowerPivot model from Power BI
- Purposes
- Cautions and known problems
- I can not get Dax Studio to Install (Excel Add In) #55
- Comments
- Checking Operating System
- Checking .Net Framework
- Checking AMO
- Checking ADOMD.NET
- Dax Studio Configuration
- Checking Excel Add-in
Getting Connected
There are a number of different connection options in DAX Studio the following guid will run through all the different data sources that you can connect to.
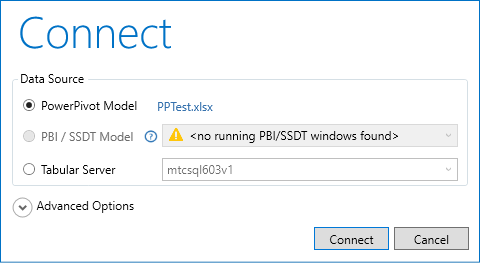
Connecting to PowerPivot in Excel
This is the only data source which has a requirement on the way in which DAX Studio is launched. In order to be able to connect to a PowerPivot data model in Excel you must have the DAX Studio Excel Addin installed and you must launch DAX Studio from the Addin ribbon in Excel.
When you launch DAX Studio from the Excel addin and the active workbook contains a PowerPivot model you will see the following option enabled and selected by default
When you launch DAX Studio any other way the PowerPivot option will be disabled
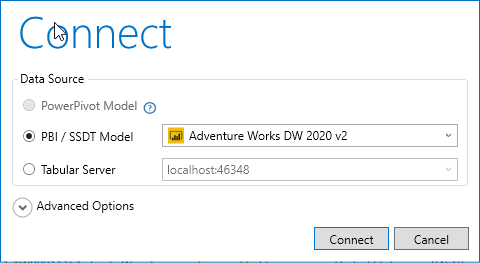
Connecting to Power BI Desktop
There are a couple of different ways of connecting to Power BI Desktop.
If you have installed DAX Studio with the default All Users option, the installer will register DAX Studio with Power BI Desktop as an External Tool and you should see a DAX Studio icon in the External Tools ribbon in Power BI Desktop. If you launch DAX Studio from there it will open with a connection already established to the data model in Power BI Desktop.
Or if you launch DAX Studio while Power BI Desktop is running you can see a list of the open pbix files in the PBI / SSDT option and connect to your file that way.
You cannot connect to reports using Live Connections when using option 2. When you use Option 1 the External Tools option knows about the Live Connection and sends through the connection details for the underlying Live Connection.
The SSDT option works if you are using the internal workspace option. In this scenario SSDT is similar to Power BI Desktop in that it launches a private version of the tabular engine in the background which we can then connect to. The only main difference between SSDT and Power BI Desktop is that we can only «see» the solution name, not the project name. So if you have multiple tabular models in a single solution you will see multiple entries with the same name, one for each project in the solution.
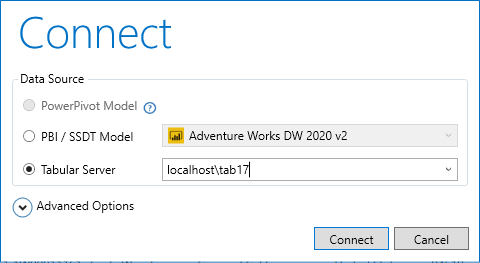
Connecting to Analysis Services
To connect to an Analysis Services instance you just need to enter the instance name in the server option in the connection dialog
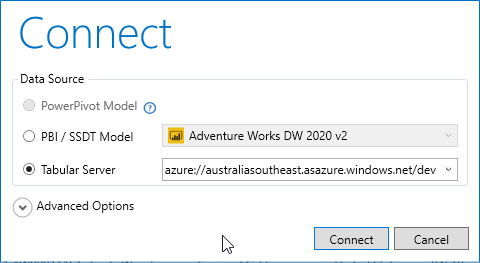
Connecting to Azure Analysis Services
To connect to Azure Analysis Services you enter the name of your instance in the server option in the connection dialog. This typically is a string starting with asazure://
Connecting to Power BI Premium XMLA Endpoint
To connect to Power BI Premium XMLA endpoints you enter the name of your instance in the server option in the connection dialog. This typically is a string starting with powerbi:// and you can typically copy this string from the Premium tab in the Workspace settings. Or from the settings in a given dataset.
Источник
Power Query Connection to Excel PowerPivot Data Model
We can connect almost any data source in Power Query, but PowerPivot data model is not included in that extensive list of sources out of the box.
But with the help of the fabulous DAX Studio we can do it (although in my opinion it is still inconvenient and tricky) at least locally – from the same workbook in Excel or from Power BI Desktop.
All you need is to open your Excel workbook, run DAX Studio add-in and connect it to this workbook. Then you can just connect to the PowerPivot model as to SQL Server Analysis Services cube.
But this is an undocumented and extremely limited feature not supported by Microsoft, which can only be used under your own risk.
Step 1: Ready…
First, we need the Source. In other words, the Excel workbook with some data, loaded to the PowerPivot data model. If you can see a table in the PowerPivot window, it is good.
I have a workbook with these sample tables:
which form this simple data model:
In the ‘Sales’ table I have already created the calculated column to calculate cumulative total for the product by date:
And the simple measure:
The source of tables in PowerPivot model is the tables from this workbook, but they could also be from Power Query.
Second, we need DAX Studio add-in for Excel installed. If you are working with Power BI or PowerPivot and do not have DAX Studio installed, I have bad news for you… If so, or if you haven’t installed add-in for Excel, go to the https://daxstudio.org/, click the big green button to download the latest release and install it. During the installation, do not forget to install not only application alone, but the Excel add-in, too. It is necessary.
Step 2: Steady…
To connect Power Query to your workbook data model, open your workbook :). For some reasons I insist that only this workbook is opened! This and only this one. If several workbooks are opened simultaneously, there could be mess and problems.
Run DAX Studio add-in from the “Add-ins” ribbon group in Excel. After the DAX Studio starts, you will see connection window, where you must select the first option:
Click “Connect”. After the connection is established, do not close DAX Studio, it must be running. You can minimize it if you want.
Now all is ready to connect.
Step 3: Go!
Now go to the Power Query and connect to the «SQL Server Analysis Services database (import)».
We need to know the server address for it. If this connection was to some server or Power BI Desktop, we could then see its address in the bottom right corner of DAX Studio window:
But when connected to the Excel file, we see only this:
No server name, no address, no port number.
Now I reveal the main secret:
You need to use http://localhost:9000/xmla as the server name/address. That’s all.
Of course, you can also use this database name (it is necessary to write it down if you want to use custom MDX or DAX query in connection): “ Microsoft_SQLServer_AnalysisServices ”
How did I reveal this address is too TL;DR even for me 😊. You need to know that these server address and database name are always the same, at least, at the time when I write this post, so you don’t need to search for the server address every time.
When Power Query asks you about the data source credentials, just use your current Windows authorization (sorry if you cannot read the screenshot in Russian, just look which options I selected):
Ta-dam.
Now you see the model, all its calculated columns and measures as the OLAP cube. You can build any tables you need from it.
If you are familiar with MD cubes and their behavior, then you are ok 😊 If no, you will need some time to adjust to cubes logic and use.
Read PowerPivot model from Power BI
If for some reason you do not want to import Excel data model in Power BI, you can use this trick to connect to PowerPivot in Power BI Desktop. But again, only in import mode, no live connection.
All the steps are THE SAME.
Purposes
For me, this trick is one of the long “just because I can” list. To be honest, I do not see any useful applications for this connection today. It is too tricky, limited to manual refresh, and cannot be used across other workbooks. But if you have an urgent need to extract some data from the Excel data model to PQ, you can use this approach carefully. For example, you may need to do some data mashup operations in Power Query, but some of them are too complex in Power Query and have a very bad performance there (usually it is about mashups which require a lot of scans of the same table), or there are other reasons to do some calculations in DAX rather than in M. You can export mid-step results in the data model and perform required calculations in PowerPivot, then read it again in the Power Query.
Or you can use it to perform any suitable MDX or DAX query over your data:
I think that there could be other needs which could be satisfied with this trick and which I did not meet yet. If you have some in mind do not hesitate to share.
Cautions and known problems
- This is undocumented
- This is unsupported
- This could change any moment, no guarantee.
- When connecting from Power BI Desktop, be sure that only one workbook is opened – at least, only one workbook with data model in it
- No, I do not know how to read PowerPivot model in another workbook. All my attempts failed; you only see the data model from this one workbook.
- To get correct refresh order of your queries and tables, you need to do it manually (or via VBA macro). Clicking “Refresh All” button in Excel do not guarantee refresh order, so not all your changes could be reflected correctly. Or press “Refresh All” twice.
There are a lot of other interesting things and pitfalls with this connection, but I don’t want to spend too much time on it now. At least not until I see a good reason or a use case for it.
Follow me: 


Share this: 

Источник
I can not get Dax Studio to Install (Excel Add In) #55
Looks like my prequisites are OK. In Excel—>Options—>Add Ins—>Com Add Ins Dax Studio does not show up. Here is the checker log:
Checking Operating System
Checking .Net Framework
Checking AMO
Checking ADOMD.NET
Dax Studio Configuration
Checking Excel Add-in
FATAL ERROR:
Object reference not set to an instance of an object.
at DaxStudio.Checker.Checker.CheckVSTO()
at DaxStudio.Checker.Checker.CheckExcelAddin()
at DaxStudio.Checker.MainWindow.OnLoaded(Object sender, RoutedEventArgs e)
The text was updated successfully, but these errors were encountered:
I’m a bit worried about the fatal error in the CheckVSTO call, but I was pretty sure that PowerPivot was using VSTO (Visual Studio Tools for Office) internally, so if that works DAX Studio should work too.
Do you have the Power Pivot addin for Excel enabled? Can you see the Power Pivot ribbon and open the «Manage» window?
If PowerPivot is installed and working the next thing you could try is the following to see if that will give us a more detailed error message:
- Close all copies of Excel
- Run DaxStudio.Checker, go to the File menu and click on «Enable VSTO Alerts»
- Start Excel, hopefully this will display an error message about why DAX Studio is not loading
- Paste the details of any error message back to this issue
- Close Excel
- From DaxStudio.Checker, go to the File menu and disable the «Enable VSTO Alerts» option
Hello and thank you for the quick response. I followed the instructions provided and Excel opened normally after changing DaxStudio.Checker to Enable VTSO alerts. A few more details on the situation:
Yes, Power Pivot is installed and is running fine. I can create models, Dax formulas process correctly, I can build Pivot Tables and Power View reports sourcing from the PP model.
When I installed Dax Studio a first time, the App installed fine (I could see Dax Studio App in windows control panel/apps and open the «thick» Dax Studio app). I did see the Dax Studio Add In in Excel, I activated it (or tired to) by clicking the checkbox for the Add In @ app path Excel—>Options—>Add Ins—>Com Add Ins, but the Dax Studio Icon would not show up in the «Add-Ins» Section of the Excel Ribbon. Curiously, the Add-Ins ribbon was never visible before doing this, but still, the Dax Studio Icon on the Add Ins ribbon was not there. So the install of Dax Studio clearly added the new ribbon section to my Excel but seem like it did not fully install
At this point I unistalled and reinstall Dax Studio several times and got the same behavior as above
I ran DaxStudio.Checker and it showed an error for AMOMD.NET. I got the MS update to ADOMD.NET. Ran that update and reinstalled Dax Studio. I got the same behavior however the ADOMD.net error thrown by DaxStudio.Checker went away
I then went back into the Excel Add Ins Manager section (Excel—>Options—>Add Ins—>Com Add Ins). I once again clicked the checkbox next to the Dax Studio Add in in and clicked «Remove»
I uninstalled and reinstalled Dax Studio again and now I do not even see the Dax Studio Add In in the Excel Add Ins Manager section (Excel—>Options—>Add Ins—>Com Add Ins). Its just not there at all.
Источник
Using DAX Studio to edit calculated fields or measures in Excel
The editor for calculated fields in Excel (aka measures) isn’t the greatest; this blog shows you how to install and use DAX Studio as a substitute editor.
Posted by
Andy Brown
on 20 February 2015
You need a minimum screen resolution of about 700 pixels width to see our blogs. This is because they contain diagrams and tables which would not be viewable easily on a mobile phone or small laptop. Please use a larger tablet, notebook or desktop computer, or change your screen resolution settings.
PowerPivot is a wonderful product, but its editor is its weakest point:

Making expressions easy to read is difficult!
This blog shows how to download and get started with DAX Studio, a separate
Excel add-in (it also works as a stand-alone product).
Wise Owl have no link to this software, and take no responsibility for it!
We do, however, use it to create our PowerPivot expressions.
Installing the Software
To install DAX Studio, go to this
site and click on the DOWNLOAD button.
Getting the Add-In to Work
This is what you should see when you go into Excel (I’m using Excel 2013):

You should see an
ADD-INS tab on your ribbon.
Here’s what you should see when you click on this tab:

You should see this icon when you click on the
ADD-INS tab.
Customising your Ribbon
It’s probably a good idea to move DAX Studio to a more useful place.
First choose to customise your ribbon:

Right-click on any part of the ribbon and choose the option shown.
You can now drag the DAX Studio icon to a better home:

Click on the DAX Studio tool as shown, and drag it to its new home.
The ADD-INS tab, being empty, should
disappear when you return to Excel.
A sledgehammer to crack a nut
DAX Studio is designed for writing self-contained statements in the DAX
language (which is a bit like SQL in this context). For example:

Running this query would list out all of the rows in the
Transaction table.
You can choose
where the results will be listed like this:

Choose this option to show the results in a grid, in a similar manner to SQL Server Management Studio.
However, we’re using DAX Studio just to format calculated fields in PowerPivot —
very much a
sledgehammer to crack a nut (another
colloquialism, I’m afraid).
Creating an expression in DAX Studio
Here’s how to create a formula to sum the value of transactions (to take
one simple example). First
drag the function that you want into the window:

Drag a function in from the list on the
Functions tab.
Note the syntax expected:

Here we’ll need to provide a table and an expression.
You can increase the font size by holding down the CTRL key and scrolling
your mouse button (or use the drop arrow at the bottom left of the expression
window).
Use the TAB and ENTER
keys to start your expression:

We’ll
indent all of the arguments for the function.
You can drag tables and columns into the expression editor:

Here we’re about to use the
Quantity column in our formula.
When you’ve finished, select the results and press CTRL
+ C to copy them:

You can also right-click to copy.
Paste this into a PowerPivot calculated field if you’re using Excel
2013, or measure if you’re using Excel 2010:

The calculated field in Excel.
Excel will retain the indentation, but not the line numbers (and comments don’t
seem to work either).
Whether it was worth using the separate editor depends on a) how much you use
DAX and b) how much you dislike the built-in expression editor in PowerPivot.
This blog has 0 threads
Add post
С помощью потрясающего DAX Studio мы можем сделать это (хотя, на наш взгляд, это все еще неудобно и сложно) по крайней мере локально — из той же книги Excel или из Power BI Desktop.
Все, что вам нужно, это открыть вашу книгу Excel, запустить надстройку DAX Studio и подключить ее к этой книге. Затем вы можете просто подключиться к модели PowerPivot, как к кубу служб аналитики SQL Server.
Но это недокументированная и крайне ограниченная функция, не поддерживаемая Microsoft, которую можно использовать только на свой страх и риск.
Шаг 1: Старт
Во-первых, нам нужен Источник. Другими словами, книга Excel с некоторыми данными, загруженными в модель данных PowerPivot. Если вы видите таблицу в окне PowerPivot, это хорошо.
У нас есть рабочая книга с этими образцами таблиц:
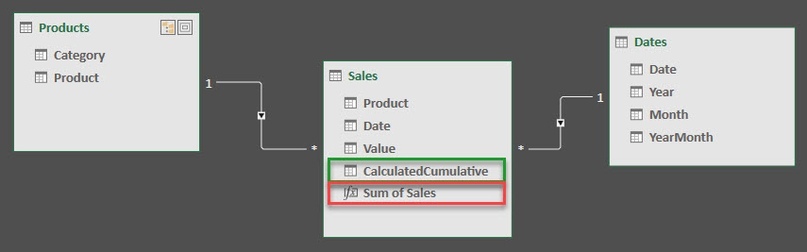
Sum of Sales := SUM(Sales[Value])
Источником таблиц в модели PowerPivot являются таблицы из этой книги, но они также могут быть из Power Query.
Во-вторых, нам нужна надстройка DAX Studio для Excel. Если вы работаете с Power BI или PowerPivot и у вас не установлена DAX Studio, у нас для вас плохие новости… Если это так, или если вы не установили надстройку для Excel, перейдите на https://daxstudio.org, нажмите зеленую кнопку, чтобы загрузить последнюю версию и установить ее. Во время установки не забудьте установить не только приложение, но и надстройку Excel. Это необходимо.
Шаг 2
Чтобы подключить Power Query к вашей модели данных рабочей книги, откройте рабочую книгу. По некоторым причинам мы настаиваем на том, чтобы была открыта только одна рабочая книга! Если одновременно открыть несколько рабочих книг, могут возникнуть проблемы.
Запустите надстройку DAX Studio из группы лент «Надстройки» в Excel. После запуска DAX Studio вы увидите окно подключения, где вы должны выбрать первый вариант:
Теперь все готово для подключения.
Шаг 3
Теперь перейдите к Power Query и подключитесь к «базе данных служб аналитики SQL Server (импорт)».
Для этого нам нужно знать адрес сервера. Если бы это подключение было к какому-либо серверу или Power BI Desktop, мы могли бы увидеть его адрес в правом нижнем углу окна DAX Studio:
Вам необходимо использовать http://localhost:9000/xmla в качестве имени/адреса сервера. Вот и все.
Конечно, вы также можете использовать это имя базы данных (необходимо записать его, если вы хотите использовать пользовательский запрос MDX или DAX в соединении): «Microsoft_SQLServer_AnalysisServices».
Когда Power Query спросит вас об учетных данных источника данных, просто используйте текущую авторизацию Windows: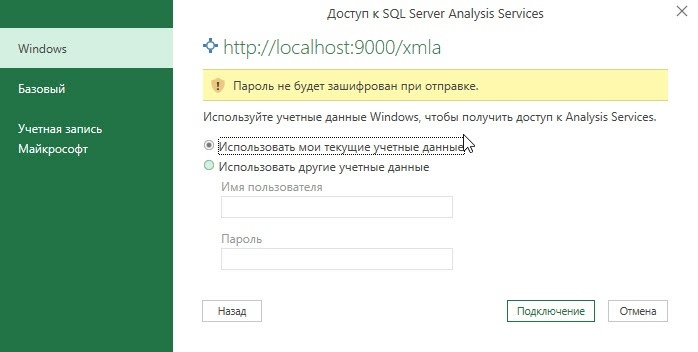

Если вы знакомы с кубами MD и их поведением, то все в порядке. Если нет, вам потребуется некоторое время, чтобы приспособиться к логике и использованию кубов.
Читать модель PowerPivot из Power BI
Если по какой-либо причине вы не хотите импортировать модель данных Excel в Power BI, вы можете использовать этот прием для подключения к PowerPivot в Power BI Desktop. Но опять же, только в режиме импорта.
Для нас этот трюк — один из длинного списка «что мы можем». Если честно, он один из самых полезных для этой задачи. Да, он сложен и ограничен ручным обновлением. Но если вам необходимо срочно извлечь некоторые данные из модели данных Excel в PQ, вы можете осторожно использовать этот подход.
Например, вам может потребоваться выполнить некоторые операции по слиянию данных в Power Query, но некоторые из них слишком сложны в Power Query и имеют очень плохую производительность (обычно речь идет о мэшапах, которые требуют много операций сканирования одной и той же таблицы) или есть другие причины для выполнения некоторых вычислений в DAX, а не в M. Вы можете экспортировать промежуточные результаты в модель данных и выполнить необходимые вычисления в PowerPivot, а затем снова прочитать их в Power Query.
Наши курсы по Power BI:
Курс Аналитик BI
Курс DAX Mastering
Курс Финансовый анализ в Power BI
Наши каналы:
Facebook
Instagram
VK
Telegram
DAX Studio is a tool to write, execute, and analyze DAX queries in Power BI Designer, Power Pivot for Excel, and Analysis Services Tabular.
It includes an Object Browser, query editing and execution, formula and measure editing, syntax highlighting and formatting, integrated tracing, and query execution breakdowns.
August 24, 2022: read more about the new major release of DAX Studio v3.0.0.
Visit http://daxstudio.org to read the full documentation and download the latest release of DAX Studio. The project is open source on GitHub.
Darren Gosbell is original author and the maintainer of the project, which has many contributors. SQLBI provides the EV code signing certificate and appears as the publisher of the tool, which can be safely downloaded and installed without SmartScreen warnings.
Latest changes
3.0.6
Added – Copy with/without headers option for query results
Added – Duplicate option to tab right-click menu
Added – Open a .dax file by dragging it onto DAX Studio
Added – Encoding option for custom CSV output
Added – Formatted File as an output option
Added – Json option when outputting to a file
Added – Server FE Benchmark (preview)
Added – Default file name when exporting bim from vpax
Updated – Moved Swap Delimiters / Debug Commas to advanced
Updated – Timeline/Waterfall visualization in Server Timings
Updated – xmSQL / DirectQuery formatting improvements
Updated – moved preview and vertipaq analyzer settings from the advanced to the standard options page
Fixed – fix vertipaq analyzer showing in summary pane for AAS / PBIP
Fixed – Enabling Shift+Enter to be used as a custom hotkey
Fixed – Disabled re-ordering of columns in vertipaq analyzer
Fixed – Fix location of desktop shortcut file for Current User installs
Fixed – QueryBuilder measures missing table references when loading from file
Fixed – QueryBuilder IN filters not loading from file correctly
Fixed – Improving VertiPaq Analyzer tooltips
Fixed – Fixing spelling / capitalization errors
Fixed – Tool Window incorrectly docking
Fixed – Permission error on non-admin install
Fixed – Improved color contrast in dark mode
Fixed – Adjusted measure icon position when vertical scrollbars are always displayed
Fixed – Adding support for measure filters in Query Builder
Fixed – Display of columns with open parenthesis as first character
Fixed – Metadata display for multi-dimensional models
Fixed – Skip showing crash dialog if app is shutting down
Fixed – Improved generation of Define Measure and Define Dependent Measures
Fixed – Crash in BindableFocusBehaviour and AutomationPeer
fixed – Cell alignment in View Metrics columns tab
Fixed – Crash on update flag click event
Fixed – Crash when browsing for a folder during CSV data export
Fixed – Improvements for FE duration calculation
Fixed – Hidden table icon
Fixed – Excel tracing
Fixed – Invalid button states after failed connection attempt
3.0.5
Fixed – Permissions error when installing for Current User
Fixed – Colors on Getting Started dialog
Fixed – Incorrect new version notification on the initial install
3.0.4
Added – Query information button to traces
Updated – Query History icons
Updated – Exposed Theme/Mode setting in Options
Added – MPARAMETER keyword to syntax highlighting
Fixed – Error exporting to static Excel file
Fixed – crash when dragging trace windows
Fixed – incorrect link to tutorial in Getting Started dialog
Fixed – Define and Expand sometimes producing incorrect output
Fixed – username blank in All Queries trace
Fixed – increased default code completion window width
Fixed – automatically select all text in find/replace dialog
Fixed – improved waterfall layout in Server Timings
Fixed – setting focus in the editor when changing tabs
Fixed – file icon registration
Added – Extra hotkey validation rules
Added – Retry logic to all clipboard operations
Improved – Error handling around shutdown operations
Improved – Power BI filename detection for non-English cultures
Removed – Unused dependencies and reduced installer/portable file size
3.0.0
New User Interface
Updated – Improved state tracking for trace windows
Updated – Prevented interleaving of clearcache with query execution
Updated – Added PowerPivot model detection timeout in options
Updated – Syntax highlighting to handle multi-line strings
Added – Highlighting of cache nodes in physical query plans
2.17.3
Added – Parameter support to Query Builder filters
Updated – Removing tags from xmSQL in Server Timings to improve readability
Updated – Accuracy of Server Timings for queries with Batch events
Updated – Query builder queries are now captured in the query history
Added – The /f parameter can now open vpax files
Added – Extra information to the error message when the XMLA endpoint is not correctly enabled
Updated – Improved caching of measure expressions
Fixed – Preventing a crash when entering a proxy password
Fixed – Added DOUBLE data type to auto-complete and syntax highlighting
Fixed – Export to Excel failed on some machines
Fixed – Saving parameters to XML was not correctly encoding special characters
Fixed – Crash on startup if the WMI information on the machine was corrupt
Fixed – download link in Help – About screen
Fixed – not loading the model metadata when the regional settings for the current machine uses something other than a period (.) for the decimal separator
Fixed – crash in the QueryBuilder when the model metadata has not loaded correctly
2.16.2
Fixed – Traces fail to start with a timeout error (regression in 2.16.1)
Minor fixes
2.16.1
Minor fixes
2.16.0
Added – “Preview Data” right-click option for tables and columns
Added – Extended parameter support to include data types other than text
Added – “New Version” notification in the title bar
Added – Auto-Generate button to Query Builder
Added – ORDER BY support to the Query Builder
Added – Ctrl+W to select the current word
Added – Encoding option when using Exporting Data to CSV files
Added – Extending installer support for Windows ARM64
Added preview feature – Debug Commas – moves commas in formatted queries to the start of the line
Added preview feature – Show XMLA Commands in All Queries trace – shows commands sent by other tools like SSDT and Tabular Editor
Updated – xmSQL cleanup to also fix table names
Updated – Supporting all of the /f /s /d command line parameters at the same time
Updated – Query Builder Improvements
Updated – Clicking Edit Query from the Query Builder will now update any previously generated query text
Updated – Custom Key-Bindings moved out of preview
Updated – Extending Hover tooltip to work with Keywords
Updated – Show PBIX filename in the database dropdown instead of database ID
Updated – updating ADOMD / AMO references to 19.22
Fixed – Analyze in Excel not working with PBI XMLA or AzureAS
Fixed – Server Timings Layout Tab not appearing
Fixed – Issue with code completion window “sticking”
Fixed – other minor bugs fixed in this release
2.15.0
Added – Toolbar button and right-click menu to copy Server Timing metrics
Added – Option to play a sound after long-running operations
Added – “Duplicate Measure” right-click menu to Query Builder
Added – Error events to All Queries trace
Added – Right-click menu option in the editor to go to dax.guide for functions
Added – Function tooltip display when hovering the mouse over functions in the editor
Added – Discussions link to website navigation
Updated – Multiple Query Detection to work with // Dax Query comments in composite models
Fixed – more than 25 bugs fixed in this release
You can watch a video about profiling a query with DAX Studio by Marco Russo, who also wrote about new tracing features in version 2.1.
Issues
Please, give your feedback and vote for your favorite features.
1 Introduction
Modern analytical tools like Power BI are designed to deliver results in a very fast and dynamic way. However, a problem in your data model or overcomplex calculations, can result in a slower report. 
How to investigate this? DAX Studio to the rescue! DAX, or Data Analysis Expressions, is the formula and query language behind Power BI and related technology. DAX Studio is a third-party tool that you can use to measure and improve the speed of DAX queries. DAX Studio can be downloaded for free via the following link: https://daxstudio.org. DAX Studio is a client tool for executing queries against various data sources including:
- PowerPivot in Excel
- Power BI Desktop / SSDT Integrated Workspaces
- Analysis Services Tabular
- Azure Analysis Services
When starting DAX Studio, DAX Studio scans the local machine for any running instances of Power BI Desktop or SSDT Integrated Workspaces. These instances can then be used as a source to investigate the speed and complexity of the queries on this data.
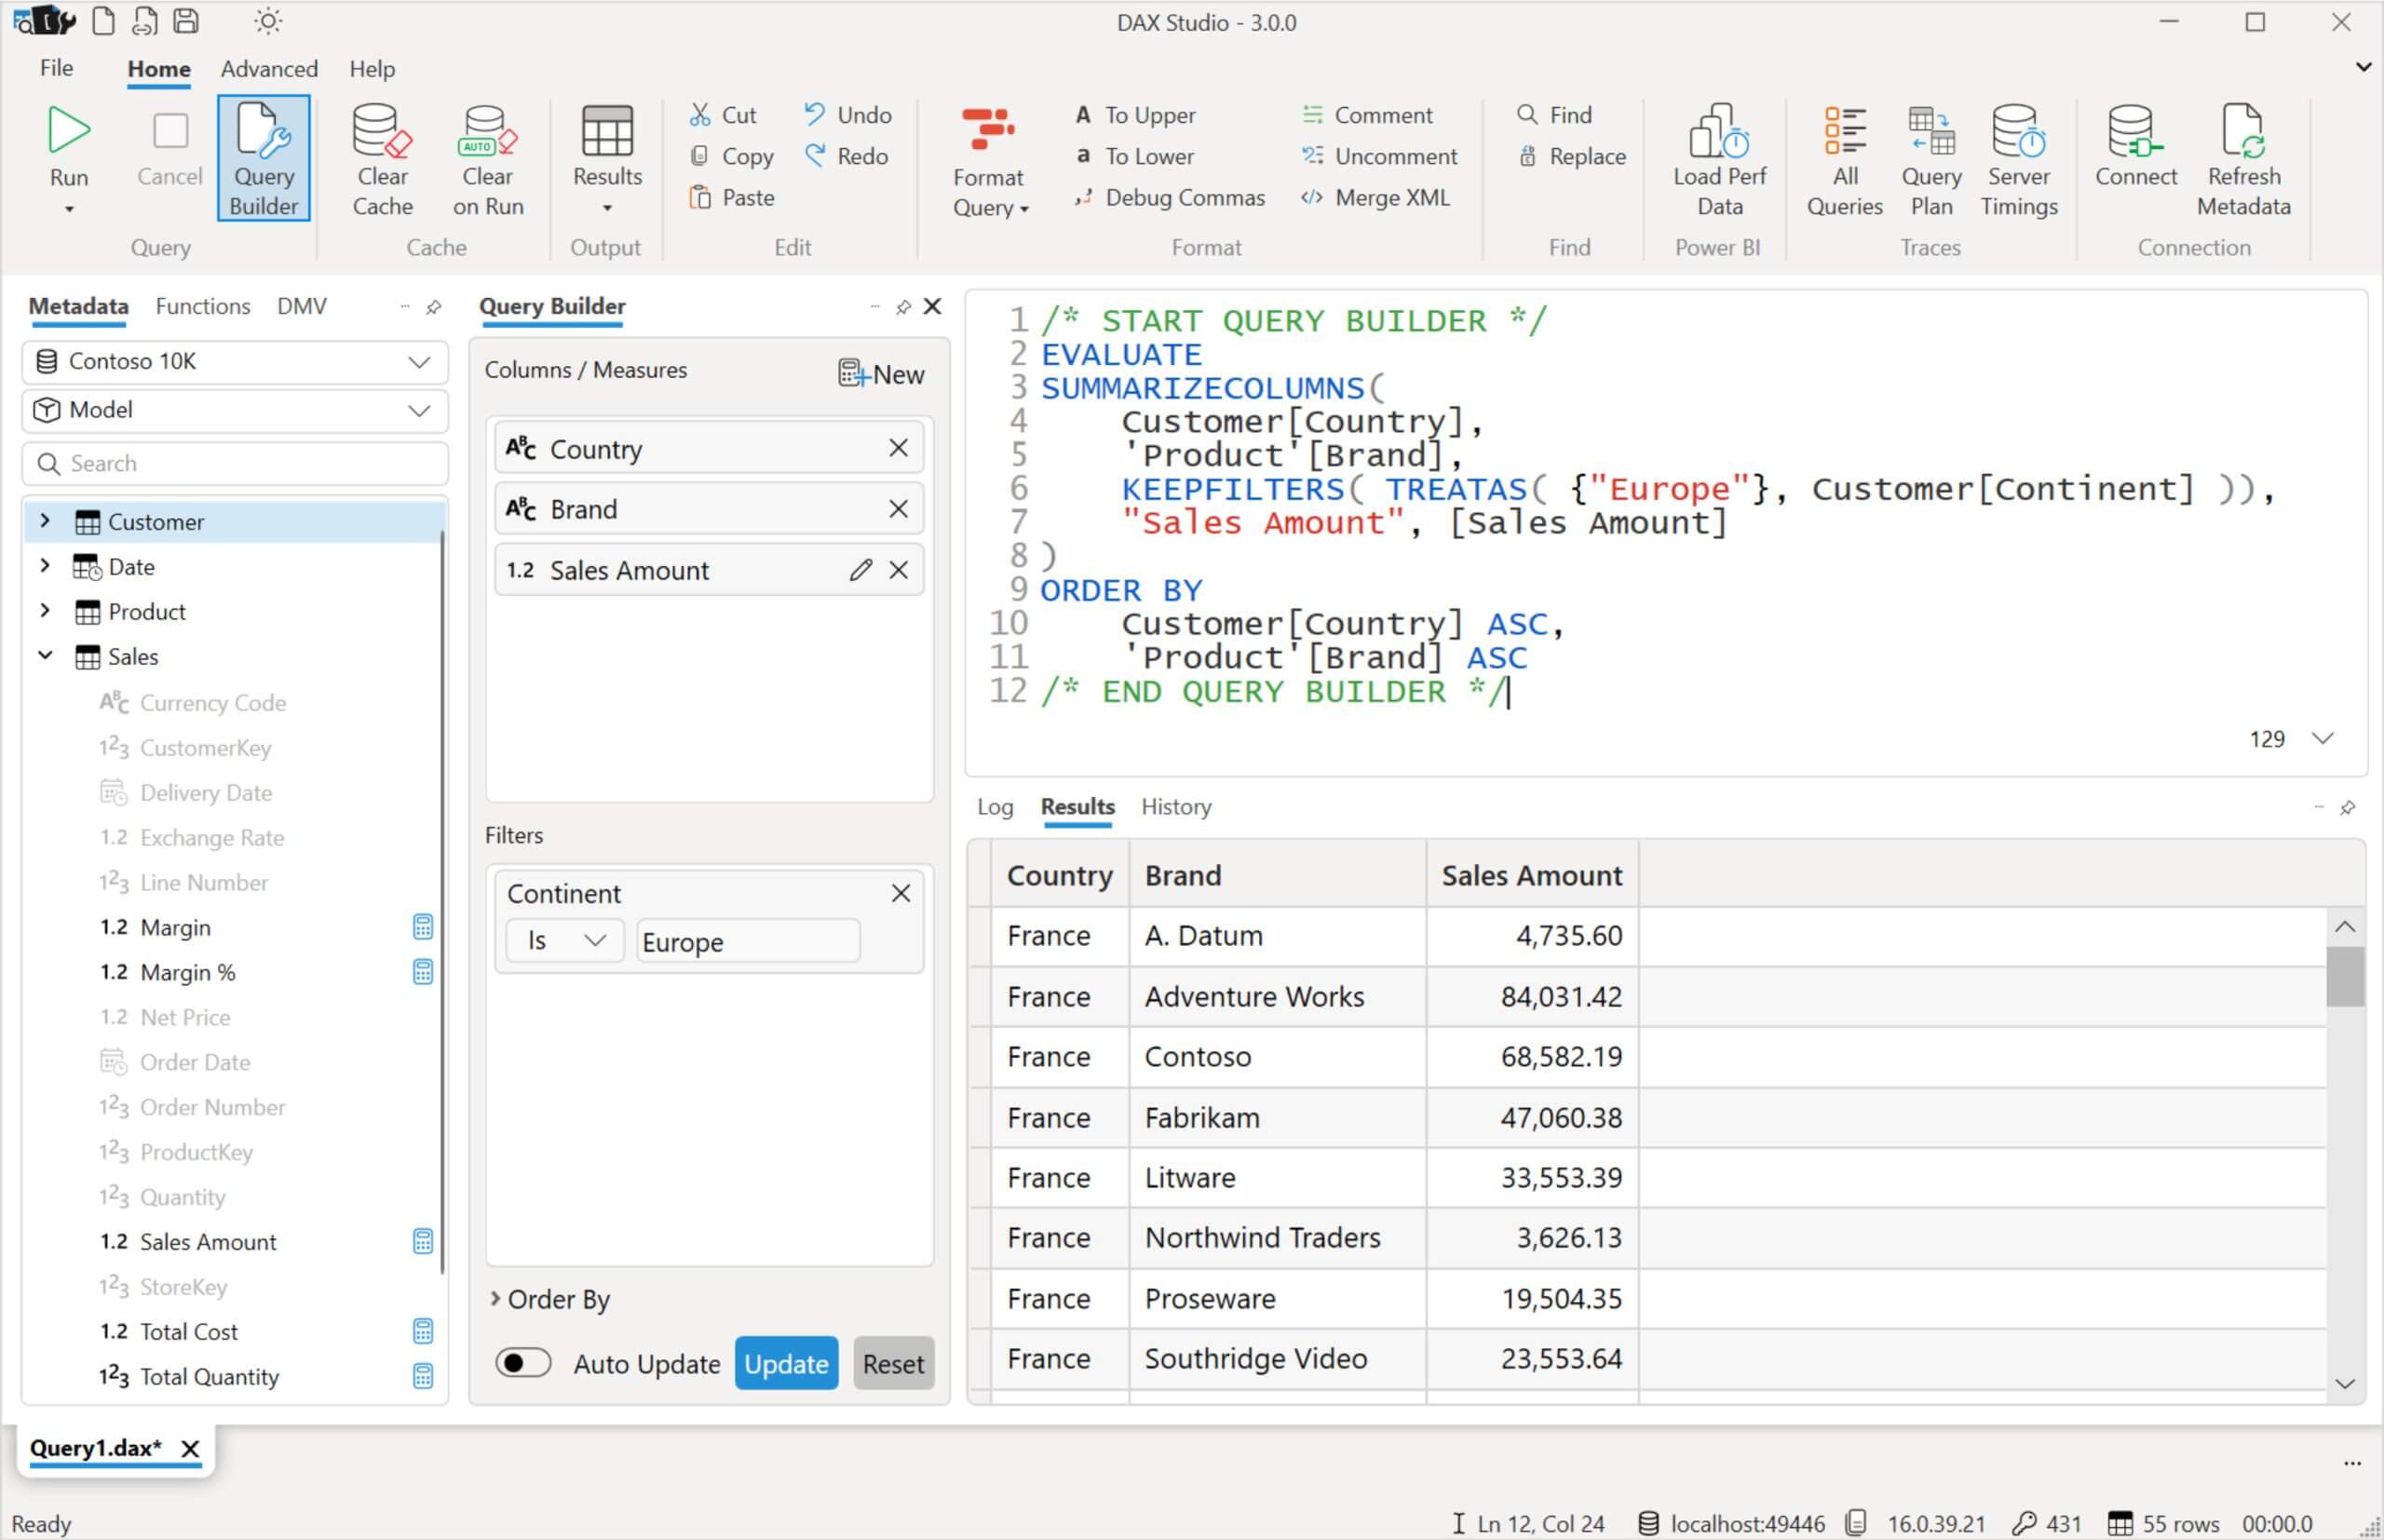
2 Interface of DAX Studio

1. This is the ribbon. It is formatted like the Office 365 ribbon and like the recent versions of Power BI Desktop. This creates a recognizable look and feel. Everything that is present in the ribbon will be discussed later.
2. This part contains the tables and the various databases. Via a dropdown we can choose the database on which we want to test the queries. Under the dropdown we get an overview of which tables are present.
3. In the script editor we can enter the specific queries to execute.
4. This part of the interface displays the results.
5. The bottom ribbon provides additional information about the query executed.
3 The ribbon of DAX Studio
3.1 Query
A. Run
The Run statement contains 2 modes:
1. Run Query
This is the default mode, it will execute the selected query and sent the results to the selected output
2. Clear Cache and Run
In this mode before the query is run a clear cache command is sent to the connected instance to make sure that the query runs on a cold cache. During performance tuning it is really important to understand and investigate the impact of caching on your query.
B. Cancel
This will stop the execution of a running query.
C. Clear Cache
This will send a clear cache command to the connected instance so that the query will be run on an empty cache. This makes it possible to compare 2 almost similar queries without caching in the story.
D. Output
1. Grid
This is the default mode. Results are displayed in a grid within the Dax Studio Results tab.
2. Timer
In this mode the query is run, but the results are discarded. This is mainly useful for performance tuning where you want to measure the speed of two queries but are not interested in viewing the results.
3. File
Results can be sent directly to a tab separated (.txt) file or to a comma separated (.csv) file.
4. Linked (Excel only)
When the results are output using the Linked Excel mode a table is created in the active Excel workbook which has the connection to the Tabular data source and the DAX query embedded in it. What this means is that users without DAX Studio could refresh the data in this table.
5. Static (Excel only)
This output option simply executes the DAX query and copies the results into the specified sheet in the active Excel worksheet. This is just a static copy of the data which cannot be refreshed. (unlike the Linked output option)
3.2 Edit, Format & Find
These are tools to help shape the query, like you can find in Word, Excel, etc.
3.3 Traces
Note: Tracing requires server admin rights, if you do not have these the trace buttons will be disabled!
A. Query Plan
DAX Studio supports capturing the query plan trace events from a SSAS Tabular server and displaying them.

The Query Plan text is currently displayed in its raw form. In the future some pre-processing may be done to improve the readability. Currently it is not possible to get query plans from a Power Pivot connection.
B. Server Timings
The standard server timings reported in the output window are the elapsed time for the query recorded by DAX Studio, but that can be impacted by network speeds and the size of the result set. If you want to see the query timing from the server perspective, you can do this with the server timing trace button.

This button causes an extra tab to be displayed which shows the total time the server spent processing the query as well as the time spent in the Storage Engine and the number of Storage Engine requests for the query.

Each Query to retrieve a result set is divided between the Formula Engine and the Storage Engine. If the impact tilts to the Formula Engine then this formula needs to be reconsidered if it can be written more performant. The Formula Engine is single-threaded and will place all the ongoing queries of the Storage Engine on hold. A typical normal distribution should be around 1/5 FE and 4/5 SE.
The Storage Engine can handle simple aggregation formulas like SUM, AVG, … However, a lot of measures in a complex model require a more complex calculation plan so these are first processed by the Formula Engine and therefore take longer to load. However, the Storage Engine is multi-threaded so all operations that the Storage Engine can record are a lot smoother as they can run parallel to each other.
The reports/visual that go slower, usually contain a more complex DAX formula. The Formula Engine is the engine that will load the RAM memory because of the demand for and processing of data. The Storage Engine iterates over the data that is compressed in the VertiPaq column stores (in RAM memory) and will place the data of the disk in the RAM memory if it isn’t already.
The queries must be made in such a way that they will spend a minimal amount of time in the Formula Engine.
3.4 Connection
A. Connect
Allows you to connect to a source.
B. Refresh Metadata
Will retrieve and renew all metadata from the source.
4 Example of a query in DAX Studio

The first step is to choose a data source. In this example I quickly created a PBIX with some tables. These tables will be used as data source for this example. The PBIX consists of 1 fact table (Overview) and 4 dimensions (Employee, Product, Status and Type).
When everything is loaded you will find all tables and fields of the chosen data source in the left column of the screen (see next screenshot).
There are several ways to validate and evaluate a query. First of all, you can copy the query from a visual from Power BI Desktop. This is possible to use the Performance Analyzer in Power BI Desktop. This can be found in the ribbon under View. After that you can refresh the data and unfold the visual and copy and paste the query in DAX Studio. Another way is to write the query yourself in DAX Studio . It is also very important to know that DAX Studio can only perform Table functions. Example of what the syntax can look like can be found below:
[DEFINE { MEASURE <tableName>[<name>] = <expression> }
{ VAR <name> = <expression>}]
EVALUATE <table>
[ORDER BY {<expression> [{ASC | DESC}]}[, …]
[START AT {<value>|<parameter>} [, …]]]

If you want to get a single value you can use the example below:
EVALUATE ROW(<ColumnName>, <Expression>)
After drawing up the query, it is possible to start analyzing it. To do so, we follow the steps in the screenshot below:
1. Formatting the query
2. Use the ‘Server Timings’ button
3. Run the query (with or without emptying cache)
Then we can start analyzing the outcome. This can be found at the bottom of the screen. When the button ‘Server Timings’ is selected you will get an extra tab at the outputs. This tab shows how many queries have been executed and how much time they took. Finally, you can also see how much time the query has spent in the Formula Engine and how much time in the Storage Engine. Based on this outcome queries & models can be adjusted to improve performance as discussed in the side note in this Insight.

For more information visit the DAX Studio Documentation page:
https://daxstudio.org/documentation/.
Keen to know more?
Continue reading or contact us to get started:
- What’s Azure Purview and how can it help my Data Management?
- Automate your Data Warehouse tasks in Azure: REST API or PowerShell, who wins?
- What are Power BI dataflows and how to get started?