
Spreadsheet Sample Data in Excel & CSV Formats
I have put this page together to provide everyone with data that you would come across in the REAL WORLD. Whether you are looking for some Pivot Table practice data or data that you can flow through an Excel dashboard you are building, this article will hopefully provide you with a good starting point.
All the example data is free for you to use any way you’d like. I have saved the data in both an Excel format (.xlsx) and a comma-separated values format (.csv).
What Can This Data Be Useful For?
-
Feeding Dashboards
-
Manipulating in Power Query
-
Feeding into Power BI
-
Practicing Excel Formulas (VLOOKUP Practice Data)
-
Testing Spreadsheet Solutions
-
Example Data for Articles or Videos You Are Making
Which Spreadsheet/BI Programs Can I Use This Data With?
-
Power BI
-
Tableau
-
LibreOffice (OpenOffice)
-
Tell me in the comments if there are others!
-
Microsoft Excel
-
Google Sheets
-
Apple Numbers
-
Excel’s Power Query
Company Employee Example Data
Folks in Human Resources actually deal with a lot of data. This data can be great for creating dashboards and summarizing various aspects of a company’s workforce. In this database, there are 1,000 rows of data encompassing popular data points that HR professionals deal with on a regular basis.
You can use this data to practice popular spreadsheet features including Pivot Table, Vlookups, Xlookups, Power Query automation, charts, and Dashboards.
Columns in this Data Set:
Below is a list of all the fields of data included in the sample data.
-
Employee ID
-
Full Name
-
Job Title
-
Gender
-
Ethnicity
-
Age
-
Hire Date
-
Annual Salary (USD)
-
Bonus %
-
Department
-
Business Unit
-
Country
-
City
-
Exit Date
Data Preview (Employee Records)
Download This Sample Data
If you would like to download this data instantly and for free, just click the download button below. The download will be in the form of a zipped file (.zip) and include both a Microsoft Excel (.xlsx) and CSV file version of the raw data.
Sales Force Example Data (Coming Soon!)
Columns in this Data Set:
Below is a list of all the fields of data included in the sample data.
-
YTD Sales
-
Commission Rate
-
Phone Number
-
Leader Name
-
Units Sold
-
Avg. Price Per Unit
-
Employee Name
-
Region
-
Office
-
Prospecting
-
Negotiating
-
Orders
Data Preview (Sales Team Data)
Company Financial Results Example Data
Columns in this Data Set:
Below is a list of all the fields of data included in the sample data.
-
Month
-
Year
-
Scenario (Actuals/Forecast/Budget)
-
Currency
-
Account
-
Department
-
Business Unit
-
Amount
Data Preview (Financial Data)
Website Traffic Example Data (Coming Soon!)
Columns in this Data Set:
Below is a list of all the fields of data included in the sample data.
-
Users
-
Bounce Rate
-
Keywords
-
Avg. SERP
-
Avg. Time on Page
-
Page URL
-
Page Title
-
Pageviews
-
Sessions
-
Social Media Traffic
Data Preview (Web Traffic)
I Hope This Microsoft Excel Article Helped!
Hopefully, you were able to find 1 or more data sets that you can use for your spreadsheet project. If you have any questions about the data I’ve compiled or suggestions on more datasets that would be useful, please let me know in the comments section below.
About The Author
Hey there! I’m Chris and I run TheSpreadsheetGuru website in my spare time. By day, I’m actually a finance professional who relies on Microsoft Excel quite heavily in the corporate world. I love taking the things I learn in the “real world” and sharing them with everyone here on this site so that you too can become a spreadsheet guru at your company.
Through my years in the corporate world, I’ve been able to pick up on opportunities to make working with Excel better and have built a variety of Excel add-ins, from inserting tickmark symbols to automating copy/pasting from Excel to PowerPoint. If you’d like to keep up to date with the latest Excel news and directly get emailed the most meaningful Excel tips I’ve learned over the years, you can sign up for my free newsletters. I hope I was able to provide you with some value today and I hope to see you back here soon!
— Chris
Founder, TheSpreadsheetGuru.com
Home > Microsoft Excel > How to Generate Datasets in Excel with Functions and Utilities
(Note: Suitable for users of Excel 2021 and Excel for Microsoft 365.)
Objective
Generate a ‘dummy’ dataset quickly for practice or training purposes using Excel functions and utilities.
How to Generate Datasets in Excel Explained
Finding good and, most importantly, free datasets to download from the web is not an easy task. Most datasets we find are either not relevant, are too complex, or require us to join a website or pay a fee before downloading them. We also need to be careful that we are not using data that someone else has painstakingly put together without their permission.
In my own experience as a trainer, my role requires me to constantly generate datasets to use in training sessions, demo videos, and blog posts. Indeed, you might need a dataset so that you can practice your Excel skills, create some documentation or run your own training sessions.
In this article, I will show you how I generate datasets in Excel quickly and efficiently using Excel functions: CHOOSE, RANDBETWEEN, RANDARRAY, IFS, DATE, and Excel utilities: Flash Fill and Paste Values. I will also show you a useful website you can use to generate random lists for free.
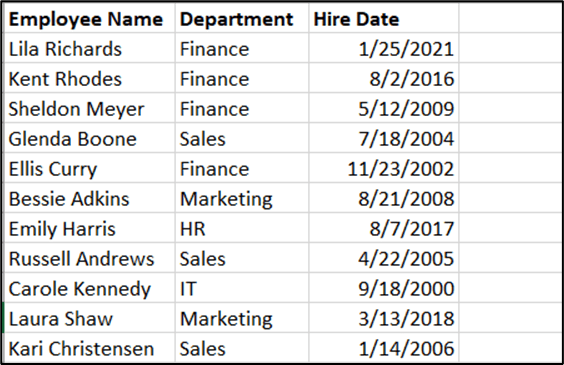
We are going to be generating a list of ‘dummy’ HR data that shows the Employee Name, Department, Hire Date, Job Title, and Salary.
NOTE: If you are an Excel for Microsoft 365 user, you have access to the new Data Types utility. This is very useful for generating datasets, but we won’t be focusing on this in this article as not everyone has access to it.
- Generating a List of Employee Names
- Generating a Department for Each Employee
- Generating Random Dates
- Generating a Job Title
- Generating a Salary
Related reads:
How to Add Data Bars in Excel
How to Split and Combine Data in Excel
Excel Quick Analysis Tool
Generating a List of Employee Names
In this example, we are going to generate a dataset for an HR Team. We will start by building a list of 50 Employees. If you are anything like me, you don’t to spend time thinking of and typing out a list of 50 random names.
Fortunately, there are many websites that offer an online Random Name Generator. We can choose how many names we want to generate, the gender and the name style.
- Select the Number of names from the drop-down.
- Choose the Gender from the drop-down.
- Choose the Name style from the drop-down.
- Click Generate random names.

- Select the names and press CTRL+C to copy.
- Go to your Excel spreadsheet and press CTRL+V to paste.
The formatting from the website will be pasted with the names, to remove this:
- Click the Paste Options button.
- Select Match Destination Formatting.

Now, we have our list of names but we need to remove the leading number. We can do this using Flash Fill.
- In column B, type the first name as you want it to appear.
- Press CTRL+Enter to stay in the same cell.

- From the Data tab, in the Data Tools group, click Flash Fill.
- Select column A.
- Right-click and choose Delete.
- Add the column heading ‘Employee Name’.

Generating a Department for Each Employee
Next, we need to generate a ‘Department’ for each employee in the list. I want to randomly assign 5 departments: Marketing, Sales, Finance, HR and IT. To do this, we can use a combination of two Excel functions: CHOOSE and RANDBETWEEN.
The CHOOSE function is a lookup function that allows us to choose a value from a list. The RANDBETWEEN function generates random numbers based on a top and bottom value that we specify. Combining these functions together will assign a number from 1-5 (the number of departments) randomly to each employee and then based on the number assigned will choose a department from the list.
This method ensures the departments are completely random and there are no obvious patterns.
- In the blank area of the spreadsheet, type the list of departments to assign.

- Click in the cell next to the first employee name.
- Type the following formula:

The RANDBETWEEN part of the formula will generate random numbers between 1 and 5. The top number should be equal to the number of items, in this case departments, in the list. The CHOOSE function will then assign a department based on the random number from 1 to 5 in the cell.
Marketing = 1, Sales = 2, Finance = 3, HR = 4 and IT = 5.
- Double-click to copy the formula down.
It’s always best with this type of formula, to copy and paste the values. This means the data won’t keep refreshing and changing and we can delete the list of departments.
- Select column B and press CTRL+C.
- Right-click and select Paste Values.
- Add the column heading ‘Department’.

Suggested reads:
How to Calculate Mean in Excel
How to Calculate Correlation Coefficient in Excel
How to Add Sparklines in Excel
Generating Random Dates
Next, we need to generate a column to show the ‘Hire Date’ of each employee. We are going to say that everyone was hired between 01/01/2000 and 01/01/2022. For this, we can use a combination of the RANDBETWEEN function and the DATE function.
- Click in the cell next to the first employee name.
- Type the following formula:

In this formula we set our date range 01/01/2000 – 01/01/2022 and then RANDBETWEEN assigns random dates that fall within that range to each employee.
- Double-click to copy the formula down.
- Select column C and press CTRL+C.
- Right-click and select Paste Values.
- Add the column heading ‘Hire Date.
- Apply Short Date Number Formatting to column C.
Generating a Job Title
Next, we need to generate a ‘Job Title’ for each Employee. We want the ‘Job Title’ to be reflective of the ‘Department’ the employee works in. To do this, we will use the IFS Function.
The IFS Function is a slightly quicker way of constructing a Nested IF’s formula. Both IF and IFS are logical functions in Excel that allow us to perform a test and get a result based on if the outcome of the test was TRUE or FALSE.
For example, if the ‘Department’ in cell B2 is equal to “HR” then return “HR Advisor”, etc. We need to add a logical test for each ‘Job Title’ we need to return.

- Double-click to copy the formula down.
- Select column C and press CTRL+C.
- Right-click and select Paste Values.
- Add the column heading ‘Job Title.
The ‘Job Titles’ should now accurately correspond to the ‘Department’.

Generating a Salary
Next, we need to generate a salary for each employee. The salaries will be between 20,000 and 50,000 and will be rounded to the nearest 100 multiple. We can use a combination of RANDARRAY, COUNTA and MROUND to do this.
- Click in the cell next to the first employee name.
- Type the following formula:

The RANDARRAY formula is similar to RANDBETWEEN but it allows us to specify how many rows and columns of number we need and if we want those numbers to be integers or decimals. We can use the COUNTA function to count the number of rows we need.

Notice that the Salaries are not formatted and not rounded to the nearest $100. Let’s fix that.
- Click on the first salary in column E.
- In the formula bar, add the MROUND function to round the values to multiples of 100.

- Select column E and press CTRL+C.
- Right-click and select Paste Values.
- Add the column heading ‘Salary’.
- Apply Currency Number Formatting.
So those are some of the techniques we can use to generate a completely unique dataset for use in training sessions, demonstrations and practice sessions.
Also read:
How to Custom Sort Excel Data
Using GETPIVOTDATA in Excel
Ten Ways to Clean Data in Excel
Please visit our free resources center for more high-quality Excel and Microsoft Suite application guides.
Ready to dive deep into Excel? Click here for advanced Excel courses with in-depth training modules.
Simon Sez IT taught Excel and other business software for over ten years. You can access 150+ IT training courses for a low monthly fee.

Deborah Ashby

Deborah Ashby is a TAP Accredited IT Trainer, specializing in the design, delivery, and facilitation of Microsoft courses both online and in the classroom.She has over 11 years of IT Training Experience and 24 years in the IT Industry. To date, she’s trained over 10,000 people in the UK and overseas at companies such as HMRC, the Metropolitan Police, Parliament, SKY, Microsoft, Kew Gardens, Norton Rose Fulbright LLP.She’s a qualified MOS Master for 2010, 2013, and 2016 editions of Microsoft Office and is COLF and TAP Accredited and a member of The British Learning Institute.
Practice makes Perfect.
When you learn about new Excel formula, you would absolutely need resources to help you consolidate this new knowledge, and to apply it to real-life, tangible examples that you can think deeper as to the meaning of the formula you used.
Follow our Editor’s Pick for the top 5 datasets to practice Excel!
You may also be interested in Look Up the Last Value in Column/Row in Excel
Stock Market Data
Available at: Get Share Historical Data // Yahoo! Finance
A primary source of data to practice your Excel skills is stock market data, which is anything but scarce in the web! With some luck you might be able to earn some money by looking at the stock trading volume/price and constructing your own technical indicators too!
Yahoo! Finance offers free downloads for historical stock trading data if you type in each of your stock symbols individually, and navigate to the “Historical Data” tab. Alternatively, try out our “Get Share Historical Data” Excel add-in which gives you the flexibility to download data for many years for multiple stocks simultaneously, all with one button-click!
U.S. Census Data

Available at: Kaggle - US Census Demographic Data
Naturally we also like census data, which we are most familiar with in our daily encounter. The U.S. Census data offered in Kaggle is one of your best bet to start looking at applying your new-found Excel skills to real-life data, such as compare and contrast the average life expectancy of different ethnicity group, in different cities etc.
You might also be interested in Edit The Same Cell In Multiple Excel Sheets
Sports Event

Available at: FiveThirtyEight Data
Are you are football fan? If so, then the Sports dataset offered by FiveThirtyEight might be of interest to you! FiveThirtyEight offers you with sports event prediction tables that are free to download, and the tables provide not only valuable insights to the upcoming sport events, but also a good chance to practice filtering/slicing data in Excel!
Social Engineering

Available at: BuzzFeed Github Repo
Looking to get your hands dirty with social engineering data, showing how different news topic engage with their audience and potentially develop a good marketing strategy for your online brand? Look no further than the BuzzFeed Data and Analyses datasets. BuzzFeed may not be your most credible source of news digest, but data insight is certainly something to look at, especially if you are an online marketer or someone who is interested in learning how social media works!
You might also be interested in 2021 New Year Resolution List for Excel
Google Search Results

Available at: Google Trends
Last but not least, we mustn’t complete our discussion without a honorary mention to the Google Search results dataset! If you are a trendy person and want to know what your neighbours and peers are discussing, Google Trends might be your best buddy to stay abreast! It also allows you to download stuff like the trend and demographics of the people who searched for a particular keyword over time!
Final Words
We hope you enjoy the vast resources online available for your Excel studies! Feel free to drop us an email or comment below if you find anything interesting while exploring the datasets, or if you would like to know if there’s a way to write good Excel formula to anaylze these data! Stay tuned!
Do you find this article helpful? Subscribe to our newsletter to get regular Excel tips and exclusive free Excel resources.
To create a data set using a Microsoft Excel file stored locally:
- Click the New Data Set toolbar button and select Microsoft Excel File.
- Enter a name for this data set.
- Select Local to enable the upload button.
- Click the Upload icon to browse for and upload the Microsoft Excel file from a local directory.
Contents
- 1 How do you create a dataset?
- 2 What is the dataset in Excel?
- 3 Can we create our own dataset?
- 4 Can I create my own dataset for machine learning?
- 5 How do I create an autofill form in Excel?
- 6 How do I create a data model in Excel?
- 7 What is a data set example?
- 8 How do you create a deep learning dataset?
- 9 How do you create a dataset of an image?
- 10 How do you prepare a dataset for analysis?
- 11 What is the process of creating and using a dataset?
- 12 How do you create a training dataset for machine learning?
- 13 What makes a good dataset?
- 14 How do I AutoFill an entire column in Excel?
- 15 How do I align two data sets in Excel?
- 16 How do you add data to a table?
- 17 What does a dataset look like?
- 18 What are dataset entries?
- 19 What are the types of data sets?
- 20 What is dataset in deep learning?
On the Create dataset page:
- For Dataset ID, enter a unique dataset name.
- For Data location, choose a geographic location for the dataset. After a dataset is created, the location can’t be changed.
- For Default table expiration, choose one of the following options:
- Click Create dataset.
What is the dataset in Excel?
A dataset is a range of contiguous cells on an Excel worksheet containing data to analyze. When arranging data on an Excel worksheet you must follow a few simple rules so that Analyse-it works with your data: Title to clearly describe the data.
Can we create our own dataset?
While you can get robust datasets from Kaggle, if you want to creating something fresh for you or your company, scraping is the way to go, for example. if you want to build a price recommendation for shoes you would want the latest trends and prices from Amazon and not 2 years old data.
Can I create my own dataset for machine learning?
Dataset preparation is sometimes a DIY project
If you were to consider a spherical machine-learning cow, all data preparation should be done by a dedicated data scientist.So, let’s have a look at the most common dataset problems and the ways to solve them.
How do I create an autofill form in Excel?
Fill data automatically in worksheet cells
- Select one or more cells you want to use as a basis for filling additional cells. For a series like 1, 2, 3, 4, 5…, type 1 and 2 in the first two cells.
- Drag the fill handle .
- If needed, click Auto Fill Options. and choose the option you want.
How do I create a data model in Excel?
It can be any range of data, but data formatted as an Excel table is best. Use one of these approaches to add your data: Click Power Pivot > Add to Data Model. Click Insert > PivotTable, and then check Add this data to the Data Model in the Create PivotTable dialog box.
What is a data set example?
A data set is a collection of numbers or values that relate to a particular subject. For example, the test scores of each student in a particular class is a data set. The number of fish eaten by each dolphin at an aquarium is a data set.
How do you create a deep learning dataset?
Steps for Preparing Good Training Datasets
- Identify Your Goal. The initial step is to pinpoint the set of objectives that you want to achieve through a machine learning application.
- Select Suitable Algorithms. different algorithms are suitable for training artificial neural networks.
- Develop Your Dataset.
How do you create a dataset of an image?
Procedure
- From the cluster management console, select Workload > Spark > Deep Learning.
- Select the Datasets tab.
- Click New.
- Create a dataset from Images for Object Classification.
- Provide a dataset name.
- Specify a Spark instance group.
- Specify image storage format, either LMDB for Caffe or TFRecords for TensorFlow.
How do you prepare a dataset for analysis?
Data Preparation Steps in Detail
- Access the data.
- Ingest (or fetch) the data.
- Cleanse the data.
- Format the data.
- Combine the data.
- And finally, analyze the data.
What is the process of creating and using a dataset?
The process of creating a dataset involves three important steps:
- Data Acquisition.
- Data Cleaning.
- Data Labeling.
How do you create a training dataset for machine learning?
How to create a machine learning dataset from scratch?
- Detect individual letters in an image.
- Create a training dataset from these letters.
- Train an algorithm to classify the letters.
- Use the trained algorithm to classify individual letters (online)
What makes a good dataset?
A “good dataset” is a dataset that : Does not contains missing values. Does not contains aberrant data. Is easy to manipulate (logical structure).
How do I AutoFill an entire column in Excel?
Simply do the following:
- Select the cell with the formula and the adjacent cells you want to fill.
- Click Home > Fill, and choose either Down, Right, Up, or Left. Keyboard shortcut: You can also press Ctrl+D to fill the formula down in a column, or Ctrl+R to fill the formula to the right in a row.
How do I align two data sets in Excel?
Now you can create a new sheet and click on cell A1 in the new sheet. Now go to Data > Consolidate. In the popup select the range from your first sheet to the reference box and click on Add, after adding the first data select the reference box again and clear the reference box and add the second data set.
How do you add data to a table?
Add a row or column to a table by typing in a cell just below the last row or to the right of the last column, by pasting data into a cell, or by inserting rows or columns between existing rows or columns. To add a row at the bottom of the table, start typing in a cell below the last table row.
What does a dataset look like?
A dataset (example set) is a collection of data with a defined structure. Table 2.1 shows a dataset. It has a well-defined structure with 10 rows and 3 columns along with the column headers. This structure is also sometimes referred to as a “data frame”.
What are dataset entries?
ENTRY: Uses the Numeric data type and stores a value representing the order in which the entries are logged. The example includes seven separate entries by four people, and every entry has a unique number. ID: Uses the Numeric data type and stores an identifying number for the person associated with each entry.
What are the types of data sets?
Types of Data Sets
- Numerical data sets.
- Bivariate data sets.
- Multivariate data sets.
- Categorical data sets.
- Correlation data sets.
What is dataset in deep learning?
A data set is a collection of data.In Machine Learning projects, we need a training data set. It is the actual data set used to train the model for performing various actions.
Disclaimer – The datasets are generated through random logic in VBA. These are not real sales data and should not be used for any other purpose other than testing.
Other data sets – Human Resources Credit Card Bank Transactions HR Analytics
Note – I have been approached for the permission to use data set by individuals / organizations. I just want to clarify one thing. Anything published on this is completely copyright free. You can use anything from this site without any obligation. You can even call the content from this site as your own. Hope, it clarifies. There is absolutely no need to ask for permission for use.
You can download sample csv files ranging from 100 records to 5000000 records. 5 Million records will cross 1 million limit of Excel. But 5 Million Records are useful for Power Query / Power Pivot. These csv files contain data in various formats like Text and Numbers which should satisfy your need for testing.
This data set can be categorized under «Sales» category.
Below are the fields which appear as part of these csv files as first line.
![]()
All files are provided in zip format to reduce the size of csv file. Larges ones are also provided in 7z format apart from zip format to gain further reduction in size.
The Excel containing Macro to generate these records can be downloaded from Country Sales Data Generator. The result data will be populated in Detail tab.
| 100 Sales Records | 1000 Sales Records | 5000 Sales Records | 10000 Sales Records |
| zip, 5 KB | zip, 39 KB | zip, 181 KB | zip, 358 KB |
| 50000 Sales Records | 100000 Sales Records | 500000 Sales Records | 500000 Sales Records |
| zip, 1.77 MB | zip, 3.54 MB | zip, 17.68 MB | 7z, 11.10 MB |
| 1000000 Sales Records | 1000000 Sales Records | 1500000 Sales Records | 1500000 Sales Records |
| zip, 35.34 MB | 7z, 22.20 MB | zip, 52.99 MB | 7z, 33.30 MB |
| 2m Sales Records | 2m Sales Records | 5m Sales Records | 5m Sales Records |
| zip, 78.80 MB | 7z, 44.79 MB | zip, 196.98 MB | 7z, 111.96 MB |