
Connecting your Excel dataset to Power BI is a piece of cake. You won’t have to set up complex configurations or install any plugins or third-party tools. However, this topic includes more than just getting data from a workbook. You may need to load a transformed dataset, connect your Excel file stored on OneDrive or SharePoint to Power BI, and so on. This is why we created this Excel Power BI ultimate guide to make your life easier.
How to use Power BI with Excel
We decided to split our tutorial into two high-level sections:
- Connecting Excel to Power BI desktop
- Connecting Excel to Power BI service
Each of these sections will contain answers to mostly the same questions, such as how to get data from a local Excel file or how to export data from Power BI to Excel.
The Power BI desktop app provides a wide set of connectivity options.
For example, we’ve blogged about connecting Google Sheets to Power BI. Excel is undisputedly the most common data source. Let’s start with it.
Local Excel connect to Power BI dataset
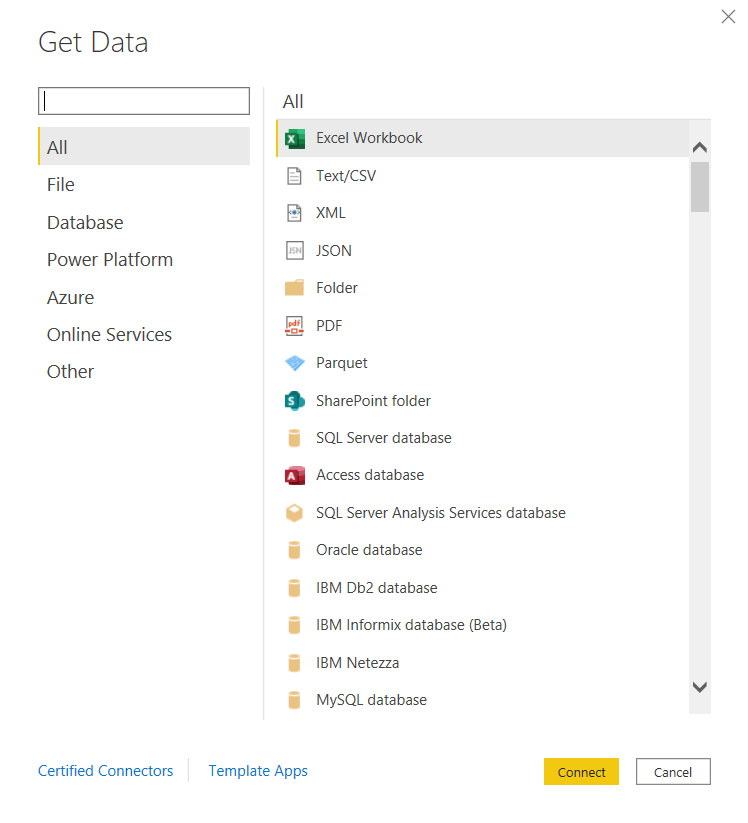
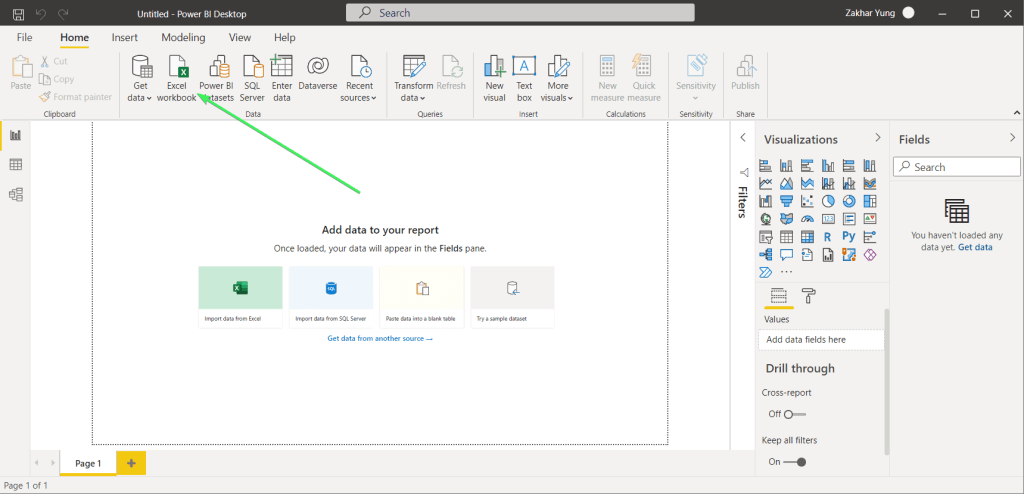
On the Home ribbon, click “Excel Workbook“, or you can select the respective option on the home screen.
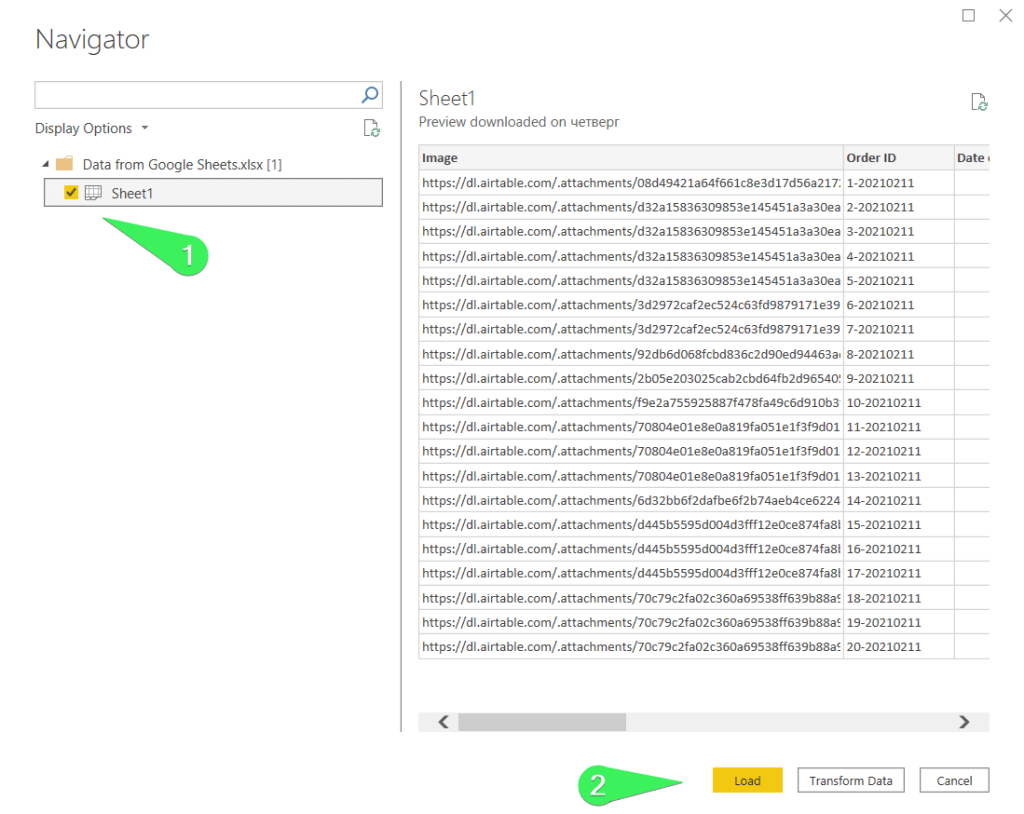
Select the Excel workbook stored on your device and then, once the Navigator window opens, select the worksheet that contains the necessary data. Click “Load“.
Your dataset will be imported from Excel to Power BI.

Transform data before loading
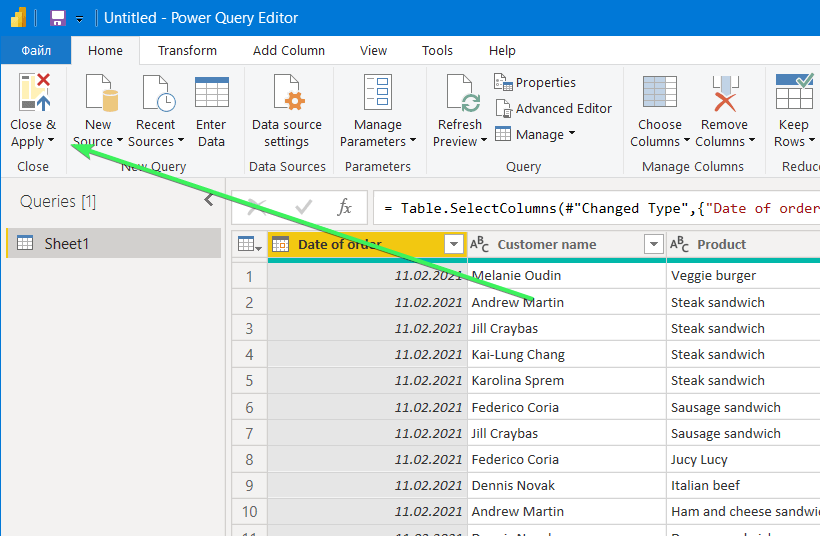
Let’s say, you don’t need to import an entire sheet from Excel to Power BI. Or you may want to rename columns, exclude some rows, or otherwise transform the dataset for import. In this case, once you’ve selected an Excel workbook and worksheet, click “Transform Data“.

The Power Query Editor will open, where you can choose and remove columns/rows, group values, change data types, etc. Check out our Power Query Tutorial for more.
For example, let’s keep a few columns that we’ll use for our Power BI report:

Once you’re done with the data transformation, click “Close & Apply” to load the dataset to Power BI.
And here is the result.

Connect Power BI desktop to Excel OneDrive
Power BI does not provide a preset connection to OneDrive. However, there is a workaround to connect to your Excel workbook stored on OneDrive.
Go to your OneDrive, right-click on the Excel workbook to import, and select Embed.
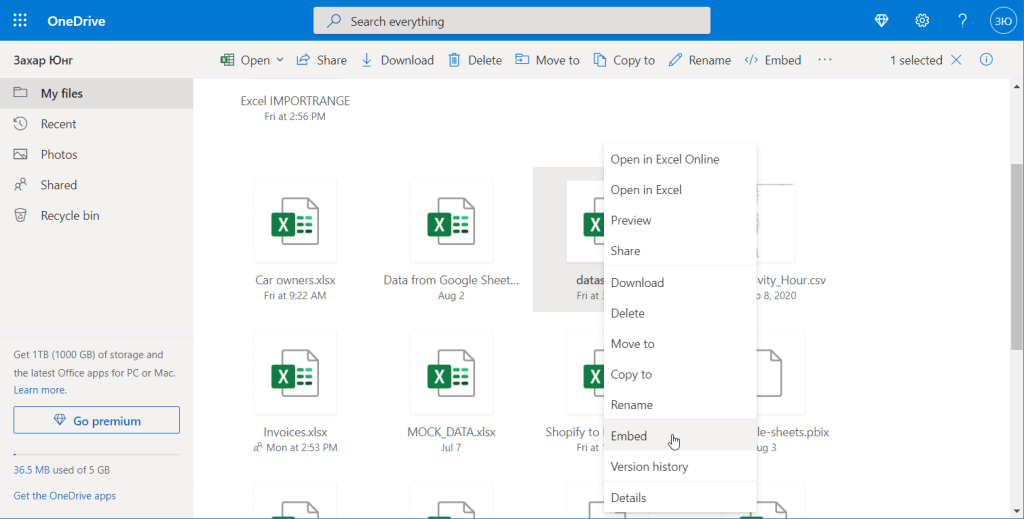
Click the “Generate” button to generate an HTML code for embedding.

You should get a code like this:
<iframe src="https://onedrive.live.com/embed?cid=EC24D8340D235C65&resid=EC24D8340D235C65%213421&authkey=AHVqD34kq_kqoHP&em=2" width="402" height="346" frameborder="0" scrolling="no"></iframe>
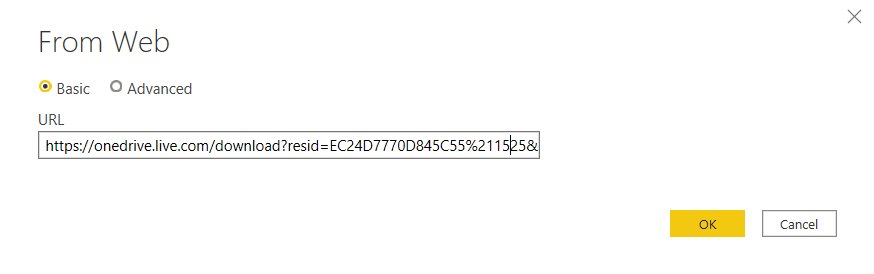
Copy the values from resid and authkey parameters and insert them into the following boilerplate:
https://onedrive.live.com/download?resid={replace-with-your-value}&authkey={replace-with-your-value}&em=x&app=ExcelYou should get the following URL string:
https://onedrive.live.com/download?resid=EC24D8340D235C65%213421&authkey=AMVqX25kq_kwoJK&em=2&em=x&app=Excel
Now get back to Power BI and select Get data => Web

In the open window, insert your URL string and click “Ok“:
Confirm your connection to OneDrive and welcome the Navigator window, where you can select the sheets to import.
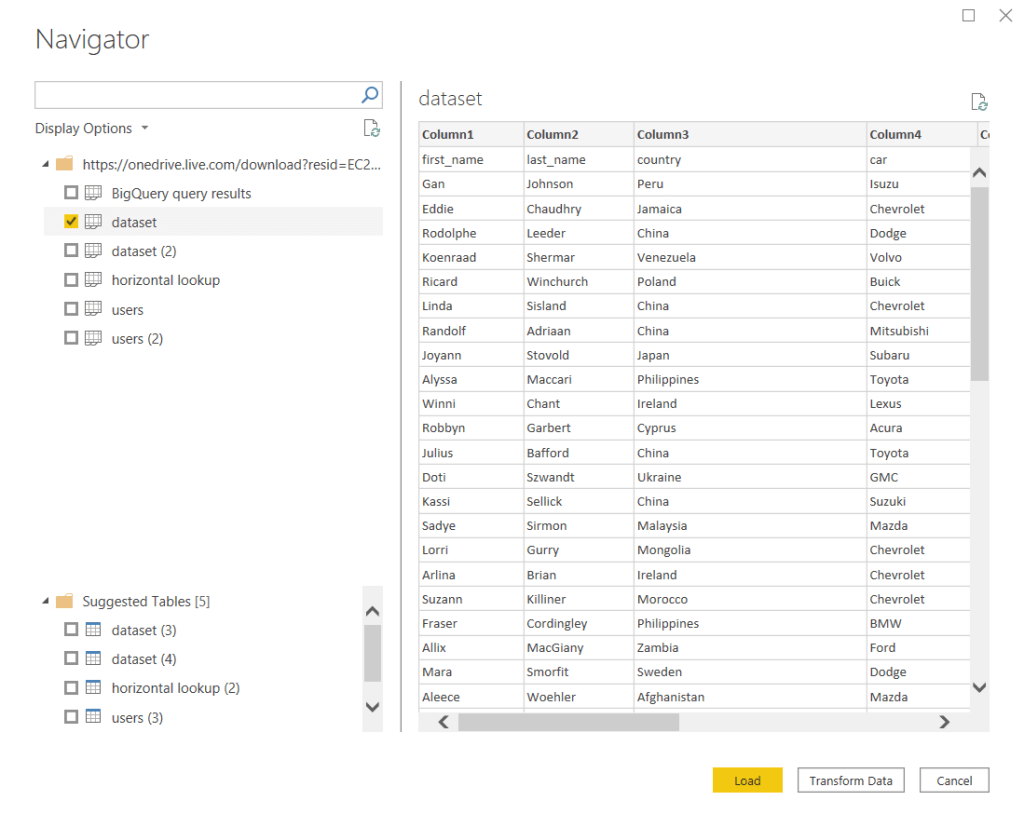
The next steps you already know.
Export data from Power BI to Excel
You can export your reports’ data from Power BI desktop in CSV format. For this, click the three dots in the top right corner of a report and select “Export Data“.

After that you’ll need to select a folder where you want to save a CSV file with your data. That’s it. In Power BI service, you can export reports as Excel files. We’ll cover this part later.
Connect to Power BI dataset from Excel as a mediator
Before talking about Power BI service, we’d like to highlight that you can use Excel as an intermediate point to load data from multiple sources to Power BI. The list of Power BI supported sources is long enough, but it lacks such apps as Shopify, Airtable, Pipedrive, and many others. In this case, you can connect your source to Excel, and then connect Excel to Power BI:
Your data source => Excel => Power BI
We explained the details of such a route in the blog post Shopify to Power BI. To summarize, you can use Coupler.io, a tool for integrating apps and sources with Excel, Google Sheets, or BigQuery. Each integration setup starts includes three steps:
- Source – you need to select a source app, for example, Harvest, connect to it, and select a data entity for export.
- Destination – you need to select Excel as a destination app, connect to your Microsoft account, and choose an Excel file on OneDrive to load data to.
- Schedule – you need to enable the Automatic data refresh and configure the frequency you want.
Here is what an importer can look like:

After that, you need to connect your Excel file to the Power BI desktop, as we described above, or to Power BI service, as we’ll describe next.
Check out the available Excel integrations.
Connect Power BI service to Excel
In the online version of Power BI, click a magic button “Get data“, then “Files“.

Then will be able to load data from Excel files stored locally on your device, or in a cloud service, including OneDrive and SharePoint.

Important note:
The data in your Excel workbook must be formatted as a table, otherwise you will get the following error when importing or uploading files to Power BI.
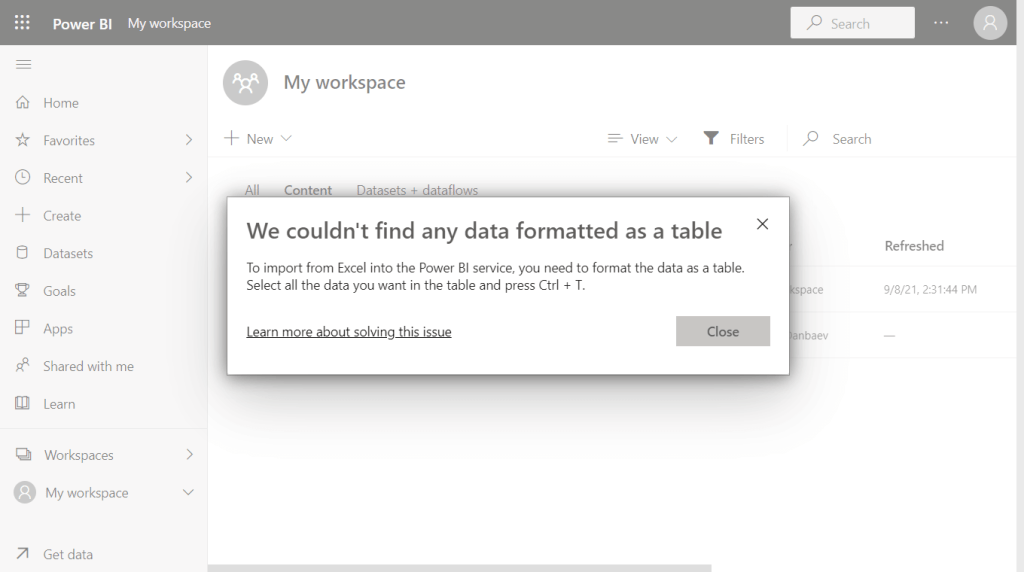
To format a range as a table, open your Excel file, select the range of cells that contain your data and press Ctrl + T. Click “OK” to confirm the creation of a table.

Do the same for ranges in each worksheet.
Now you’re ready to import data from Excel to Power BI service.
Local Excel file to Power BI service
Click the “Local File” button, select an Excel file from your device, and choose how to connect the chosen workbook to Power BI:
- Import Excel data into Power BI (data refresh is available)
- Upload your Excel file to Power BI (no data refresh)

Select the desired option and welcome your data in Power BI. By the way, here is what the Excel file looks like if imported and uploaded to Power BI.

Excel OneDrive to Power BI service
You can load data from OneDrive Personal and Business accounts. Let’s go with the Business one for this example. Click the respective option and select the Excel workbook. Then click “Connect“.

Choose how to connect to your Excel workbook:
- Import Excel data into Power BI (connect a workbook to Power BI with automatic data refresh)
- Connect, manage, and view Excel in Power BI (bring a workbook to Power BI)

Here is what the Excel OneDrive file looks like if imported and connected to Power BI.

Power BI SharePoint Excel
Now it’s time for another cloud storage – SharePoint. Click the respective option and enter the URL of your SharePoint site. For example:
https://marbrecords.sharepoint.com/sites/MBrecords2

Note: Use the URL that corresponds to your homepage of your SharePoint site, like this:
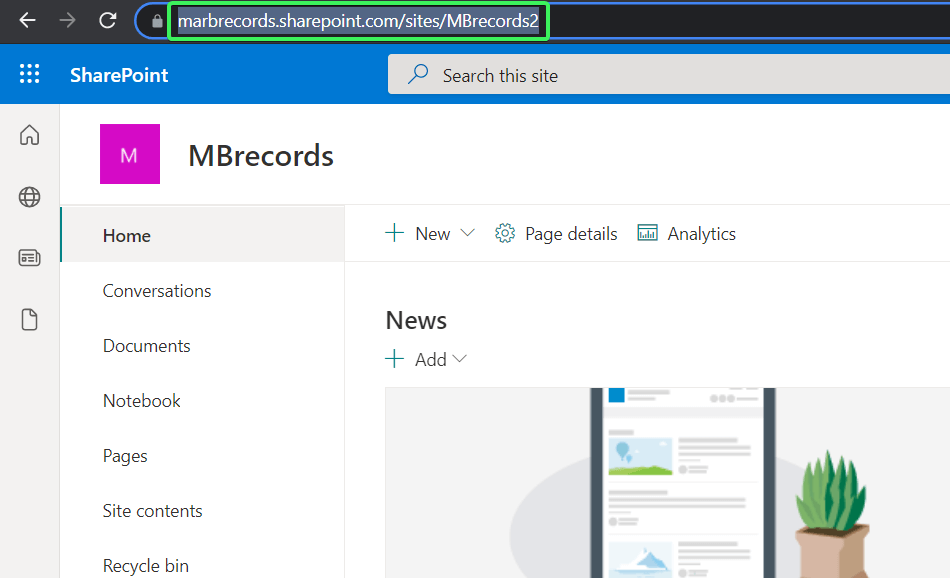
Then choose the folder where your Excel workbook is stored, select the file and click “Connect“.

Then choose how to connect to your Excel workbook. The options are the same as for connecting Excel OneDrive to Power BI:
- Import Excel data into Power BI (connect a workbook to Power BI with automatic data refresh)
- Connect, manage, and view Excel in Power BI (bring a workbook to Power BI)
Export Power BI service to Excel
We promised to show how you can export report data from Power BI service to Excel file. Open your report, click the three dots, and select “Export data“.
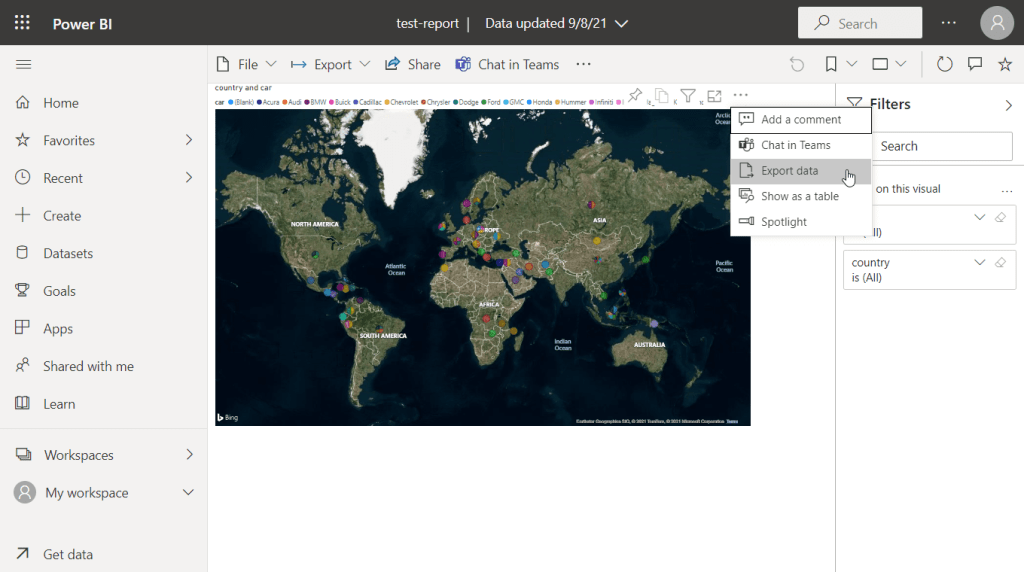
Then you can choose the format for your export file: CSV or XLSX (Excel).
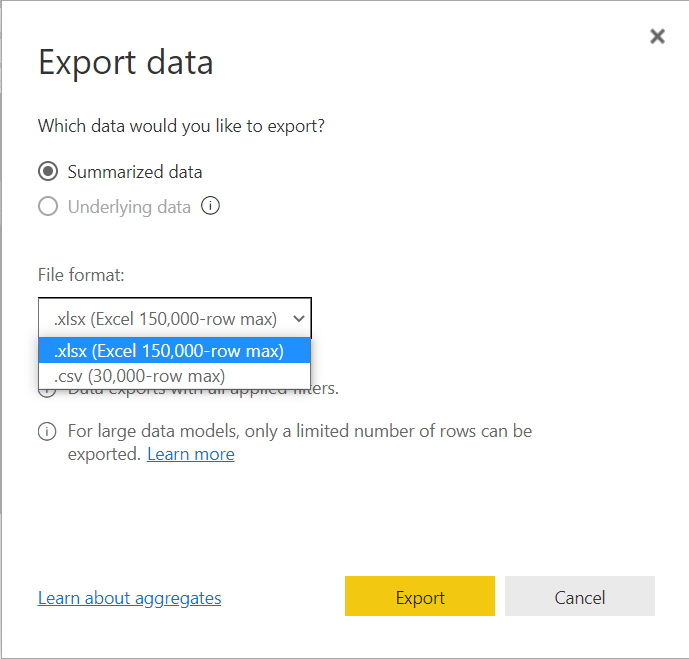
Click “Export” to download the file to your computer.
How often is the Excel to Power BI connection refreshed?
Power BI updates data from the connected Excel files, both local and cloud, on a one hour basis. To manually refresh the dataset, click the “Refresh” button on the Home ribbon.

In case of Power BI service, you’ll need to refresh the connected dataset. Here is the button.

Excel to Power BI or another data visualization tool
Power BI easily connects to Excel and many other data sources. However, this data visualization tool has its limitations and flaws. At the same time, you can consider an alternative, such as Google Data Studio or Tableau. These tools integrate seamlessly with Google Sheets, so, with Coupler.io, you’ll be able to synchronize data from your Excel workbook with Google Sheets. Choose the best dataviz tool for your project and good luck with your data!
-

A content manager at Coupler.io whose key responsibility is to ensure that the readers love our content on the blog. With 5 years of experience as a wordsmith in SaaS, I know how to make texts resonate with readers’ queries✍🏼

Back to Blog
Focus on your business
goals while we take care of your data!
Try Coupler.io
Download various types of Power BI Excel Sample Data for Practice purpose.
Getting started
- SuperStoreUS-2015.xlxs
- Global Super Store Dataset
- Global Super Store Dataset 2016
Map sample Data
- AmazingMartEU2Geo.xlxs
Time Series sample data
- Long-Term-Unemployment-Statistics.xlxs
Quick start with below links
- Power BI Desktop/ Service tutorial
- DAX functions
- Power BI Visualizations
Hope you enjoyed the post. Your valuable feedback, question, or comments about this post are always welcome.
Recommended Post
Power BI Import Mode with SQL Data
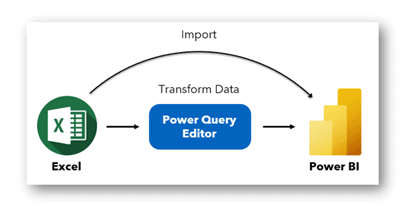
Excel and Power BI are key for data analysts, though Excel is often where people start and stop with exploring data analysis tools. By learning to use Excel with Power BI, you can go further with your data and create sustainable solutions for you and your organization.
This is the first part of the Power BI x Excel blog series, where we will look at the different ways of connecting to Excel files, how to sustain future data, and automate the transformation.
We will also look at some other useful functionalities that involve Power BI and Excel and eventually touch on common data modeling transformation that one would need to analyze data that lives in Excel better.
Sections:
- Your File Location
- Let’s Import!
- Import Table or Sheet?
- To Load or to Transform?
- Import a Sheet with Multiple Tables
- Power BI Can’t Find my Excel File!
Your File Location
If you have your Excel file on your computer hard drive, the first thing to think about before importing the data is, has the file has found its forever home in the right folder and location?
If not, let’s move the file to the right folder and location before importing it in Power BI. It is important to have a permanent location and not move the file after you have imported it.
In Power BI Can’t Find my Excel File, we will look at what happens if we move the Excel file after importing it into Power BI, and how we can solve the issue.
Let’s Import!
Now that your file has a home, let’s import the data into Power BI.
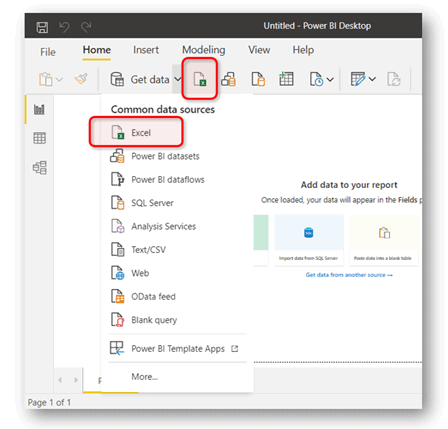
In Power BI Desktop, click Get data and select Excel in the list of common data sources, or just click the icon that has the “x” in a green box.
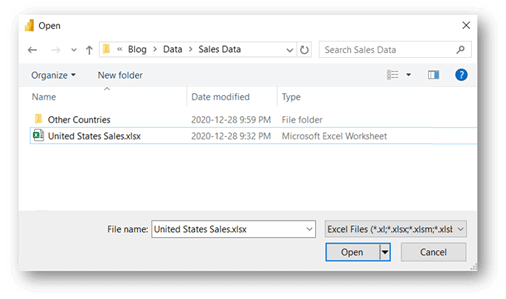
The Open window will pop up and you can navigate to your Excel file. For this demo, I will use the United States Sales file.
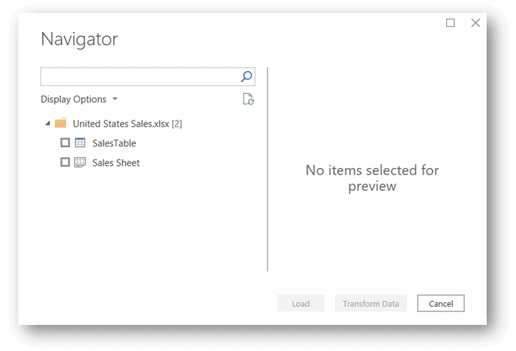
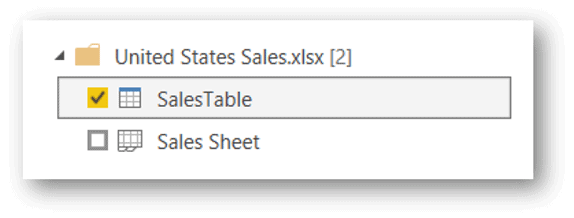
In the Navigator window, you will be able to see the file you have selected and two data import options that you can select, SalesTable and Sales Sheet. These two options may have the same preview when you click on one of them, but they are actually in a different format, as indicated by the icon next to it, Table or Sheet.
Import Table or Sheet?
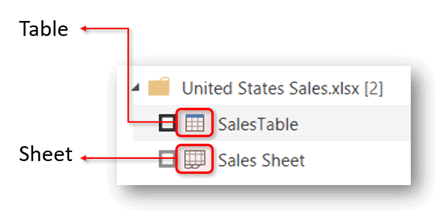
SalesTable has a table icon with a blue header, which indicates that it is a table, while Sales Sheet has the sheet icon. Let’s have a peek into Excel to see where these are and how are they different.
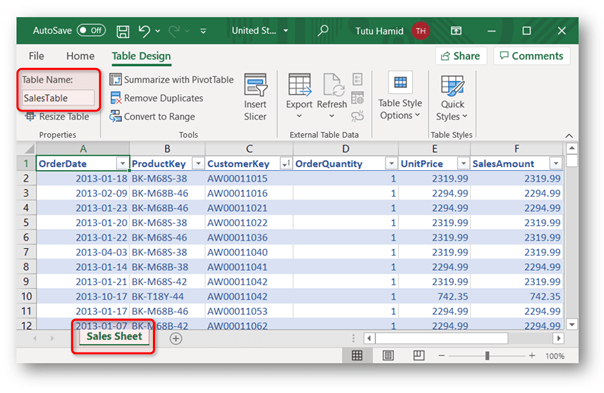
A sheet is denoted by the tab at the bottom left of the Excel window. To find out the name of a table, select any cell in the table, and click Table Design in the ribbon. The difference between a sheet and a table is that a sheet can have multiple tables. Additionally, a table can’t have spaces in the name, this explains why the name of the table we are using is SalesTable, instead of Sales Table.
Going back to our question, do we select a sheet (Sales Sheet) or a table (SalesTable) in the Navigator window? In my opinion, a table is the better option. Once you checked the table, the next question is to Load or to Transform Data?
In Import a Sheet with Multiple Tables, I will demonstrate what happens when we have a sheet that has multiple tables.
To Load or to Transform?
If you choose Load, Power BI desktop will connect to your Excel file and make a copy of (import) all the data in the selected table, and immediately store it in the Power BI data model of your current pbix file.
If you choose Transform Data, you will have the option to perform transformation and data cleansing in Power Query Editor before importing the data into your Power BI data model.
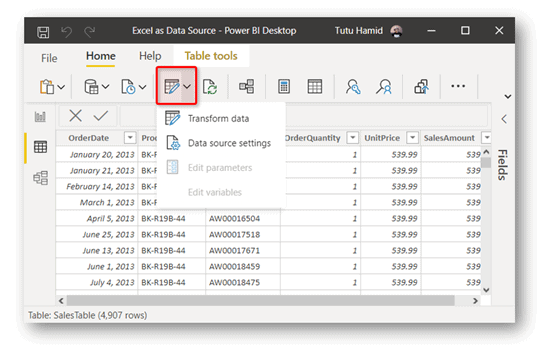
Either way, you will still have the option to return to Power Query Editor once you have imported the data into the Power BI data model by clicking Transform Data in Power BI Desktop.
Struggling with your analytics journey?
Let Iteration Insights get you on the right path, view our services to see how we can help you today.
Import a Sheet with Multiple Tables
If your sheet has only one table, importing the sheet will bring the same result as importing a table. But if your sheet has multiple tables, the imported data in Power BI will be a combination of all the tables in the sheet.
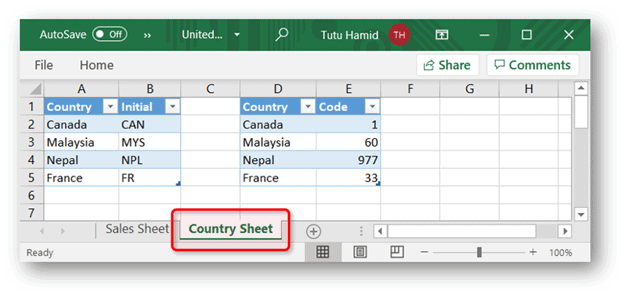
What does that mean? I am going to add another sheet named Country Sheet that has two tables (CountryCode and CountryInitial) into the Excel file and import it into Power BI.
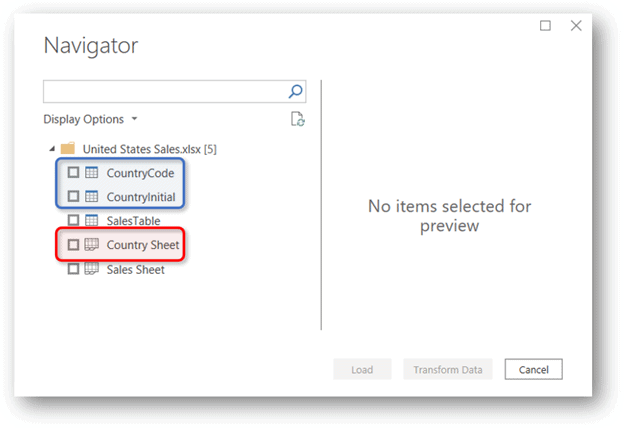
The first thing we will see is more options for sheets and tables. The sheet I just added in the Excel file is denoted by the red box in the above picture while the tables that are in the Country Sheet are also visible in the blue box (CountryCode and CountryInitial).
I will select the Country Sheet and select Load. Here is the imported result in Power BI:
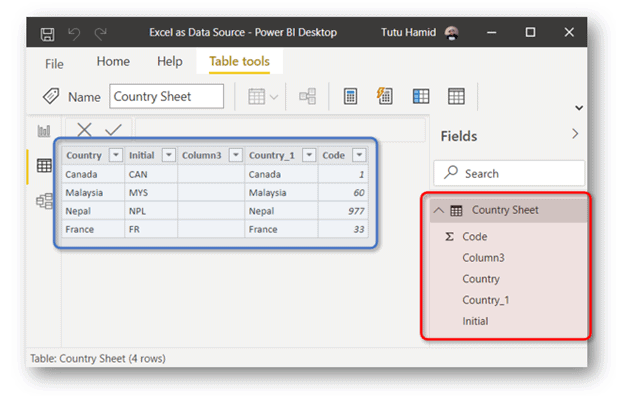
Power BI will take all data that is available in a sheet and combine the data into one single table. That is how the blank Column3 came about but this may not be the result we are looking for. Thus selecting a table instead of a sheet in the Navigator will be a more accurate way to get the right data in this example.
If you have multiple tables in a sheet, and the Navigator was not able to identify the separate tables, you may need to convert the separate tables in the original Excel file into table format by selecting the relevant cells and hitting Ctrl-T.
Power BI Can’t Find my Excel File!
If you accidentally or intentionally move your Excel file into a different folder or change the name of your Excel file, you may encounter the issue where Power BI is not able to connect to your Excel file.
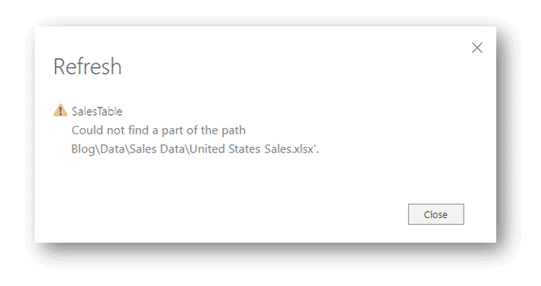
This error will usually appear if you hit refresh on your Power BI file or when you open the Power Query Editor. But don’t worry! We can fix this easily if you know the new location of the file.
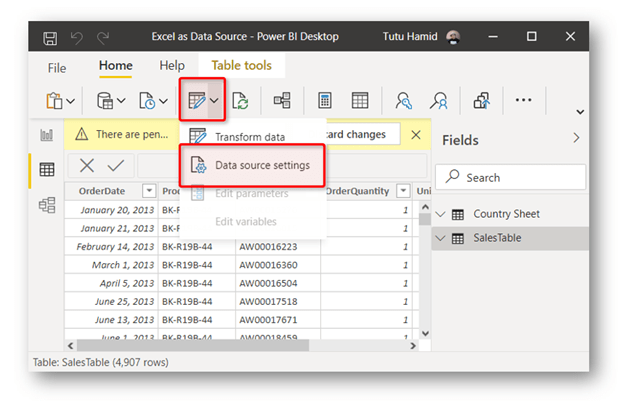
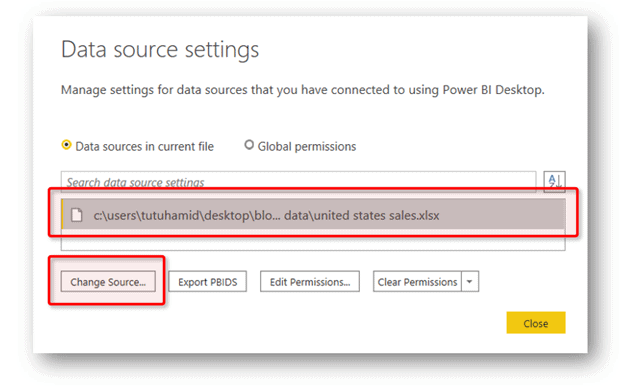
In Power BI Desktop, go to the ribbon, and select Data source settings. In the pop-up window, select the data source (i.e. the Excel file) that needs to be redirected and click Change Source.
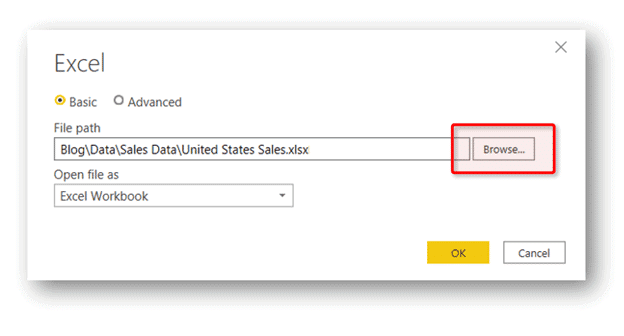
In the Excel pop-up window, click Browse and navigate to the new file location. Click OK and your file will be connected again to your Power BI report.
I hope this little tutorial will help you get started with Excel and Power BI. Stay tuned for more blogs in this Power BI x Excel series. Do you have other questions or recommendations?! Let us know in the comment section below!
One of the most common ways to collect and maintain data in organizations is through Excel sheets. But getting deeper insights from Excel may not always be possible, especially when you are dealing with massive volumes of data. To remedy this, you can use data visualization tools such as Power BI.
You can easily set up the Power BI Excel connection and start making attractive reports and dashboards. Using the simple UI, you can import data from your excel files and begin designing your reports. Power BI has a huge collection of charts, graphs, etc that can be customized according to your business needs.
In this article, you will learn how to effectively set up the Power BI Excel connection in 5 easy steps.
Table of Contents
- What is Power BI?
- Key Features of Power BI
- What is Excel?
- Key Features of Excel
- What are the benefits of setting up Power BI Excel Integration?
- What are the Steps to Export data from Power BI to Excel?
- Power BI Excel Connection Step 1: Extract Data
- Power BI Excel Connection Step 2: Prepare Your Data
- Power BI Excel Connection Step 3: Generate Your Report
- Power BI Excel Connection Step 4: Format Your Report
- Power BI Excel Connection Step 5: Save Your Report and Publish to Power BI Service
- How to Connect to Power BI Datasets with Analyze in Excel?
- Steps to Establish Power BI Excel Connection
- Limitations of Analyze in Excel
- What are the Limitations to Importing an Excel Workbook in Power BI?
- Conclusion
What is Power BI?
Power BI is a data visualization and business intelligence tool that transforms data from a variety of data sources into interactive dashboards and BI reports. The Power BI suite offers multiple software, connectors, and services Power BI Desktop, Power BI services based on SaaS, and Power BI mobile apps available on a variety of platforms. This set of services is used by business users to consume data and create BI reports.
Key Features of Power BI
- DAX Functions: The DAX function is a Data analysis expression included in PowerBI. These analytic functions are predefined codes for performing analytics-related operations on your data. Currently, there are about 200 functions in the PowerBI function library.
- Data Security: Power BI Protects your data with industry-leading data security features such as sensitivity labeling, end-to-end encryption, and real-time access monitoring.
- Flexibility: Power BI allows you to extract data from a variety of sources. For instance, you can easily set up the Power BI Excel Connection and visualize excel data in Power BI. From On-premise to Cloud-based databases, structured to unstructured data Power BI allows you to work with a broader range of datasets.
- Data Filteration: In Power BI, you can create data subsets from several databases and work only on the filtered data that has contextual relevance.
What is Excel?
Microsoft Excel is a spreadsheet application developed by Microsoft to organize and record data in a tabular format. Launched in 1985, Microsoft Excel is a widely used Spreadsheet software in businesses worldwide allowing you to organize and manipulate data through formulas in columns and rows. MS Excel is loaded with functionalities to perform several operations such as calculations, pivot tables, graph tools, etc.
Compatible with Microsoft Windows, macOS, Android, and iOS, MS Excel is included with the MS Office Suite. It is typically used by firms to record, organize and analyze financial data. MS Excel also offers VBA programming that can assist you in automating repetitive tasks.
Key Features of Excel
- Conditional Formatting: MS Excel allows you to apply formats to a cell or range of cells, and have that formatting change depending on the value of the cell or the value of a formula.
- Built-in Formulae: MS Excel provides you with basic and advanced built-in formulae for sum, average, minimum, etc. You can use formula auditing to graph or trace the relationship between cells and formulas with blue arrows. You can track precedents (cells that provide data for a particular cell) or the cells that depend on the value of a particular cell.
- Data Protection: Excel spreadsheets can be password protected on your laptop or PC. MS Excel also provides a robust system to recover data.
- Data Sorting & Filtering: You can easily perform the basic data sorting and filtering operation on your data in excel. MS Excel also provides Advanced filtering options for complex criteria.
What are the benefits of setting up Power BI Excel Integration?
Setting up the Power BI Excel Integration can help assist you in the following aspects:
- Deal with large volumes of data: Power BI has great compression capabilities for Microsoft Excel and text / .csv files that allow you to view, analyze, and visualize large amounts of data that cannot be opened in Excel. Most computers have a hard time opening a 300MB .csv file, which makes it difficult to analyze and report in Excel.
- Analyze Trends Quickly: Analyzing trends with Power BI is very easy. With built-in time intelligence analysis features, it only takes a few seconds to view massive amounts of data. You can see data by various dimensions and attributes, including date and time dimensions.
- Share your Reports: You can now publish to a secure Microsoft cloud service called Power BI Service and automate basic data updates. Just click Publish in the upper-right corner of the Power BI home feed. You can then easily share these reports with your colleagues and collaborate with them.
- Visualization Made-Easy: The great thing about Power BI is that with basic design ideas, it allows you to easily create something visually appealing and neat. Drag-and-drop functionality, easy resizing, and copy and paste make it feel like you’re at home for those familiar with the Microsoft Office suite.
Hevo Data, a No-code Data Pipeline helps to transfer data from 100+ sources to a Data Warehouse/Destination of your choice and visualize it in your desired BI tool such as Power BI. Hevo is fully managed and completely automates the process of not only loading data from your desired source but also enriching the data and transforming it into an analysis-ready form without even having to write a single line of code. Its fault-tolerant architecture ensures that the data is handled in a secure, consistent manner with zero data loss.
It provides a consistent & reliable solution to manage data in real-time and always have analysis-ready data in your desired destination. It allows you to focus on the key business needs and perform insightful analysis by using a BI tool of your choice.
Get Started with Hevo for Free
Check out what makes Hevo amazing:
- Secure: Hevo has a fault-tolerant architecture that ensures that the data is handled in a secure, consistent manner with zero data loss.
- Schema Management: Hevo takes away the tedious task of schema management & automatically detects the schema of incoming data and maps it to the destination schema.
- Minimal Learning: Hevo, with its simple and interactive UI, is extremely simple for new customers to work on and perform operations.
- Hevo Is Built To Scale: As the number of sources and the volume of your data grows, Hevo scales horizontally, handling millions of records per minute with very little latency.
- Incremental Data Load: Hevo allows the transfer of data that has been modified in real-time. This ensures efficient utilization of bandwidth on both ends.
- Live Support: The Hevo team is available round the clock to extend exceptional support to its customers through chat, email, and support calls.
- Live Monitoring: Hevo allows you to monitor the data flow and check where your data is at a particular point in time.
Sign up here for a 14-Day Free Trial!
What are the Steps to Export data from Power BI to Excel?
Power BI provides a beginner-friendly interface to quickly load data from Excel and start visualizing it. To begin setting up the Power BI Excel Integration, ensure that you have Power BI installed on your system. If not done already, you can download Power BI Desktop. You can start building the Power BI Excel Integration by following the simple steps given below:
- Power BI Excel Connection Step 1: Extract Data
- Power BI Excel Connection Step 2: Prepare Your Data
- Power BI Excel Connection Step 3: Generate Your Report
- Power BI Excel Connection Step 4: Format Your Report
- Power BI Excel Connection Step 5: Save Your Report and Publish to Power BI Service
Power BI Excel Connection Step 1: Extract Data
- Step 1: For this Power BI Excel Connection article, you download a sample Financial Excel Workbook. You can also work with any of your Excel workbooks.
- Step 2: Open Power BI Desktop. Navigate to the Home ribbon and click on the Excel option present in the Data section.
- Step 3: Go to the folder where you have saved your workbook and click on the Open button after selecting the file.
Power BI Excel Connection Step 2: Prepare Your Data
Now, a Navigator window will pop up on your screen. It displays an overview of the data so you can be sure that the range of the data is correct. For instance, all the numeric data types are shown in italics. Navigator allows you to transform your data before loading it. Transforming the data can often assist you in creating visualizations that are easier to understand. Follow the steps given below to perform various transformations:
- Step 1: Check the box next to Financials and click on the Transform Data button.
- Step 2: In the given sample data, values of units sold in decimal don’t make sense. Hence, you can transform it into whole numbers. Select the Units sold column and navigate to Transform Tab > Data Type > Whole Number. Click on the Replace current option to change the data type.
- Step 3: To make the segments easier to observe in the visualizations, later on, you can change its format to uppercase. To do that, select the Segments column and navigate to Transform tab > Format > UPPERCASE.
- Step 4: You can shorten the Month Name Column header to Month by just double-clicking the Month Name column, and renaming it to just Month.
- Step 5: For this sample data, it is assumed that the Montana product was discontinued last month, so you can filter this data from your report to avoid confusion. To do that, go to the Product column. Click on the dropdown and clear the box next to Montana.
You can now observe that each transformation has been added to the list under Query Settings in Applied Steps.
- Step 6: Since your data is now prepared, you can go to the Home tab and save the modification by clicking on the Close & Apply option.
You can also notice that Power BI has recognized various filed such as Sales, Discounts, etc of numeric data types by placing a Sigma symbol. It has also denoted the Date field as a Date time entity by placing a Calendar icon.
Power BI Excel Connection Step 3: Generate Your Report
After the data preparation step of the Power BI Excel Connection, you can now move toward creating your reports. To do that, follow these simple steps:
- Step 1: Go to the Insert ribbon on the top, and click on the Text Box option. You can now type the title for this report as “Executive Summary – Finance Report”.
- Step 2: Select the text you typed and set the font size to 20 and bold. You can also resize the box for the text to be in one line.
- Step 3: To create a line chart to see which month and year had the maximum profit, go to the Fields pane. Drag the Profit field to a blank area on the report canvas. You will notice that Power BI displays a column chart with one column, Profit.
- Step 4: Similarly, drag the Date field. You now will see the profit columns for 2 years.
- Step 5: To view profits for each month, go to the Fields section of the Visualizations pane. Click on the drop-down in the Axis value and change Date from Date Hierarchy to Date.
Now, Power BI will display profits month-wise.
- Step 6: You can change the bar chart to a line chart from the Visualization pane.
- Step 7: To see which country had the highest profits, drag the Country field from the Fields pane to a blank area on your report canvas to create a map. Then, drag the Profit field to the map.
- Step 8: You can also find out which companies and segments to invest in. To do that, first, you can create some space by dragging the two charts you’ve built to be aligned side by side in the top half of the canvas.
- Step 9: Click on the blank area in the lower half of your report canvas and select the Sales, Product, and Segment fields from the Fields pane. After you observe a chart, you can drag it to fill the space under the two upper charts.
- Step 10: A slicer is an effective tool for filtering report page visual elements for certain selections. In this case, you can build two different slicers to narrow down the performance for each month and each year. The slicer uses the date field of the original table. You can drag the Date option from the Fields pane to the blank area on the left of the canvas.
- Step 11: Now, select Slicer from the visualization pane. You can also drag the ends to filter, or select the arrow in the upper-right corner and change it to a different type of slicer.
Power BI Excel Connection Step 4: Format Your Report
After preparing the basic report in the 3rd step of Power BI Excel Connection, you can start modifying its format for better visualization:
- Step 1: You can change the theme to Executive from the View pane.
- Step 2: You can also make specific changes to your graphs and charts individually in the Format tab of the Visualizations pane. Select Visual 2 (profits by month & year graph) and change the title text in the title section to “Profit by Month and Year” and Text size to 16 pt with the Toggle Shadow set to On.
- Step 3: Similarly for Visual 3, change the Theme to Grayscale in the Maps section. Like Visual 2, change the title Text size to 16 pt with the. Toggle Shadow set to On for both Visual 3 & 4.
- Step 4: For Visual 5, go to the Selection controls section & toggle the “Select all” option to On. In the Slicer header section, set the Text size to 16 pt.
- Step 5: You can also add a background for the title. For that, go to the Insert ribbon on the top and navigate to Shapes > Rectangle. You can place the rectangle at the top of the page, and stretch it according to the width of the page and the height of the title.
- Step 6: Go to the Format shape pane, in the Outline section and set the Transparency to 100%. You can also set the Fill color to Theme color 5 #6B91C9 (blue).
- Step 7: Now navigate to the Format tab and select Send backward > Send to back. For the title to appear clearly, select the text in Visual 1, the title, and change the font color to White.
- Step 8: Similarly, create and place the rectangle shape for Visuals 2 & 3. Here also, change the Transparency to 100%. & set the color to White 10% darker in the fill section. Finally, go to the Format tab & select Send backward > Send to back.
Power BI Excel Connection Step 5: Save Your Report and Publish to Power BI Service
Coming to the last Power BI Excel Connection Step, you can now save this report by going to the File menu and clicking on the Save option.
Power BI allows you to share your reports with your colleagues via its Power BI service. This allows Power BI account holders to interact with your report but they can’t save changes. To publish your report, follow these steps:
- Step 1: Go to the Home ribbon and click on the Publish option. If you don’t have a Power BI service account, you can opt for a free trial also.
- Step 2: You need to choose a destination such as My workspace in the Power BI service > Select.
- Step 3: Click on the Open ‘your-file-name’ in the Power BI option.
This will open your report in the browser.
- Step 4: Click on the share icon at the top of your report to share it with your colleagues. This completes setting up your Power BI Excel Connection.
How to Connect to Power BI Datasets with Analyze in Excel?
Another aspect of Power BI Excel Integration is bringing Power BI Datasets to Excel using the Analyse in Excel feature. You can then view and interact with them using PivotTables, charts, slicers, and other Excel features.
Steps to Establish Power BI Excel Connection
Follow these simple steps to easily set up the Power BI Excel Connection and analyze your data in Excel:
- Step 1: In the Power BI Service, go to the dataset or report you want to analyze in Excel. Click on the More options (…) next to the dataset or report name and select Analyze in Excel.
- Step 2: Another way for the Power BI Excel Connection is by opening the report and selecting Export > Analyze in Excel.
- Step 3: You can also select a dataset and then click on the Analyze in Excel in the menu bar of the Dataset details pane.
- Step 4: Using any of the above Power BI Excel Connection steps, the Analyze in Excel feature should install automatically. Finally, click on the Download button.
A new Excel workbook will be downloaded to your system that contains an OLAP connection to a Power BI dataset.
After opening the file, you may have to Enable Editing & Enable Content depending on your systems settings.
Limitations of Analyze in Excel
Though Analyze in Excel is an excellent feature for utilizing Power BI Excel Integration, there are some challenges that you might encounter:
- Some firms may have Group Policy rules that prohibit the installation of required updates for Excel. If you are unable to install the update, please contact your administrator.
- Row-level security (RLS) is supported for Analyse in Excel. RLS is applied at the data model level and to all users who access the data in the report.
- When using Analyze in Excel, you may get unexpected results or the function may not work as expected.
- Only PowerBI datasets that use import mode maintain hierarchies in Excel workbook analysis. When using Analyze in Excel, the hierarchy of PowerBI datasets created with DirectQuery or composite models is not preserved.
- While using Analyse In Excel, you cannot change the connection string to specify the locale after the workbook is generated.
- When data exceeds 2GB, an error message may be displayed. In this case, you can reduce the amount of data by applying a filter or using an XMLA endpoint.
- For guest users, Power BI data can’t be analyzed in Excel for datasets sent (from) by another tenant.
- Analyzing PowerBI data in Excel is a PowerBI service feature. It is not possible to analyze Power BI data in Excel using Power BI Report Server or Power BI Embedded.
What are the Limitations to Importing an Excel Workbook in Power BI?
While trying to set up the Power BI Excel connection, there are some challenges that you may face when you import an Excel Workbook in Power BI:
- External Connections to SQL Server Analysis Services Tabular Models: Excel 2013 allows you to connect to SQL Server Analysis Services tabular models and create PowerView reports based on those models without having to import the data. This connection type is not currently supported when importing an Excel workbook into Power BI Desktop. Alternatively, you need to recreate these external connections in Power BI Desktop.
- Hierarchy: Power BI Desktop doesn’t support this type of data model object. Therefore, when you import an Excel workbook into Power BI Desktop, the hierarchy is skipped.
- Binary Data Columns: This data model column type is not currently supported by Power BI Desktop. The binary column of data is removed from the Power BI Desktop result table.
- Unsupported PowerView Elements: PowerView has some features that are not available in Power BI Desktop like Themes or specific types of visualizations (scatter plots using playback axes, drill-down behavior, etc.). These unsupported visualizations display unsupported visualization messages in the appropriate places in Power BI Desktop reports that you can edit or omit as needed.
- Named range using PowerQuery’s FromTable or M’s Excel CurrentWorkbook: Importing this named range data into Power BI Desktop is not currently supported, but is a planned update. These named ranges are now loaded into Power BI Desktop as a connection to an external Excel workbook.
- PowerPivot to SSRS: External PowerPivot connections to SQL Server Reporting Services (SSRS) are not currently supported because this data source is not currently available in Power BI Desktop.
Conclusion
In this article, you have learned how to effectively set up the Power BI Excel integration. Power BI Excel connection enables you to easily import data from Excel and gets you started with your report generation in minutes. With a user-friendly interface and a vast collection of visualization features, you can create visually stunning and informative dashboards and reports.
As you collect and manage your data across several applications and databases in your business, it is important to consolidate it for complete performance analysis of your business. To achieve this you need to assign a portion of your engineering bandwidth to Integrate data from all sources, Clean & Transform it, and finally, Load it to a Cloud Data Warehouse, BI Tool like Power BI, or a destination of your choice for further Business Analytics. All of these challenges can be comfortably solved by a Cloud-based ETL tool such as Hevo Data.
Visit our Website to Explore Hevo
Hevo Data, a No-code Data Pipeline can seamlessly transfer data from a vast sea of 100+ sources to a Data Warehouse, BI Tool like Power BI, or a Destination of your choice. It is a reliable, completely automated, and secure service that doesn’t require you to write any code!
If you are using Power BI as your Data Analytics & Business Intelligence platform and searching for a no-fuss alternative to Manual Data Integration, then Hevo can effortlessly automate this for you. Hevo, with its strong integration with 100+ sources and BI tools(Including 40+ Free Sources), allows you to not only export & load data but also transform & enrich your data & make it analysis-ready in a jiffy.
Want to take Hevo for a ride? Sign Up for a 14-day free trial and simplify your Data Integration process. Do check out the pricing details to understand which plan fulfills all your business needs.
Tell us about your experience of setting up the Power BI Excel Connection! Share your thoughts with us in the comments section below.
A while ago I wrote a blog post about Power BI Publisher for Excel. Today I want to explain some new features added to the publisher. In this post you learn how to analyse Power BI data in Excel. Using the new Power BI Publisher for Excel, not only can we pin an Excel range or chart to a Power BI dashboard directly from Excel, but also we are now able to easily connect to a Power BI service, select any group workspaces and analyse a desired report or dataset.
Requirements
- Desktop versions of Microsoft Excel 2007 and later
- Download and install Power BI Publisher for Excel
- Power BI Publisher for Excel add-in will be enabled by default after you install it, however, if you don’t see the “Power BI” tab in the ribbon in Excel you can enable it from File –> Options –> Add-ins –> COM Add-ins –> tick Microsoft Publisher for Excel.

Connect to and Analyse Power BI Data in Excel
Analyse Power BI Service Reports or Datasets in Excel (From Power BI Service)
Previously we could analyse Power BI data in Excel directly from Power BI service by:
- Log in to Power BI Service
- Clicking ellipsis button of a desired dataset and clicking “Analyse in Excel”

- Clicking ellipsis button of a desired report and clicking “Analyse in Excel”

- Doing either way, it downloads an “odc” file that could be opened in Excel.

- Now you can analyse the data in Excel using pivot tables and pivot charts.

Analyse Power BI Service Reports or Datasets in Excel (Directly From Excel)
With the new Power BI Publisher add-in for Excel we can now easily connect to a Power BI service account and analyse the reports and datasets directly from Excel:
- After you install the Power BI Publisher for Excel, click “Connect to Data” from “Power BI” tab from Excel ribbon

- If you haven’t already logged into your Power BI service you will prompt to login. Enter your email address associated with Power BI service account and click “Sign In”

- Select a workspace, report or dataset then click connect

- Now you can analyse the data in Excel without needing to download “odc” connection file like what we used to when we wanted to analyse a report or dataset from Power BI service.

- If you do not have any data in your Power BI service, the published add-in detects that and offers you to create sample data in Power BI. Click “Connect to Sample”


- If you login to your Power BI service you’ll see the sample

Switching Between Power BI Accounts
If you have different Power BI service account and you’d like to switch between your accounts and analyse the different accounts from Excel just click “Profile” from “Power BI” tab from the Excel ribbon then click “Sign Out”.

Now click “Sign In” and use your other Power BI service account credentials.

Note: To make this work you have to close Excel and reopen it while you switched to another account from the Power BI Publisher otherwise you’ll get the following error:
“Error Code: 403 (Forbidden) GroupNotAccessible”
 GroupNotAccessible")
 GroupNotAccessible")
Considerations
There are a few limitations applied to the current version of Power BI Publisher for Excel. In this section I briefly discuss those limitations.
Shared data is NOT available in Power BI Publisher for Excel
The data that is shared with you in Power BI is not available in Power BI Publisher for Excel. To check this limitation, open your web browser and login to a Power BI service account and make sure you have some data shared with you. The following screenshot shows an account that has no datasets and reports, but, it has a shared dashboard.

Now connect to the same account from Power BI Publisher from Excel and you’ll the shared data is NOT available.

Power BI Workspace Groups
If your Power BI account is a member of a workspace group that shared dashboards, reports and datasets with its members, and if “Edit Power BI Content” is not granted to your account, then you won’t be able to see reports or datasets in Power BI Publisher. You also cannot see the workspace that you don’t have “Can Edit Power BI Content” permission on in the Power BI Publisher.
The following screenshot shows a Power BI account that is a member of two workspace groups named “Sales (Read only)” and “Sales (Edit enabled)”. The account doesn’t have “Can Edit Power BI Content” rights on the “Sales (Read only)” workspace. But, it has the right to edit Power BI content on “Sales (Edit enabled)”. As you see there is a report and also a dashboard shared with this account under “Sales (Read only)” workspace.

When I connect to that account from Power BI Publisher, I cannot see the data associated with the “Sales (Read only)” workspace. Indeed the “Sales (Read only)” workspace is not even in the list.

However, I can connect to the “Sales (Edit enabled)” workspace and analyse it in Excel.

Analysis Services (SSAS) On-premises
If you want to analyse a Power BI dataset or report that originates from an on-premises SSAS Multidimensional or Tabular model and the dataset in Power BI uses “Connect Live” to access the data, then you should be aware that the Power BI Publisher for Excel connects to SSAS through your local network. This means that any user trying to analyse an SSAS dataset in “Connect Live” mode must be connected to your local network. The user should be also authenticated on your SSAS server.
This is what you see if you try to connect to an SSAS dataset or report from Power BI Publisher for Excel:


UPDATE
Admin Settings for On-premises Analysis Services Data Controlling “Analyse in Excel”
If you are an Office365 Global Admin and you want to control whether or not the users in your organisation can analyse your on-premises SSAS data in Excel, with the July 2016 update you can do that. This option is enabled by default so if you want to disable it:
- Log into Power BI Service
- Click “Settings” then click “Admin Portal”

- Click “Tenant settings”
- Switch off “Allow users to Analyse in Excel with on-premises datasets” then click “Apply”

Now, if you click “Analyse in Excel” in Power BI Service you get the following message:

You won’t be able to connect to a dataset/report and Analyse in Excel from “Power BI Publisher for Excel”.
