
This free customer journey map template is designed to quickly and easily build relatively detailed maps for multiple brand personas. Customer journey maps are an effective way of identifying how potential customers make their way to your brand and ultimately become loyal advocates.
Download the free template here… customer-journey-map-Excel-template
The template gives you significant flexibility and power in developing a journey map. It is structured around a series of purchase phases that a consumer would go through. In each of these purchase phases, you have the ability to choose from a drop-down menu to quickly populate the various brand touchpoints that they may consider.
In addition, the template provides the flexibility for you to add your own touch points and various steps and brand interactions. In other words, you can use the full functionality of the template, or you can add your own brand touch points that are specific to your industry or firm.
It is Excel-based and is very easy to use. Even people who don’t normally use Excel will be able to construct a journey map very quickly.
Please note there is a “how-to-use” video at the bottom of this post, if required, or you can continue reading for written instructions below.
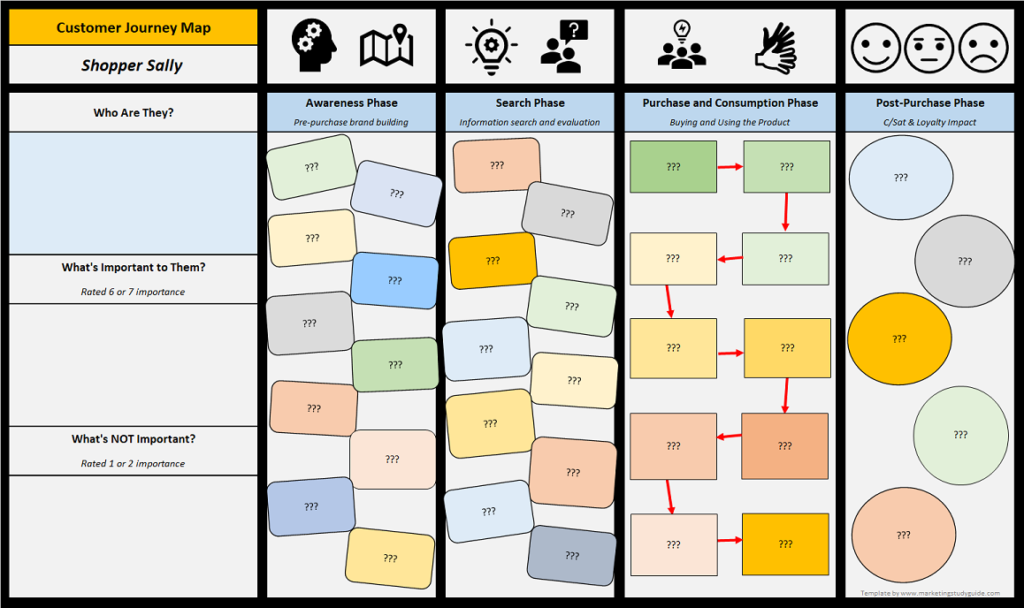
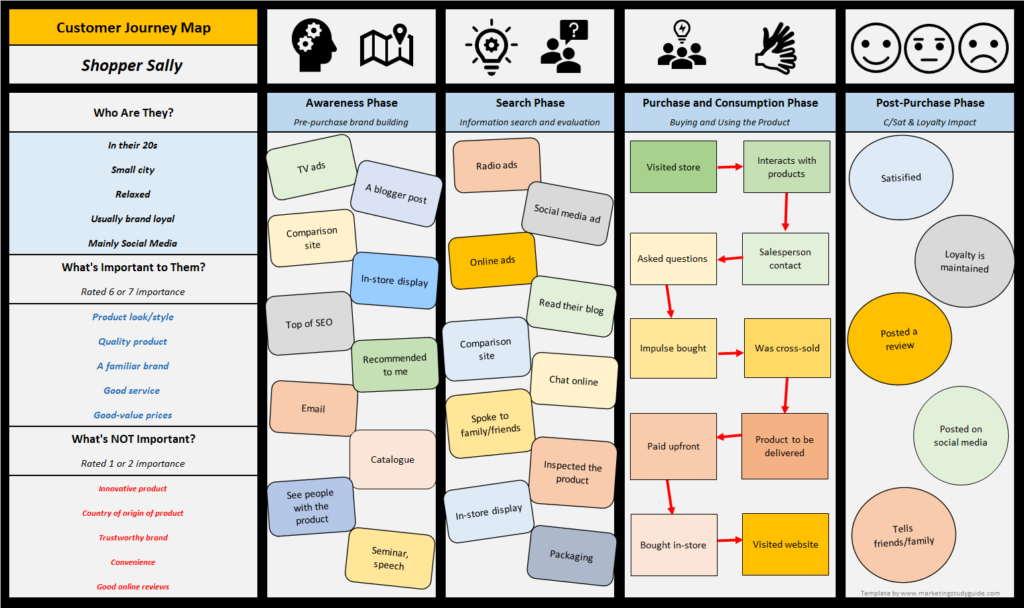
Examples of a Final Customer Journey Map
Here is an example of a customer journey map that was built using the template. This one is for “Shopper Sally”…
And here is another example, this time for “Bargain Barry”…
How to use the CJM Template
You start off by downloading the free template by using the download link that has been provided at the top of this article.
When you open the template, you will start at the “information” worksheet. This provides basic instructions to follow.
You then work from left to right through the various worksheet tabs, to populate and select items for your final journey map. As you can see below, the various tabs include: brand persona, awareness, search, purchase and consumption, post sales, fine-tune the map, and then the map is produced.
![]()
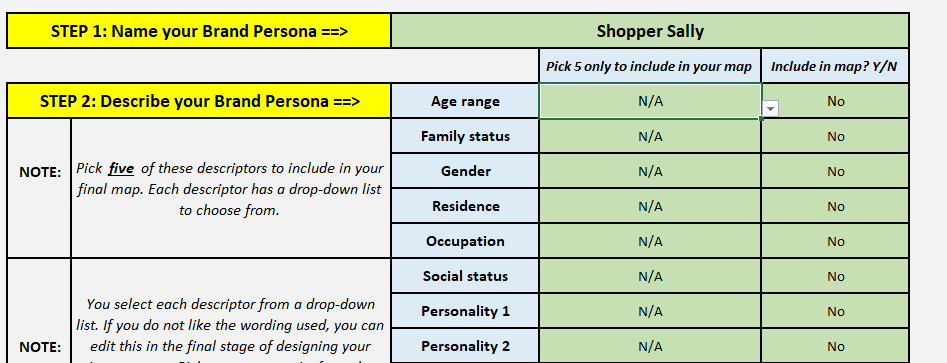
Brand Persona Worksheet
In this section you will give your brand persona a suitable name. Usually we try for a descriptive name, something that is short (a few words), but also gives a sense of what the brand persona is all about. Some examples could include:
- Shopper Sally
- Bargain Barry
- Busy with the kids
- Efficient and fast shoppers
- Love to browse
As you can see, they can be a normal name combined with some sort of action, or a phrase that describes their behavior. Remember that you should be producing multiple customer journey maps for different brand personas.
The options within this worksheet to define your brand persona include:
- Their descriptive name (as mentioned above)
- Demographic, psychographic and various other descriptors
- What they are looking for in their purchases = what is important to them
- And what is NOT important to them in their purchase decisions and shopping behavior
For the descriptors and the importance ratings, the template allows you to include five of each – giving 15 pieces of information about your brand persona, plus your descriptive name that you have allocated.
In each case, there is a series of drop-down menus provided with multiple ways of describing your brand persona, or you may add your own as well. Here is an example of how it looks in the template.
For each of these descriptors (and there are more in the template), there is a drop-down menu you selects the most appropriate response. The final column – include in map – allows you to add/edit your map very quickly.
Awareness Worksheet
The next worksheet is the first stage of the overall customer journey. This is a “pre-search” phase, where the consumer is not actively looking for your product, but has accumulated knowledge and information about your brand (or its competition) over time.
As a simple example, many people would know of car brands such as Mercedes-Benz and BMW – but only a small proportion of those have ever actively engaged in a purchase decision for one of these brands. This means that consumers accumulate knowledge and form attitudes prior to engaging in a purchase decision.
This is where the awareness “pre-search” phase comes in. Here you identify, from a list of around 50, what are the relevant brand touchpoints that have contributed to the formation of the consumers’ (your brand persona in this case) awareness and attitude towards the brand.
Here is a sample from the awareness worksheet, that outlines just some of the brand touch points that are available to be included in your customer journey map:
Again, you just indicate on the template whether or not you want this particular brand touchpoint to be included in your map for this brand persona in this particular main phase of their customer journey.
The final customer journey map will show 10 of these brand touchpoints. If you have unique brand touch points that you want to include, then the template allows you to do this and add your own.
Search, Purchase and Consumption, Post-Sale Worksheets
The processes in the same for the next three worksheets in the template. You work through the next stages of the customer journey, highlighting relevant brand touchpoints, consumer steps and interactions with the firm. Like before, these are all driven through drop-down menus or you can choose to add unique ones as well.
In the Search phase, the buying decision process has been activated. In other words, the consumer has gone through need/problem recognition and has decided to consider buying this product. As a result, they entered the “information search” and “product evaluation” stages of their buying decision process.
In the Purchase and Consumption phase they have completed their review and evaluation of options, and have made a decision on which brand/product to purchase. This phase looks at the purchase and consumption activities of the consumer.
And as the name suggests, the Post-Sale phase is after the consumer has purchased and used the product, and considers the impact on brand loyalty, customer satisfaction, word-of-mouth, and so on.
Map Fine-tuning
Just before we review the final map, we have the opportunity to review the components of the map. This is done in the fine-tuning worksheet, where we prioritize and sequence the various brand touchpoints and interactions.
It is likely that we have selected more than 10 brand touchpoints for each phase, so in this section we can choose the 10 that we want to appear on the final map. And again, we are guided through the process through the instructions on the Excel template.
Final Customer Journey Map
This is automatically produced by the template as you complete the various drop-down menus where you select the relevant brand touchpoints for your brand persona. There are examples of the output shown above for both Shopper Sally and Bargain Barry.
If we want to refine our customer map, we can go back to the relevant worksheets or go back to the fine-tune worksheet to adjust.
Once we are satisfied, we can copy and paste the customer journey map into our presentation, report, or other document. Remember to produce multiple customer journey maps for different brand personas.
Customer Journey Mapping Workshop Tool
One of the benefits of this mapping template is that it is easy to use and would be good to use either in the classroom or in a mapping workshop session. This is because there are multiple options built-in and it is easy to follow along and see what is happening. The template also allows for quick editing and fine-tuning.
However, if not all participants have access to Excel, then the following blank customer journey map could be provided as a guide for a hands-on poster board activity.

Video: How to use the Template
Academic Reading
Mapping The Customer Journey
Customer Journey Mapping as a Method to Understanding the User Experience
Excel is such an incredible tool that offers almost everything for your ease. Its templates are amazing. If you are the one who is facing a problem while managing your task, you can set everything with its templates.
10 beautiful excel customer journey map template depicts your consumers’ encounters with your brand, business, and experience across all of its touch points. A customer journey map, also known as a user journey map, could incorporate many touch points that a consumer would encounter, such as activities, touchpoints, and more, as well as pain areas. 10 Beautiful Excel Customer Journey Map Templates are listed below with links and photos for your ease.
Customer Satisfaction Survey Template
The customer Satisfaction Survey template is created to check out the customer’s reviews and whether they are satisfied with the company’s product or not. Customers’ response is important for the company, so excel offers a customer journey template for their customer’s satisfaction.
Customer Management System Template
The template for the customer management system is created specifically for customer management. Excel offers a customer journey template for its customers’ pleasure because the company values customer feedback.
Customer Complaint Record List Template
The customer’s complaint list record template offered by excel is the best thing a company can do for their customer’s satisfaction. If a customer faces any problem, they can put it in the complaint box. It is now freely available at the WPS office.
Customer Feedback Record Form Template
The customer feedback record template offered by excel is the best thing a company can do for their customer’s satisfaction. If a customer faces any problem, they can put it in the complaint box and even send their feedback through the phone to the company. It is now available for mobile phones also.
Customer Contact Record Template
For informing customers about the new products, best quality, sales, all these things need the customer’s contact information. So, the company will inform the customer and benefits customers. All these services are done by using a customer journey mapping template.
Customer Registration Form Template
Customers’ registration form template is offered by the WPS office free of cost. Get it now for free if you don’t get this spreadsheet earlier.
Company Customer Order Analysis Form Template
The WPS office provides a free company customers’ order form template for managing client orders. If you don’t already have this spreadsheet, download it for free.
Client Information Form Template
The WPS office provides a free company client information form template for managing clients’ information. If you don’t already have this spreadsheet, download it for free.
User Experience Questionnaire Template
This template is designed to generate a questionnaire for the customers about whether they are satisfied with the services or not.
Table Style Customer Information Template
Table Style Customer Information template is designed for the customers to gather information in tabular form.
The conclusion
Your customers’ interactions with your brand, company, and experience across all its contact points are shown in 10 beautiful excel customer journey map templates. The WPS office offers a huge variety of free excel templates for you to easily download your favorite template according to your choice. Download the WPS office and get your favorite templates if you don’t already have one.
Learn step-by-step how you can quickly create a customer journey map using these free tools.
Published in: Journey Mapping / Last update: December 2020
Are you looking to create a customer journey map and don’t want to invest in a new tool?
Well, in that case Excel or Google Sheets might just be the tool you’re looking for.
This article will show you step-by-step how you can use these tools to create a customer journey map, without going crazy.
You’ll also learn how Excel and Google sheets stack up against other journey mapping tools. You might get surprised.
So let’s get right into it and start creating our journey map.
The journey we’re going to map in this example is that of an over excited dad going for trip to the Zoo with the kids.

Click the image to open the customer journey map template in Google Sheets
You can access the final customer journey map that we’re going to create in this article and use it as a template. Just click the image above and make a copy of that journey map in Google sheet.
Creating the map structure
Prepare
In this example we’ll be using Google Sheets but most things should just as easily translate to Microsoft Excel.
First thing you need to do is to create a new document. From the start I like to turn off the gridlines so it looks less like a spreadsheet. (View > Gridlines)

Turn off gridlines to get rid of that spreadsheet feeling
Let’s add the title and add the customer segment to the top row so we know what we’re working on.

Add a title and describe the customer segment
Step 1: Creating lanes
We’re going to create basic structure of our map using 4 lanes: 1) Phases, 2) Customer Activities, 3) Customer Needs and 4) Customer Emotions. Just add those names in the top 4 rows.

Add the 4 main lanes to your journey map
What you want to do next is change the background color of the lanes.

Change the background color of your lanes to make them visually stand out
And let’s give them a bit more space for visual clarity.

Make your lanes higher to create some space
Finally we’re going to add separator lanes which will be very useful later when we need to expand the map.
To add a separator lane just take a column, set the background color to be a bit lighter than the original color and set the size to be about 20.

Add separator lanes to make your life easier in the future
You might be tempted to use cell borders as separator lanes but I’ve found that it gets very messy really fast. Working with stand alone separator lanes is faster and more flexible.
By the way if you need help setting up the basic structure of your journey map check out the customer journey mapping essentials masterclass which explains it all in more detail.
Step 2: Adding details
In a physical setting you’d now start filling your journey map by adding sticky notes to it.
Adding virtual sticky notes to your journey map is really straight forward in Google sheets. You just need to fill in the blank cells with data.

Use cells to add details to your journey map
A really useful feature is that you can format the text inside a cell. So you can make words bold or color them red to add emphasis. You can change the font size of words and even turn them into links.

Change the text formatting to emphasise elements in your cards
When you have a lot of text in your cell it will get cut off. In that case just change the text wrapping property.

Set your text to wrap inside a cell
You might want to set the text wrapping at the start of your project so that when you’re duplicating rows and columns to expand your map they will all have this setup correctly.
We’re going to fast forward and fill the phases, customer activities and customer needs lanes of our map.
Step 3: Adding the curved lane
It’s time to add the iconic lane that has made journey maps famous. The curved lane that indicates how your customer feels about the experience. We’re going to add that to the customer emotions lane.
Drawing curved lines isn’t what spreadsheets are made for but there’s a pretty good alternative.
First thing you need to do is to add 5 sub lanes under th customer emotion lane. Give these sublanes a background color that has lighter shade.

Add 5 sub lanes to the customer emotions lane
The top sublane will represent a satisfied or happy emotion. The bottom sub lane is the unsatisfied or unhappy emotion. To clarify that just add an emoticon.

Add emoticons to the customer emotions lane
Now to create the curved emotion line the only thing we need to is to give the correct cell that corresponds to a customer activity a background color. You might want to use green for satisfied and red for unsatisfied.

Create a nice curved lane by changing the background color in cards
In the tutorial video that’s at the top of this article you can learn how you can have the background color automatically appear in the cell with the press of a single button. So if you want to save some time check that out.
Step 4: Adding empathy
This might sound like a strange step but it’s a really important one. Journey maps help you to step into the shoes of your customer.
The problem that we have is that a spreadsheet doesn’t evoke a lot of empathy. Otherwise every journey map would be a spreadsheet right?
So how do we fix that? We need to add human layer to it.
A simple way of doing that is by using emoticons throughout your map. This already shifts it away from being a purely left brain overview.
But even a better way is by adding images and photos to tell the story. In Google sheets you can add an image into a cell (Insert > Image > Image in cell).

It’s easy to add images to your journey map
So think about adding photos that you gained through user research to your map. Or if you haven’t done any research just make a drawing of the customer activity and add that.
The caveat is that the image will be have the size of the cell so often it will be quite small.
Step 5: Adding clarity
This might sound like a strange step but it’s a really important one. Journey maps help you to step into the shoes of your customer.
The problem that we have is that a spreadsheet doesn’t evoke a lot of empathy. Otherwise every journey map would be a spreadsheet right?
So how do we fix that? We need to add human layer to it.
A simple way of doing that is by using emoticons throughout your map. This already shifts it away from being a purely left brain overview.
But even a better way is by adding images and photos to tell the story. In Google sheets you can add an image into a cell (Insert > Image > Image in cell).

Reduce complexity in your journey map by using subgroups
You’ll see a + icon appear next to your lanes. By clicking that icon you can collapse or expand those lanes.
You can have multiple subgroups inside each other. So for instance we can collapse the customer emotions lanes while also being able to collapse the entire front stage section of your map.

Show or hide entire sections of your map using subgroups
If you feel the need to create nest more than 2 subgroups inside of each other it’s probably a sign that you need to break your journey map down into smaller maps.
Advanced features
A customer journey map isn’t a static deliverable. It’s an evolving change plan that you use to drive customer centric innovation.
So now that we have our basic journey map set up let’s look at some of the more advanced features. These are features that will make your life a lot easier when you use your journey map on a day to day basis.
Updating the map
Using the journey map means updating the map. You’ll want to add and remove details in the map.
This is where you see a clear distinction between different journey mapping tools. Some tools are great at visualizing the map but break apart when you need to change things.
Let’s see how easy this is using Google sheets.
Lanes
Changing the order of lanes is as simple as dragging and dropping them. The only thing you need to be mindful of is when you have selected lanes that contain merged cells.

Drag rows or columns to update your journey map
Adding new lanes is also really straight forward. Just right click in the place where you want to insert the new lane and add it.

Adding new lanes is easy
Here you will benefit from having the separator lanes set up as described in step 1.
Cards
Let’s say you want to add a new customer activity to your map. The way to do that is by inserting a new row. Just right click in the place where you want to insert it and select add.

Add a row to make room for new cards
Keep in mind that when you insert a new row you will get a empty cell in all your lanes. This is usually what.
Moving individual cards around is a bit more difficult. You can’t just drag and drop them

Moving a card means doing some manual copy and pasting
You will need to manually cut and paste the content of the card to your desired cell. It’s not hard. Especially if you learn to use the keyboard shortcuts.
Tracking status
This is one of the most overlooked features by people who are just starting out with customer journey mapping. But it’s one of the most important features a professional needs.
It’s the ability to quickly see in the map what we’re working on. And who is doing what. As we said before the journey map is a change plan not a static image.
There are a few ways you can track status in your map using Google sheets.
A simple way is to change the background color of a card to indicate a status. Green cards could be new things that you’re implementing and red cards could be things that need to be removed from the journey.

Use a background color to indicate a status
The other way you can indicate a status is by using cell borders. A thick green or red border is a strong visual cue.

Use borders to indicate a status
What I strongly recommend you do when adding a status to a card is to also add a comment explaining what that status means. You do that by going using the Insert > Comment option.

Add context to cards by using comments
This brings us to the next important feature a professional wants in their journey mapping too.
Tracking progress
When you work on your journey map with a team (which you always should) a critical feature that you from your tool is to see what how your map has changed.
You want to see the progress you’ve made over the last 4 weeks and ideally who has contributed what. Google sheets has this feature very well implemented.
To see how your map has evolved just go to File > Version History > See version history.

Keep track of how your journey map has evolved using the version history feature
Using this option you can also create named versions of your map. Which can be really useful to indicate major milestones. For instance when you have added a lane for a new department to the map.
The cool thing about Google sheets is that you can see the changes on a per cell basis. Crazy!

Track changes to a specific card using cell history
Journey mapping is a collaborative process. This means that your tool should allow you to share the map. It won’t come as a surprise that Google sheets excels at this (phun intended).
Collaboration
Being a Google product of course collaboration features are very well implemented in Google sheets.
Sharing the map
The most basic thing you’d want to do is to invite someone to work on the map together with you. You do that by via the Sharing option and make them an editor.

Share the journey map inside and outside your team
You can also give read only access to someone. This is useful when you want to spread the map in the organisation to gather feedback but don’t want people to mess around with it.
Linking to cells
Another very useful collaboration feature is that you can get a unique link to any cell in the journey map.
Imagine that you want to get input from the HR department. Rather than just sending them the map and hoping they will find the right place to look, you can send them a link which opens the map directly on the HR lane for instance.

Get a unique link to any card in the journey map
It’s small features like this that make your day to day work so much easier.
Adding safe gaurds
You know those inflatable tubes they add to your bowling lane to as a safe gaurd that all your balls end up in the gutter? Well Google sheets has something similar. And it’s feature that you’ll appreciate.
You can protect certain parts of your map from being edited by other people. You do that by selecting a group of cells and opening up Data > Protect Sheets and Ranges.

Prevent people from editing specific parts of the journey map by protecting ranges
Why is this useful? Imagine again that you want to get input from the HR department on the journey. You send them the correct link to the map as described above. And next to that you tell them that the map is setup in a way that they can only change the HR related things.
Sometimes people are reluctant to contibute to a journey map as they don’t want to mess things up. Telling them that you’ve put safe gaurds in place will give them more confidence to contribute.
Tagging people
The final collaboration feature which you need to know about is the ability to tag people.
When you use the @ sign in the comment feature it will provide you with a list of people you can then tag in the comment. What’s great about this is that the person you’ve tagged will get a notification through email that they have been tagged.

Tag people in the comments and send them a notification
This is extremely useful as it allows you to keep the discussion tied to the relevant parts of the journey. Rather than going back and forward via email or slack without any context.
Again this is one of those small things that just makes your life as a professional so much easier.
Exporting and printing
Imagine that you need to show the journey map to your boss tomorrow. So you want to export the map as a PDF document and send that over. Or in a world where we have physical meetings again you could print that PDF and present a tangible version of your journey map.
Google sheets makes this really easy. Go to File > Download > PDF adjust the settings to your liking and you’re done.

Export the journey map ready to print
Maybe you don’t want to show all the deails of your map to your boss and just want to provide a high level overview. You’ve learned that using subgroups you can hide certain parts of the map.
What’s nice is that the hidden parts are excluded from the exported version as well. So what you see is what you get.
Finally you can also select a specific part of the map and export that. So you could export the HR lane only or just the before stage of the journey. It’s really up to you what you want to show.

You can also export specific parts of the journey map
We’ve covered a lot of ground so far. Now it’s time to answer the big question.
Is Google sheets or Excel a viable customer journey mapping tool?
Conclusion
Drawbacks of using Google sheets or Excel
If you’ve been following along you will have seen that Google sheets has a lot of potential as a journey mapping tool. But it also has some drawbacks which you should take into consideration.
No guiding structure
A spreadsheet are basically a blank canvas. You can do anything with them. This also means that it’s up to you to come up with the structure of your journey map. If you’ve never create a journey map before this process can be a bit daunting. You can always start with a journey map template and modify that so it fits your needs.
Risk of losing empathy
Journey maps should tell a story (link naar what is a CJM). A disadvantage of using Google sheets is that it’s not designed to tell stories by default. So it’s very tempting to create a very left brain and rational journey map. Before you know it your journey map has become a process map that communicates zero empathy.
You’ve seen how to add a visual layer to your journey map. It’s definitely doable. You just have to be a bit more mindful about it compared to some of the other journey mapping tools.
Harder maintain a consistent visual style
This is especially true as soon as you start messing around with things like background colors and borders. You’ll find yourself fiddling around with the visual aspects of your journey map quite often. And let’s be honest this is not where you want to invest your time in.
No integration with other templates
Some journey mapping tools allow you to create personas, stakeholder maps and other artefacts related to the service design process. Google sheets will never have that feature as it’s a generic tool. Of course there’s nothing stopping you from creating something like an empathy map in a spreadsheet. But be careful that Google sheets doesn’t become your hammer and everything else a nail.
Potential licensing issues
When you introduce a new tool in an organisation licensing is always an issue. Your company might have a strict policy that doesn’t allow the use of Google or Microsoft products. When you’re still flying under the radar you might get away with it but when you need to start collaborating on the journey map across the organisation it becomes a problem.
Doesn’t have a professional feel
Think about it. Every professional has its own set of specialized and dedicated tools. This goes for your car mechanic but also for your colleagues working at the finance department. So why shouldn’t you as a CX professional have your own tools as well? Using Google sheets to create journey maps might be seen in the organisation as the finance department using a calculator to do create the yearly forecasts.
Why would I want to use Google sheets or Excel
After reading the drawbacks you might wonder why would anyone want to use Google sheets or Excel to create their journey maps, the answer is simple.
Almost everyone already has access to these tools.
The learning curve is relatively low as people are already familiar with the tool.
And Google sheets just doesn’t feel as scary to managers.
Sometimes the best tool (to start with) is the one that you have at your disposal.
When should I use Google sheets or Excel
The way I see it there are basically 3 scenarios and only in one of them would I recommend Google sheets as your go to journey mapping tool. This is based on the assumption that you don’t already have any other journey mapping tool in place.
Scenario 1: The workshop — use a quick and dirty tool
When you need a customer journey map for a workshop or just want to capture the results. And you don’t plan to do anything with the map after the workshop then just use a quick and dirty tool. I would pick up a set of sharpies and brown paper or when it needs to be digital a tool like Miro.
Scenario 2: The project — use Google sheets
If you’re in a project that runs for a few weeks and requires a journey map, Google sheets might be the tool you want to reach for. You don’t have to spend a lot of time teaching your team mates how to use the tool.
You (hopefully) don’t have to go through a complicated licensing process. Google sheets allows you to get up and running fast and focus most of the scares time you have in a project on the content.
Scenario 3: The strategy — use a professional tool
As soon as you start seeing customer journey maps as something that will help you to drive customer centric innovation within your organisation it’s time to reach for a professional tool.
A professional tool will help you to start treating journey maps as a capital that builds up over time. The small details and nuances in professional tools allow you to work more efficiently and when you use journey maps on a day to day basis that quickly starts to add up.
Just as you don’t want your don’t want your journey maps to run on a spreadsheet just like you wouldn’t want that for your enterprise billing system.
Get access to the Google sheets journey map template
You can get access to the journey map we’ve created in this article.
Just make a copy of it and start playing around.
Make a copy of the customer journey map
Next step
The focus of this article was to show you how to use the tools.
The next obvious step is really to create your own journey map.
You might run into questions like: which journey should I map first, where should my journey end and how detailed should my journey map be?
If that’s the case, have a look at The Perfect Map.
It will guide you step-by-step through the entire process of creating a useful journey map.
Бывает, что специалистам вашей компании трудно проникнуть в умы клиентов. Вы можете задаваться вопросом, почему покупатель тратит так много времени на то, чтобы просмотреть вашу выборку товаров и добавить их в корзину, а потом просто закрывает вкладку. Почему вашим клиентам требуется несколько шагов, чтобы добраться из пункта А в пункт Б, когда они должны пройти всего один.

В чём бы ни заключалась неразбериха, основная причина ー в том, что вы, скорее всего, не имеете чёткого представления о маршруте клиента при знакомстве с компанией. Маршрут клиента (customer journey) ー это процесс взаимодействия клиента с компанией, ведущий к достижению цели.
Потребитель взаимодействует с компаниями способом, который сложно отследить. От получения информации о бренде через социальные сети до получения электронного письма с благодарностью за покупку после успешной транзакции. Между этими событиями он обычно проходит много разных этапов.
Вы не можете предположить или предсказать их, полагаясь на вашу точку зрения. Путь клиента очень зависит от окружающей обстановки. Таким образом, лучший способ понять маршруты клиентов ー это опросить их.
В этой статье мы расскажем всё, что вам нужно знать о маршрутах клиентов. Что это такое и как отобразить этот путь на схеме. Но если вы торопитесь, можете использовать ссылки ниже, чтобы перейти к информации, которую вы ищете.
Содержание статьи
Маршрут клиента
Разработка схемы
Почему схема маршрута клиента важна?
Как создать схему маршрута клиента
Примеры схем маршрута клиентов
Бесплатные шаблоны схем маршрутов клиентов
Маршрут клиента
Схема маршрута клиента (customer journey map) ー это визуальное представление этапов, через которые клиент или потенциальный клиент проходит с вашей компанией для достижения цели. С помощью этой схемы вы можете понять мотивацию клиентов ー их потребности и болевые точки.
Однако простого понимания пути клиента обычно недостаточно. Лучше всего представить его в виде диаграммы, на которую вы и другие сотрудники можете ссылаться как на источник данных. Вот где схема маршрута клиента вступает в игру.
Разработка схемы
Лучший способ визуально показать, как клиент взаимодействует с бизнесом, ー это составить схему. Большинство схем пути клиентов начинаются с таблиц Excel. В них заносятся ключевые события, мотивы клиентов и препятствия, которые встречаются на пути. Затем эта информация объединяется в детальную картину, которая описывает типичный опыт взаимодействия клиента с вашей компанией.
Разобравшись в этих отношениях, вы сможете понять, как структурировать точки касания и разработать наиболее эффективный процесс для ваших клиентов. Схема маршрута клиента отображает текущий процесс, от первого до последнего касания. Вы сможете увидеть, достигают ли ваши клиенты в настоящее время целей и, если нет, то как они могут это сделать.
Покупатели часто совершают циклическое, многоканальное путешествие вперёд и назад. Поскольку путь клиента больше невозможно представить как линию от А до Б, этапы может быть сложно нанести на схему.
По этой причине опытные бизнес-лидеры используют различные способы представления пути: от листиков пост-ит на стене зала заседаний до таблиц Excel и инфографики. Главное ー чтобы схема имела смысл для тех, кто будет ею пользоваться.
Однако, прежде чем вы сможете погрузиться в создание маршрута клиента, вам необходимо сначала собрать данные о ваших клиентах и потенциальных клиентах. Процесс создания эффективной схемы маршрутов клиентов является трудоёмким, но ценным.
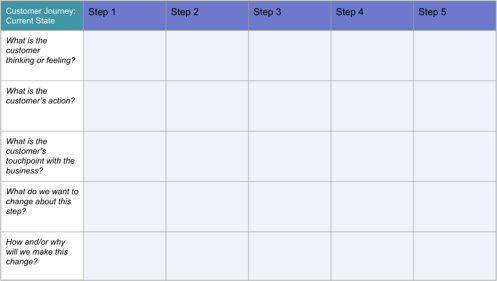
|
Маршрут клиента: текущее состояние |
Шаг 1 |
Шаг 2 |
Шаг 3 |
Шаг 4 |
Шаг 5 |
|
О чём клиент думает или что чувствует? |
|||||
|
Какие действия он предпринимает? |
|||||
|
Каковы точки касания с компанией? |
|||||
|
Что нам нужно поменять на этом шаге? |
|||||
|
Как и/или почему мы внесём это изменение? |
Почему схема маршрута клиента важна?
Возможно, вы говорите себе: «Кажется, это не особо нужно мне или компании. Мы понимаем потребности и болевые точки клиентов, большое спасибо». Возможно, так и есть на поверхностном уровне.
Тем не менее выделение этапов, которые проходит клиент, соотнесение каждого шага с целью и соответствующее изменение точек касания являются важными шагами на пути к максимальному удовлетворению клиента. В конце концов, всё, что вы делаете, должно быть нацелено на решение проблем клиентов и помощь в достижении долгосрочного успеха при помощи вашего продукта или услуги.
1. Вы можете переориентировать компанию на вовлекающий маркетинг.
Вместо того, чтобы находить клиентов с помощью прямой рекламы, используйте вовлекающий маркетинг. Пусть они сами находят вас. Традиционный маркетинг подразумевает тактику, которая неэффективно нацелена на общую или незаинтересованную аудиторию. Это реклама, которая пытается отвлечь клиентов от повседневной жизни.
Такой маркетинг дорогой и неэффективный. Он раздражает и отпугивает клиентов и лидов. Вовлекающий маркетинг ー это создание интересной и полезной информации, которую ваши клиенты уже ищут. Сначала контент привлекает их внимание, а уже потом происходит продажа.
Составив схему пути клиента, вы сможете понять, чем ваша компания и сайт интересны и полезны, а что посетителей отпугивает. Соответственно, вы сможете создавать контент, который будет привлекать людей в вашу компанию и поддерживать отношения.
2. Вы можете создать новую базу целевых клиентов.
Если вы не до конца понимаете маршрут клиентов, вероятно, вы также не полностью понимаете их демографию и психографию. Это опасно. Повторная ориентация на слишком широкую аудиторию, а не тех, кто будет интересоваться вашими продуктами, услугами и контентом, приводит к пустой трате времени и денег.
Изучение потребностей и болевых точек типичных клиентов и планирование их маршрутов даст вам хорошее представление о людях, которые пытаются достичь цели с помощью вашей компании. Таким образом, вы сможете оттачивать маркетинг для этой конкретной аудитории.
3. Вы можете создать клиентоориентированный подход в компании.
По мере того как компания растёт, становится сложнее координировать работу всех отделов так, чтобы они были ориентированы на клиента в той же мере, что и служба поддержки. Цели маркетинга и планы продаж в отделах часто могут быть не связаны с тем, чего хотят сами клиенты.
Понятной схемой пути клиента можно поделиться со всей организацией. Самое замечательное в этих схемах заключается в том, что они показывают каждый шаг клиента ー от заинтересованности в товаре или услуге и до сервисной поддержки после покупки. И да, это касается маркетинга, продаж и обслуживания.
Исходя из этого, вы не можете отрицать важность схемы маршрута клиента. Таким образом, мы выделили шаги создания лучшей схемы, чтобы помочь вашей компании и клиентам процветать.
Как создать схему маршрута клиента
- Установите чёткие цели схемы.
- Создайте портреты типичных клиентов и определите цели каждого типа.
- Выделите целевых клиентов.
- Перечислите все точки касания.
- Определите элементы, которые хотите отобразить на схеме.
- Определите, какие ресурсы у вас есть и какие понадобятся.
- Пройдите путь клиента самостоятельно.
- Внесите необходимые изменения.
1. Установите чёткие цели схемы
Прежде чем вы перейдёте к созданию схемы, вы должны спросить себя, почему вы делаете её в первую очередь. С какими целями вы создаёте эту схему? О ком она? На каком опыте основана?
Исходя из этого, вам нужно разработать образ типичного покупателя. Это воображаемый человек с демографическими характеристиками и психологическими особенностями, который является вашим среднестатистическим клиентом. Чёткий аватар клиента помогает напомнить о том, чтобы нацеливать каждый аспект вашей схемы на его потребности.
2. Создайте портреты типичных клиентов и определите цели каждого типа
Теперь вам нужно провести исследование. С помощью анкет и тестов вы сможете получить ценную обратную связь от клиентов. Важно обращаться к реальным клиентам или потенциальным. Вам нужны отзывы людей, которые заинтересованы в приобретении ваших продуктов и услуг и которые ранее взаимодействовали с вашей компанией или планируют это сделать.
Вот несколько примеров хороших вопросов:
- Как вы узнали о компании?
- Что первым делом привлекло вас на нашем сайте?
- Каких целей вы хотите достичь с помощью нашей компании? Другими словами, какие проблемы вы пытаетесь решить?
- Сколько времени вы обычно проводите на нашем сайте?
- Вы уже покупали что-то у нас? Если да, то что стало решающим фактором?
- Вы когда-нибудь заходили на наш сайт с целью покупки, но ничего не купили? Если так, то почему?
- По шкале от 1 до 10, насколько вам легко ориентироваться на нашем сайте?
- Вам когда-нибудь требовалась помощь службы поддержки клиентов? Если да, то насколько общение было полезно по шкале от 1 до 10?
- Что ещё мы можем сделать для вас, чтобы облегчить взаимодействие с нашей компанией?
3. Выделите целевых клиентов
После того как вы узнали о различных типах клиентов, которые взаимодействуют с вашим бизнесом, вам нужно сузить фокус на одном или двух из них. Помните, что путь клиента отражает опыт одного аватара, который с вашей компанией проходит по определённому маршруту. Если вы объедините слишком много представителей в одну схему, она не будет точно отражать опыт клиентов.
Если вы создаёте схему впервые, лучше всего выбрать наиболее часто встречающийся аватар клиента и рассмотреть маршрут, который он обычно выбирает, когда впервые сталкивается с компанией. Не беспокойтесь о представителях, которых вы не учли, так как вы всегда можете вернуться и создать новую схему для этих типов клиентов.
4. Перечислите все точки касания
Точки касания ー это места на сайте, где клиенты могут взаимодействовать с вами. Рассмотрев аналитику, вы должны составить список всех точек касания клиентов и потенциальных клиентов, а также список точек, которые, по вашему мнению, они должны использовать, если нет совпадений.
Это важный шаг в создании схемы маршрута клиента, поскольку он даёт вам представление о том, какие действия предпринимают ваши клиенты. Если они используют меньше точек соприкосновения, чем ожидалось, означает ли это, что они отказываются от дальнейшего общения и рано покидают ваш сайт? Если касаний больше, чем ожидалось, значит ли это, что ваш сайт сложно устроен и нужно предпринять несколько шагов, чтобы достичь конечной цели?
В любом случае знание точек касания поможет вам понять цели клиентов и осознать, как сделать сайт удобнее.
Это касается не только вашего сайта. Вам нужно посмотреть на все места, где клиент может встретить вас в интернете. Например:
- Социальные сети
- Платная реклама
- Рассылка
- Обзоры на сторонних сайтах отзывов и упоминания компании
Вбейте в Google название вашего бренда и посмотрите на все страницы, где есть упоминание о вас. Зарегистрируйтесь в Google Analytics и проверьте, откуда приходит трафик.
Сократите список до самых распространённых точек касания, с которыми можно сопоставить действие.
Действия
Составьте список действий, которые клиенты выполняют во время взаимодействия с вашим брендом. Это может быть поиск в Google по ключевым словам или клик по ссылке из письма. Список может оказаться длинным. Это хорошо. Позже у вас появится возможность реорганизовать информацию.
Важно распознать момент, когда ожидается, что клиенты предпримут слишком много действий для достижения целей. Сокращение количества шагов, которые необходимо предпринять клиенту, может быть рискованным, но окупается более высокими показателями конверсии.
Эмоции и мотивация
Весь маркетинг является результатом причины и следствия. Точно так же каждое действие, совершаемое вашим клиентом, продиктовано эмоциями. И эмоции вашего клиента будут меняться в зависимости от того, в какой части пути клиент находится.
Эмоциональная движущая сила каждого действия клиента обычно вызвана болью или проблемой. Знание этого поможет вам предоставить правильный контент в нужное время, чтобы вы смогли смягчить эмоциональное путешествие клиента с вашей компанией.
Препятствия и болевые точки
Узнайте, какие препятствия мешают вашему клиенту действовать. Одним из распространённых препятствий является стоимость. Например, человек мог бы наслаждаться вашим продуктом, но отказался от оформления заказа, когда обнаружил неожиданно высокие тарифы на доставку.
Когда вы выявляете потенциальные препятствия на пути клиента, то можете смягчить их. Например, создайте страницу с часто задаваемыми вопросами, которая отвечает на распространённые вопросы о стоимости доставки.
5. Определите элементы, которые хотите отобразить на схеме
Существует четыре типа схем маршрута клиента, каждая из которых имеет свои преимущества. В зависимости от конкретной цели, которую вы установили для схемы, вы можете выбрать подходящую.
Схема текущего состояния
Такие схемы пути клиента ー самый распространённый тип. Они отображают действия, мысли и эмоции, которые испытывают клиенты при обращении к вашей компании. Схемы этого типа лучше всего использовать для постоянного совершенствования маршрута клиента.
Схема дня в жизни
Такие схемы отображают действия ваших клиентов, их мысли и эмоции, которые они испытывают во всех видах ежедневной деятельности, независимо от того, затрагивает ли это вашу компанию. Этот тип даёт более широкий взгляд на жизнь клиентов и их болевые точки в реальной жизни. Такие схемы лучше всего использовать для удовлетворения существующих потребностей клиентов, прежде чем люди узнают, что они существуют.
Схема будущего состояния
Такие схемы отображают предполагаемые вами действия, мысли и эмоции, которые клиенты испытают в будущем при взаимодействии с вашей компанией. Учитывая текущий опыт, вы намечаете, где хотите оказаться, действуя по схеме. Такие карты лучше всего использовать для иллюстрации вашего видения и постановки чёткой цели.
Схема процесса обслуживания
Такие схемы начинаются с упрощённой версии одной из вышеупомянутых карт. Затем на неё накладывают слой факторов, влияющих на опыт взаимодействия клиента с компанией, включая людей, регламенты, технологии и процессы. Их лучше всего использовать для определения основных причин текущих маршрутов клиентов или определения шагов, необходимых для достижения желаемых будущих маршрутов клиентов.
6. Определите, какие ресурсы у вас есть и какие понадобятся
Схема маршрута клиента коснётся почти всех областей вашего бизнеса. Она выявит ресурсы, которые повлияют на взаимодействие клиента с компанией. Поэтому существующие ресурсы важно пересмотреть, а также найти то, что вам понадобится для создания оптимального маршрута клиента.
Возможно, ваша схема выявит недостатки в процессе обслуживания клиентов или вы заметите, что у вашей команды нет инструментов, необходимых для работы с клиентами после их обращения в службу поддержки. Используя схему, вы можете посоветовать руководству инвестировать деньги в инструменты обслуживания клиентов, которые помогут вашей команде управлять спросом.
Включив эти новые инструменты в схему, вы сможете точно предсказать, как они повлияют на ваш бизнес и увеличат его ценность. Это позволит намного легче убедить посредников и лиц, принимающих решения, инвестировать деньги в ваши предложения.
7. Пройдите маршрут клиента самостоятельно
То, что вы создали схему, не означает, что работа закончена. Начинается самая важная часть процесса ー анализ результатов. Сколько людей переходят на ваш сайт, но затем уходят ничего не купив? Как помочь клиентам? Вот некоторые из вопросов, на которые вы сможете ответить, когда карта будет готова.
Анализ результатов покажет, какие потребности клиентов не удовлетворены. Исправив это, вы предоставите лучший сервис и дадите понять, что люди могут найти решение проблем с помощью вашей компании.
Весь процесс составления маршрута клиента остаётся гипотетическим, пока вы не попробуете сделать это.
Вместе с каждым аватаром клиента проследуйте по пути, который он проходит в социальных сетях, прочитайте вместе электронные письма, поищите информацию в интернете.
8. Внесите необходимые изменения
Анализ данных даст представление о том, каким должен быть ваш сайт, и вы сможете внести соответствующие изменения для достижения этих целей. Возможно, текст на ссылках призыва к действию станет более чётким. Или, может быть, вы составите более длинные описания для каждого продукта, чтобы сделать его назначение более понятным.
Независимо от того, насколько велики или малы изменения, они будут эффективными, поскольку напрямую связаны с тем, что клиенты указали в качестве болевых точек. Вы не слепо вносите изменения в надежде, что они улучшат качество обслуживания клиентов. Вы можете быть уверены в том, что улучшения произойдут. И с помощью наглядной схемы маршрута клиентов вы можете гарантировать, что их потребности и болевые точки не останутся без внимания.
Вашу схему постоянно нужно совершенствовать. Ежемесячный или ежеквартальный пересмотр поможет выявить пробелы и найти способы дальнейшей оптимизации маршрута клиента. Используйте аналитику данных и отзывы клиентов, чтобы выявить препятствия на пути к покупке.
Я считаю, полезно, когда все заинтересованные стороны вовлечены в процесс. Поэтому обычно создаю схемы в Google Таблицах и открываю доступ всем людям, с которыми тесно сотрудничаю. Также полезно проводить регулярные собрания (ежеквартально или ежегодно), чтобы проанализировать, как новые продукты или предложения могли изменить путь клиентов.
Примеры схем маршрута клиентов
1. Шаблон схемы пути клиента в компании HubSpot
|
Путь клиента: |
Раннее утро |
Позднее утро |
Полдень |
Вечер |
Ночь |
|
О чём клиент думает или что чувствует? |
|||||
|
Что он делает или каковы его приоритеты? |
|||||
|
Каковы его самые существенные болевые точки в это время суток? |
|||||
|
Как он взаимодействует с нашим продуктом в это время? |
|||||
|
Как наш продукт можно использовать лучше в это время дня? |
2. Пример схемы для клиентов B2B
Путь клиента
|
Исследование |
Сравнение |
Практика |
Расценки |
Подписание |
|
|
Типичные вопросы |
Как я разработаю приложение? Какую платформу я должен использовать? Сколько она будет стоить? Как я защищу свою идею? |
Что для меня важно в разработчике приложений? Ценаー качество? С кем они работали раньше? Каковы возможности компании? |
Как я пойму, что приложение будет пользоваться успехом? Кто будет владельцем продукта/ принимать решения? |
Как они соотносятся? Какие ещё бизнес-возможности у меня есть? Я действительно хочу предпринять этот рывок? Как я буду финансировать это? |
Что ещё мне нужно сделать, чтобы основать компанию? Когда продукт будет готов? |
|
Эмоции/ чувства |
Любопытство, желание защитить, энтузиазм, жажда начать. |
Субъективное восприятие, неуверенность, взвешивание за и против, обычно фокус на времени, деньгах и качестве. |
Жажда начать, вдохновение, новое понимание загрузки работой. |
Пересмотр приоритетов, подтверждение решений, принятых с партнёрами или с семьёй. Внутреннее подтверждение того, что это правильный шаг. |
Оптимизм, нервозность, волнение, жажда увидеть результат как можно быстрее. |
|
Нам нужно… |
Присутствовать на рынке. Чтобы нас нашли. Верить в себя как компанию и дать причину связаться с нами. |
Объяснить процесс разработки приложения, показать лучшие методики и предыдущие истории успеха. Быть открытыми, честными. |
Сделать так, чтобы все поняли, какие ресурсы будут использоваться. Что успех не приходит за одну ночь. Доказать, что мы будем на связи, чтобы помогать клиентам во всех процессах. |
Показать, что мы лучшая команда для этой работы и обосновать цену подходящими данными. Побуждать людей задавать вопросы. |
Прояснить ожидания. Держать людей в курсе последних новостей. Часто связываться. На той же странице попросить об обратной связи, справляемся ли мы с задачей, доволен ли клиент. |
Источник: Dapper Apps
Эта схема пути клиента чётко описывает пять шагов, которые, по мнению Dapper Apps, клиент проходит с этой компанией. Как видите, схема выходит за рамки фактической стадии покупки. В ней отражены предварительные исследования и учтены потребности клиента после покупки.
Эта схема эффективна, потому что помогает сотрудникам проникнуть в мысли клиентов, узнать типичные вопросы и почувствовать эмоции, которые испытывают клиенты. Dapper Apps может предпринять дополнительные действия, осознавая эти вопросы и чувства, что поможет решить все текущие проблемы, с которыми сталкиваются клиенты.
3. Пример схемы пути клиента для интернет-магазина

Источник: Картен Дизайн
На рис.
По вертикали:
настроение/ эмоциональное состояние уровень свободы действий
Наверху: Стресс, связанный с недвижимостью. Жена пишет об имейле риэлтора. Проверка почты по запросу. Поиск информации в интернете, расстроен из-за информации риэлтора.
Роль прислуги. Пока отец обедает, сын пишет, что забыл футбольную форму дома. Отцу приходится везти её в школу, прикидывая, как выполнить свою работу за меньшее время. Разыскивает сына и отдаёт ему форму.
На протяжении дня:
Утренние процедуры ー завтрак ー звонок по телефону ー время начала занятий в школе ー переписка в телефоне ー имейл ー поиск в интернете ー звонок по телефону ー велопрогулка в библиотеку ー поиск в интернете, поиск в библиотеке ー обед дома ー фейсбук ー переписка в телефоне.
Эта вымышленная схема пути клиента ー яркий пример дня из жизни. Вместо того, чтобы просто сосредоточиться на действиях и эмоциях, связанных со взаимодействием клиента с компанией, мы показали на схеме все действия и эмоции, которые клиент испытывает в течение типичного дня.
Эта схема полезна, потому что она показывает настроение клиента или его эмоциональное состояние на основе уровня свободы действий, которую он получает после определённых событий. Это полезные данные для компании, которая хочет понять, чем озабочены её целевые клиенты и какие проблемы им приходится решать, о которых компания даже не подозревает.
4. Пример схемы пути будущего клиента в сфере B2C

Источник: Ирис Тонг Ву
Эта схема пути клиента, разработанная для Университета Карнеги-Меллона, иллюстрирует полезность схемы будущего состояния клиента. Здесь изложены мысли, чувства и действия, которые университет хочет наблюдать у своих студентов, а также точки касания, устройства, люди и окружение, с которыми вуз хочет, чтобы студенты взаимодействовали.
Исходя из этих целей, университет выбрал конкретные предлагаемые изменения для каждого этапа и даже написал примеры сценариев на каждом шаге. Это понятная диаграмма, которая показывает видение компании и помогает любому отделению понять, на каком этапе они будут встраиваться в схему, для того чтобы лучше помочь студенту.
5. Пример схемы пути индивидуального клиента

Источник: UXPressia
Скачайте пример схемы на русском языке и используйте в своих проектах.
Эта вымышленная схема пути клиента показывает взаимодействие с вымышленным рестораном. Понятно, что этот тип карты является более подробным, чем другие, так как он включает в себя взаимодействие между клиентом и компанией в зале (прямой контакт), а также на кухне (непрямое или невидимое взаимодействие) и вспомогательные процессы.
Эта схема более сложная, но в ней отражены все действия, влияющие на впечатление клиента от компании. Это действия клиента, сотрудников, непосредственно обслуживающих гостя, и сотрудников, работающих на кухне. Анализируя, как каждый из этих факторов влияет на путь клиента, компания может найти основную причину неудач и решить эту проблему в будущем.
Бесплатные шаблоны схем маршрутов клиентов
1. Шаблон текущего состояния
Если вы используете этот шаблон для продукта B2B, этапы могут отражать поиск, узнавание бренда, рассмотрение вариантов, принятие решения о покупке и процессы поддержки после покупки. В примере Dapper Apps этапами были исследование, сравнение, практика, расценки и подписание договора.
|
Фаза 1 |
Фаза 2 |
Фаза 3 |
|
|
|||
|
|||
|
|||
|
2. Шаблон дня из жизни
Поскольку этот шаблон отражает все мысли, чувства, действия, потребности и болевые точки, с которыми клиент сталкивается в повседневной жизни ー независимо от того, включает ли она вашу компанию, ー вам нужно использовать хронологическую структуру. Таким образом, вы найдёте время суток, когда уместнее всего предложить помощь.
|
Утро |
Полдень |
После полудня |
Вечер |
Ночь |
|
|
1. Мысли и чувства клиента |
|||||
|
2. Действия клиента |
|||||
|
3. Неудовлетворённые потребности клиента |
|||||
|
4. Болевые точки клиента |
|||||
|
5. Способы проактивного решения проблемы |
3. Шаблон будущего состояния
Подобно шаблону текущего состояния клиента, эти фазы могут также отражать прогнозируемый или желаемый поиск в будущем, узнавание компании, рассмотрение вариантов, принятие решения о покупке и процессы поддержки после покупки. Поскольку это происходит в будущем, вы можете варьировать этапы в зависимости от того, как вы хотели бы, чтобы путь клиента выглядел в будущем, а не как он выглядит сейчас.
|
Фаза 1 |
Фаза 2 |
Фаза 3 |
Фаза 4 |
|
|
1. Мысли и чувства будущего клиента |
||||
|
2. Действия будущего клиента |
||||
|
3. Точки касания с будущим клиентом |
||||
|
4. Предлагаемые изменения |
4. Шаблон процесса обслуживания
Поскольку этот шаблон более детальный, он не соответствует определённым этапам в пути клиента. Скорее он основан на материальных факторах, которые могут создавать впечатление о качестве и стоимости услуг. Они часто объединяются в множество людей, мест или объектов. В приведённом выше примере с вымышленным рестораном материальные факторы включают в себя весь персонал, столы, украшения, столовые приборы, меню, еду и все остальное, с чем контактирует клиент.
Затем вы должны перечислить действия клиента и взаимодействия сотрудников, соответствующие каждому материальному объекту. Например, когда объектами являются тарелки, столовые приборы, салфетки и сковороды, клиент делает заказ, работник на переднем плане ー официант ー принимает заказ, работник на заднем плане ー регистратор ー обрабатывает заказ, а участники вспомогательного процесса ー повара ー готовят еду.
Шаблон интерактивного сервиса
|
Физический объект 1 |
Физический объект 2 |
Физический объект 3 |
Физический объект 4 |
|
|
1. Действия заказчика |
||||
|
2. Взаимодействия на переднем плане |
||||
|
3. Взаимодействия на заднем плане |
||||
|
4. Процесс поддержки |
5. Шаблон пути клиента
Чтобы составить свою схему пути клиента, вы также можете использовать классическую формулу пути покупателя ー осведомлённость, рассмотрение вариантов, решение.
|
Путь клиента |
Осведомлённость |
Рассмотрение |
Решение о покупке |
|
Шаги |
|||
|
Эмоции |
|||
|
Действия |
|||
|
Точки касания |
|||
|
Болевые точки |
|||
|
Возможности |
Автор Аарон Агиус @IAmAaronAgius
Оригинал публикации: https://blog.hubspot.com/service/customer-journey-map
Перевела Татьяна Пушкина специально для Сonvert Monster. Использовать материал разрешено только с активной ссылкой на перевод.
Topics
customer journey map, services marketing, buyer decision process, segments, personas
Teaching Notes
Overview: In this task, students use the free customer journey map (CJM) Excel template to develop CJM’s for different personas. This exercise is helpful for deepening students’ understanding of the customer journey, the buyer decision process, and target markets and personas. It is also an ideal tool for student assignments and reports.
Teaching Level: Intermediate/advanced – students need to be familiar with customer journeys, the buyer decision process, brand touchpoints, and brand personas.
The Excel template is very easy-to-use, so even if your students are Excel-beginners, they will be able to produce a detailed customer journey map quite quickly and easily. You may choose to show your students the how-to-use instructional video at the bottom of this page.
Please note that students will need access to Excel or other suitable spreadsheet software.
No Excel? If your students do not have access to Excel, you could show them the instructional video for this template – which will give them a good sense of the structure of customer journey maps – and then they could develop a CJM using post-it notes and/or flip charts.
Approximate Timing: The various tasks will probably run around 45-90 minutes, depending on task/s chosen and the number of groups reporting back to class. Probably allow 10-15 minutes for students to become familiar with the template before proceeding to the group activity.
Download the Journey Map Excel Template
- Download the free template here… customer-journey-map-maker
Download the PDF student information guide
- Student worksheet: Creating Customer Journey Maps
Suggested Student Exercises
There are multiple variations to use with the CJM template.
Initially, individual students should familiarize themselves with using the customer journey map template. Once they are confident in producing maps, they should work on a group task.
- As a simple starting exercise, groups can construct a considered and thought-out (and possibly researched) customer journey map for a specific brand persona. Therefore, just constructing a map to get started can be a worthwhile student exercise.
- It would be a good idea for different groups of students to construct a customer journey map using different brand personas, and then comparing how the customer journeys vary for each of these personas – and to discuss why this would be the case?
- Of course, one of the key outputs of the customer journey map is to identify things that we do well, and opportunities for the firm to review, and removing obstacles and barriers to the customer. This would mean that once the map/s has been constructed, students will consider “how to improve” on what we do.
- A further variation of a journey map in-class exercise would be to connect the various brand touchpoints and interactions to the marketing mix elements – would this brand touchpoint be part of promotion, process, place, people, and so on?
Student Information
What is Customer Journey Mapping?
Let’s start with outlining what is a customer journey. A customer journey is how the consumer, who starts off a non-customer of a brand, progresses and interacts with the brand, retailers, information, and even competitors, to finally become a customer.
In summary, a customer will progress from a state of non-awareness of the brand, to hopefully becoming a loyal customer, and perhaps even an advocate of the brand.
Customer journey mapping is a visual technique designed to show the customer journey; that is, the key steps taken and sources of information accessed by the consumer. A customer journey map should include all brand touchpoints (exposures and interactions) whether or not they are communicated by the brand.
Why use Customer Journey Maps?
Customer journey mapping is an effective visual method for understanding:
- the key steps in buying decision process
- differences in behavior across market segments = by using different brand personas
- the most important promotion, process, and people marketing mix elements = brand touchpoints
- how to increase customer satisfaction loyalty and retention
- how to increase new customer acquisition
- improving and streamlining the consumer’s purchase experience
Download the Journey Map Excel Template
This exercise you will using automated customer journey map maker, which is an Excel template. Your instructor will provide a copy of the template to you, or can find it at: marketingstudyguide.com/free-customer-journey-map-template/
What the Map Looks Like
When you download the customer journey mapping Excel template, you will start with a blank map, as shown here:
And this is an example of a customer journey map that has been populated using the template…
How the Template Works
The journey mapping maker is designed to be as simple as possible. It works with a series of drop-down menus and you will work through various worksheets across the various phases of the consumer decision process. Here is the worksheets menu at the bottom of the template that you should follow in sequence:
![]()
Here is an example of one of the input screens. As you can see, there are instructions and steps along the way…
How-to-use CJM Template = VIDEO
Related Activities
- Evaluation Phase of Decision Process
- How to Develop a Segment Profile
- The Value of Brand Persona Names
Further Information
- What is a Brand Touchpoint?
- Mapping The Customer Journey
- Customer Journey Mapping as a Method to Understanding the User Experience