
Word for Microsoft 365 Word 2021 Word 2019 Word 2016 Word 2013 Word 2010 Word Starter 2010 More…Less
You can make a chart in Word. If you have lots of data to chart, create your chart in Excel, and then copy from Excel to another Office program. This is also the best way if your data changes regularly and you want your chart to always reflect the latest numbers. In that case, when you copy the chart, keep it linked to the original Excel file.
To create a simple chart from scratch in Word, click Insert > Chart, and pick the chart you want.
-
Click Insert > Chart.

-
Click the chart type and then double-click the chart you want.
-
In the spreadsheet that appears, replace the default data with your own information.
-
When you’ve finished, close the spreadsheet.
-
If you want, use the Layout Options button
to arrange the chart and text in your document.


 to arrange the chart and text in your document.
You can make a chart in Word or Excel. If you have lots of data to chart, create your chart in Excel, and then copy from Excel to another Office program. This is also the best way if your data changes regularly and you want your chart to always reflect the latest numbers. In that case, when you copy the chart, keep it linked to the original Excel file.
To create a simple chart from scratch in Word, click Insert > Chart and pick the chart you want.
-
Click Insert > Chart.
-
Click the chart type and then double-click the chart you want.
-
In the spreadsheet that appears, replace the default data with your own information.
-
When you’ve finished, close the spreadsheet.
-
If you want, use the Layout Options button
to arrange the chart and text in your document.

Important:
Office 2010 is no longer supported. Upgrade to Microsoft 365 to work anywhere from any device and continue to receive support.
Upgrade now
In Microsoft Word 2010, you can insert many kinds of data charts and graphs, such as column charts, line graphs, pie charts, bar charts, area graphs, scatter graphs, stock charts, surface charts, doughnut charts, bubble graphs, and radar graphs.
Notes:
-
Don’t see the chart that you want in this article? For more information about the variety of graphs and charts you can use, see Available chart types.
-
Want to create an organization chart? For more information about how to create organization charts, see Create an organization chart.
-
If Microsoft Excel 2010 isn’t installed on your computer, you will not be able to take advantage of the advanced data charting capabilities in the Microsoft Office 2010. Instead, when you create a new data chart in Word 2010, Microsoft Graph opens.
How?
|
|
On the Insert tab, in the Illustrations group, click Chart.
|

|
|
In the Insert Chart dialog box, click the arrows to scroll through the chart types. Select the type of chart that you want and then click OK.
When you rest the mouse pointer over any chart type, a ScreenTip displays its name. |


|
|
Edit the data in Excel 2010. When you are finished editing your data, you can close Excel.
Sample data in an Excel worksheet |


Tips
-
To get a good idea of what you can add to or change in your chart, under Chart Tools, click the Design, Layout, and Format tabs, and then explore the groups and options that are provided on each tab.
Note: If you don’t see the Chart Tools, make sure that you click anywhere inside the chart to activate it.
-
You can also access design, layout, and formatting features that are available for specific chart elements (such as chart axes or the legend) by right-clicking those chart elements.
More information
-
To learn about the available chart types, see Available chart types.
-
To edit data in your chart, see Change the data in an existing chart.
Top of Page
See also
Present data in a chart
Need more help?

Charts offer a concise and visually appealing way to present numeric information. This tutorial explains the basics of creating and customizing charts in Microsoft Word. We’ll cover five topics:
- How to insert a chart
- How to update existing data in a chart
- How to resize a chart
- How to reposition a chart
- How to change chart colors
These steps apply to all seventeen of Word’s prebuilt chart types:
| Column | Area | Surface | Histogram | Combo |
| Line | X Y (Scatter) | Radar | Box & Whisker | |
| Pie | Map | Treemap | Waterfall | |
| Bar | Stock | Sunburst | Funnel |
Important Note: Word provides many ways to customize charts—many more than can reasonably be covered in one tutorial. So, this tutorial presents the basic methods I believe will be most useful for the majority of users.
Before we begin…
What about Figures and Graphs?
In the writing world, charts and graphs fall under the umbrella term figures, which also includes photos, drawings, maps, and musical scores.
Graphs are generally considered a type of chart. Therefore, the term chart is used throughout this tutorial. However, all the steps shown here also apply to visuals typically considered to be graphs, such as line graphs.
This tutorial is also available as a YouTube video showing all the steps in real time.
Watch more than 150 other writing-related software tutorials on my YouTube channel.
The images below are from Word for Microsoft 365. The steps are the same in Word 2021, Word 2019, Word 2016, and Word 2013. However, your interface may look slightly different in those older versions of the software.
How to Insert a Chart
- Place your cursor where you want to insert the chart.
- Select the Insert tab in the ribbon.

- Select the Chart button in the Illustrations group.

- Select a chart type from the left side of the Insert Chart dialog box.

Pro Tip: Hover your pointer over the example image in the center of the Insert Chart dialog box to see a larger example of the chosen chart type.
- Select a subtype of the selected chart.
The available subtypes will depend on the selected chart. Common charts such as pie charts and bar charts offer attractive 3-D options.

- Select the OK button to close the Insert Chart dialog box and insert the chart.

- Enter labels and numbers into the spreadsheet by typing over the example data. Add additional labels and numbers or delete the example data as necessary.

- Select the X to close the spreadsheet.

- (Optional Step) Select the Chart Elements button to the right of the chart if you want to add or remove the title, data labels, or the legend. (Click inside the border to select the chart if the right-side buttons are not visible.)

How to Update Existing Data in a Chart
- Right-click the chart.
- Select Edit Data from the shortcut menu.

Pro Tip: Select the arrow next to Edit Data and select Edit Data in Excel if you want to update your chart in Excel rather than Word’s spreadsheet.
- Edit your data in the spreadsheet (see figure 6).
- Select the X to close the spreadsheet and apply your changes (see figure 7).
How to Resize a Chart
Charts can be resized by dragging the border or by using exact dimensions (e.g., 3” x 4”).
Basic Method: Resize a Chart by Dragging the Border
- Click inside the border to reveal the resizing handles.

- Click and hold one of the handles as you drag the chart to the appropriate size.
-
- The corner handles provide movement in all directions.
- The side handles provide horizontal movement.
- The top and bottom handles provide vertical movement.
Advanced Method: Resize a Chart to Exact Dimensions
- Click inside the border to select the chart.
- Select the Layout Options button to the right of the chart.

- Select See more from the Layout Options menu.

- Select the Size tab in the Layout dialog box.

- (Optional Step) Select Lock aspect ratio if you want to maintain the current shape.

- Enter the dimensions in the Height and Width boxes. If you selected Lock aspect ratio, you only have to enter one of these numbers.

- Select the OK button to close the Layout dialog box and apply your new dimensions.

How to Reposition a Chart
You can customize your chart’s placement on the page by changing its alignment and text wrapping. Text wrapping determines how charts and other figures are positioned in relation to the surrounding text.
- Select the Home tab in the ribbon.

- Click inside the border to select the chart.
- Select the Align Left, Center, or Align Right button in the Paragraph group.

- (Optional Step) Select the Layout Options button to the right of the chart for text wrapping options.

Your position changes will be applied immediately.
How to Change Chart Colors
You can choose a prebuilt color palette for your whole chart or select custom colors for individual elements.
See the bonus section below for information about using RGB, HSL, and Hex color codes.
Basic Method: Choose a Prebuilt Color Palette
- Click inside the border to select the chart.
- Select the Chart Styles button to the right of the chart.

- Select the Color tab in the shortcut menu.

- Select a color palette.

Your new color palette will be applied immediately.
Advanced Method: Choose Custom Colors
- Select and then right-click the individual chart element you want to change.
- Select the Fill button in the shortcut menu.

- Select a color from the drop-down menu or choose More Fill Colors for additional options.

Your new color will be applied immediately.
Bonus Section: How to Use RGB, HSL, and Hex Color Codes in a Chart
Word lets you use RGB (Red, Green, Blue) and HSL (Hue, Saturation, Lightness) color codes in your charts. In addition, you can use Hex color codes if you are using an updated version of Word for Microsoft 365 (formerly Office 365).
- Select and then right-click the individual chart element you want to change.
- Select the Fill button in the shortcut menu (see figure 23).
- Select More Fill Colors from the drop-down menu.

- Select the Custom tab in the Colors dialog box.

- Select RGB or HSL from the Color model menu or enter a code in the Hex box.

- Enter your RGB or HSL code into the appropriate boxes. (Skip this step if you are using a Hex code.)

- Select the OK button to close the Colors dialog box and apply your color change.

Related Resources
Three Ways to Insert Tables in Microsoft Word
How to Save Tables and Figures as Images in Microsoft Word (PC & Mac)
How to Update Table and Figure Numbers in Microsoft Word
How to Change the Style of Table Titles and Figure Captions in Microsoft Word
How to Create and Update a List of Tables or Figures in Microsoft Word
How to Write Figure Captions for Graphs, Charts, Photos, Drawings, and Maps
How to Write Table Titles
How to Reference Tables and Figures in Text
Updated November 27, 2022

Sometimes documents you’re authoring can benefit from an illustrative chart. Rather than taking the time to set up a chart in another application and embedding it or copying and pasting it into Microsoft Word, you can use the built-in chart feature.
RELATED: How to Link or Embed an Excel Worksheet in a Word Document
Create a Chart in Word
You might be creating a company report, business proposal, or college essay where a data-filled visual is an ideal addition.
Place your cursor where you want the chart in your Word document. Then, go to the Insert tab and click “Chart” in the Illustrations section of the ribbon.

Pick the type of chart you want to add on the left and the style on the right. If you’re familiar with the chart options in Excel, you can choose from the same types in Word like bar, column, pie, line, and many others. Click “OK” to insert the chart.
Once you insert the chart, an Excel spreadsheet will open. The sheet contains sample data to get you started and is a stripped-down version of Excel without tabs or a ribbon.
You can edit the data in the spreadsheet to include your own or copy and paste the data from another spot into the attached sheet. You’ll then see the chart in Word immediately update with your changes.
RELATED: How to Choose a Chart to Fit Your Data in Microsoft Excel
Update the Chart Data
Anytime you want to update the data for the chart, you can do so by heading to the Chart Design tab.
Click the drop-down arrow for Edit Data. Select “Edit Data” to display the small spreadsheet you had when you created the chart, or select “Edit Data in Excel” to open the sheet in a standard Excel window with tabs and a ribbon.
Customize a Chart in Word
Once you insert the chart into Word with the data you want, you can make some customizations. You can add a title, adjust the colors, pick a theme, include a legend, and more. Again, if you’re familiar with customizing charts in Excel, you’ll recognize the below options.
RELATED: How to Create and Customize a Funnel Chart in Microsoft Excel
Use the Chart Design Tab
Select the chart and go to the Chart Design tab. Starting on the left side of the ribbon you can add, remove, and position chart elements, change the layout, pick new colors, and select a style.
On the right side of the Chart Design ribbon, you have an option for Change Chart Type. If you believe a different type of graph would work better with your data, you can select it here.
Open the Format Chart Sidebar
If you’d like to change the font, border, or specifics of the chart like a series or axis, you can use the Format Chart sidebar.
Right-click the chart and pick “Format Chart Area” or double-click the chart.
When the sidebar opens, click the arrow next to Chart Options to select a part of the chart to adjust.
Use the tabs at the top of the sidebar for fill and line colors, effects, and properties. These tabs change depending on the chart area you select in the drop-down list.
Use the Floating Buttons on Windows
If you’re using Word on Windows, you also have floating buttons for quick changes to your chart. Select the graph, and these will display on the right side.
You can then change the Layout Options for the chart’s placement within the text. You can also use the Chart Elements, Chart Styles, and Chart Filters buttons to adjust items on the chart, choose a color scheme, and apply filters.
By creating a chart directly in Microsoft Word, you can save yourself a bit of time. This is especially handy if you’re using a small amount of data that’s beneficial to your Word document.
If you’re interested in other ways to use charts in your documents, take a look at how to create a flowchart in Word.
READ NEXT
- › How to Remove Borders in Microsoft Word
- › Google Chrome Is Getting Faster
- › The New NVIDIA GeForce RTX 4070 Is Like an RTX 3080 for $599
- › Expand Your Tech Career Skills With Courses From Udemy
- › BLUETTI Slashed Hundreds off Its Best Power Stations for Easter Sale
- › How to Adjust and Change Discord Fonts
- › Mozilla Wants Your Feature Suggestions for Thunderbird
MS Word
How to Make Letterhead in Microsoft Word
![]()
Published
1 year ago
on
November 18, 2021

How to make a letterhead in Word correctly and neatly is actually easy, but surely there are still many of you who don’t know how to make it.
In an official letter, of course, there is a letterhead and there is always a line at the bottom right. Well, it turned out to be quite easy to make you know.
Apart from being the introduction to a letter, letterhead is also commonly used as a place to write the identity of the letter, such as the identity of the sender and recipient.
For those of you who want to know how to make it, here we explain in full the steps to make a letterhead in Word for you.
HOW TO MAKE LETTERHEAD IN WORD
You should know how to make a letterhead in Word this time, guys, especially when you want to send letters between agencies.
Although not all agencies use it, it doesn’t hurt you to try and find out how to make this letterhead, here are the steps!
- First, open your Word.
- Place the cursor at the back of the last word of the letterhead
- Then select the menu Borders – Borders and Shading.
- After the border menu appears, all you have to do is select the line you want on the menu with a sign like this.
Don’t rush to click Ok, because there’s one more thing you have to do to make it, guys. In the section below, remove it or set it like this to make the line only exist at the bottom, and then Ok.
Yeah, you have successfully drawn the line, Guys, it’s easy and fast, right, how to make a letterhead in Word?
You don’t need to be confused anymore about how to make it. For beginners, making letterhead or letterhead does sound quite difficult.
In fact, how to make a letterhead in Word is fairly easy as long as you already know the procedure. After all, the letterhead cannot be made casually because it is an official identity.
The letterhead contains the official identity of an institution, agency, or company. Well, you can create an official identity on the letterhead in Microsoft Word.
MS Word
How to Create a Background in Microsoft Word
![]()
Published
1 year ago
on
November 18, 2021

This way of making a background in Word aims to beautify the appearance of the document and make it more attractive Guys.
Usually, this is often found in the use of proposals, certificates, covers, and not infrequently in job applications.
With this function, how do you make it? It’s so easy. Yes, although there are several ways you can do this, you can follow this tutorial in full.
HOW TO MAKE A BACKGROUND IN WORD
This background function is very useful if you want to create a document that upholds the originality of Guys, for example, a thesis.
In addition to having to know how to create a table of contents in Microsoft Word, you may also need to know how to create a background in your thesis document, especially in showing the results of the tests you did.
How to make this background is also needed if you want to make an official letter from the agency. Besides needing to know how to make letterhead lines in Word, you also need to know how to add a background to the letter. Here’s how:
- The first thing you can do is change the color.
- Go to Design – Page Color – and immediately choose a color like this.
That is the easiest way and you can change the color according to your needs or tastes, guys. In addition to this method, you can also replace it with an image that you have.
The method is almost the same, guys, pay attention to the following rare:
- Go to the Design menu.
- Click Page Color.
- Select Fill Effects.
- Next, select the tab Picture – Select Picture – From a File.
- Then find the image you have and press Ok
- Finished! The background will change.
But, you also need to remember that both methods will not appear when you print either color or image.
To make it appear when printing, then you need to go to the File menu – Options – Display – and check the Print background colors and Image.
Well, after you go through these few steps, the background will change and also enter when you print, GRATZ!!! It’s easy to make a background in Word.
MS Word
How to Create a Signature in Word
![]()
Published
1 year ago
on
November 11, 2021

There are several ways to make a signature in Microsoft Word. And the method is really easy, just follow the steps below, guys!
Making a signature is really needed, especially in the digital era like now, right? Of course, you need a signature in your Word file, so from that our Team will provide this tutorial in detail.
Actually, you can also use a third application or additional devices such as pens that support your PC or laptop. But this is the easiest way without using other devices and applications Guys.
HOW TO CREATE A SIGNATURE IN WORD
You need to sign first, Guys on a piece of white paper. Make sure the paper is really white and the pen has colour ink that you can really see clearly.
This function is for later photos or files the resolution will be smaller Guys. Not only that, but the customized color saturation will also reduce the thickness of the pen color, you know.
So make sure you give a signature with a clear enough emphasis. Here’s how to create a signature in Word:
- Prepare a white paper with a signature on it. Photos using a smartphone or you can directly scan the signature through a scanner.

- You can reduce the resolution and crop it so that the photo focuses on the signature. For convenience, click the image file > Edit.
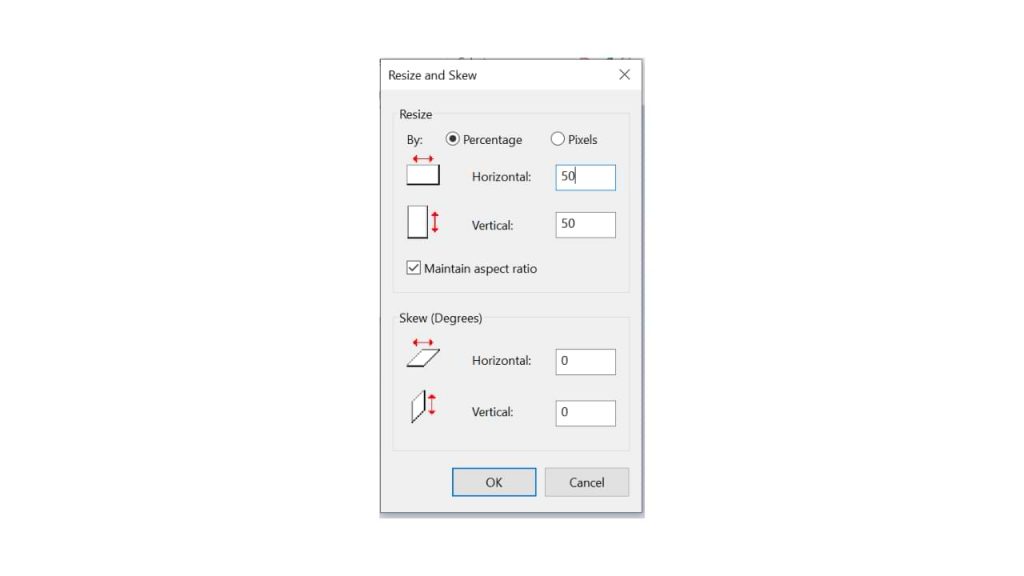
- On the Paint menu, you can resize to reduce the resolution. Choose 50 per cent resolution, fill Horizontal 50 and Vertical 50
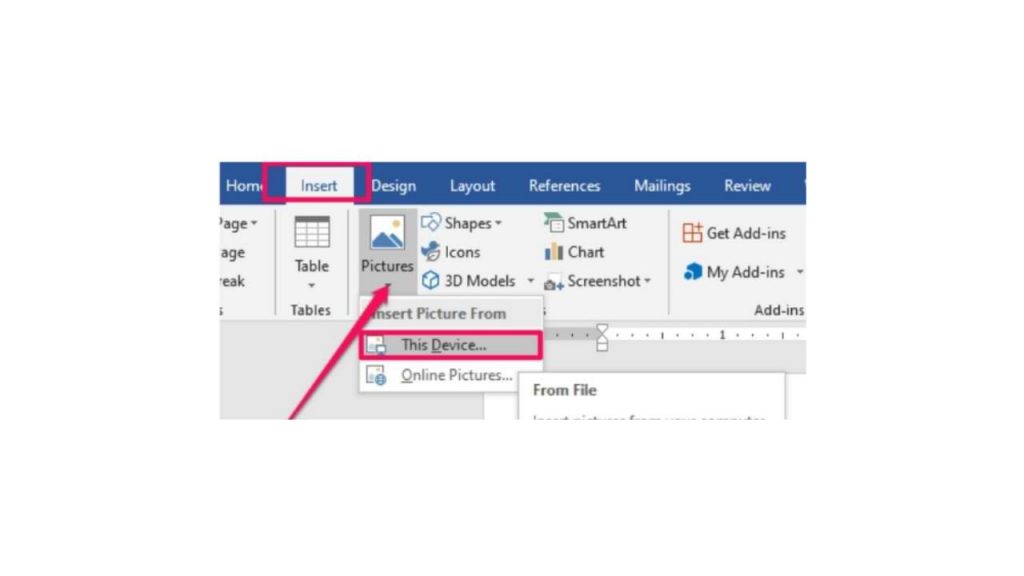
- Hover over the exact position of the word you want to add a signature to. Click Insert > Picture > insert the previous signature image file.
- After you insert the image, reduce the size again using the cursor for more precision.
- Double click on the image.
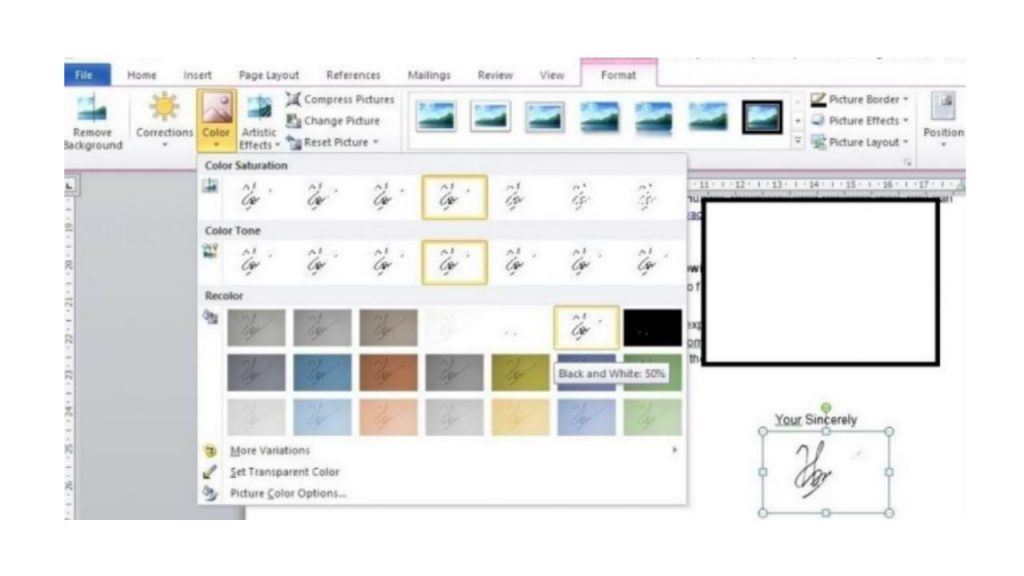
- On the Format menu, select the Color > Recolor > Black and White 50 per cent submenu.
- if your signature is not clear, double click on the image, select menu Correction > Brightness 0 per cent (Normal) Contrast 40 per cent.
You can change the last two steps depending on the contrast and color saturation you want, guys. So you can at the same time adjust the thickness of your signature that has entered the word, so guys.
I also said what Guys, how easy it is to make a signature in Microsoft Word! The most important thing is to make sure your signature is clear enough, and the photos are of high enough quality. Obviously, so that later your signature looks good, it doesn’t break.
An organizational chart (also called an organization chart, and usually shortened to org chart) is a visual representation of the roles and reporting structure of a team, department, division, or an entire company. In this tutorial, you’ll learn to easily create and modify org charts using Microsoft Word in a few minutes.
What Is an Organizational Chart?
An organizational chart, also called an org chart or organization chart, is a visual representation of the hierarchy within an organization. Employees use org charts to visualize the reporting structure of a company’s many roles and departments.
Managers can also use org charts to evaluate the responsibilities of different roles before and after a period of restructuring. Org charts are also useful for mapping groups beyond departments in large corporations, from volunteer organizations to family trees.
Besides the obvious use of visualizing the reporting structure, org charts can be a practical tool to use in many situations, including the following:
-
Evaluating the functions of departments and of employees
-
Planning cross-department projects
-
Planning and evaluating restructuring efforts
-
Tracking workloads of individual employees and of managers to determine who has too much or too little work
The easiest way to read an organizational chart is from the top to bottom. Most org charts are pyramid shaped, with the highest-ranking person at the top. Each row is a level of management, so the chart widens as it maps the lower levels of the organization. Lines connect shapes to show reporting relationships.
How to Make an Org Chart in Word
The easiest way to create an org chart from scratch in Microsoft Word is with the SmartArt tool, which is included in all versions since 2010. SmartArt provides a variety of shape tools to create and customize your chart.
Along with step-by-step instructions, which you’ll find below, we also have a quick video walking you through each of the steps to create the most effective org chart for your organization.

Here are the steps to create your org chart. You may also consider using a free organizational chart template to save time.
Note: All screenshots in this article are from Microsoft Word for Mac 2011. Other versions of Word will have variations in how the items appear, but the steps are similar. You can also use the SmartArt feature in Excel to create an org chart.
- Open a blank Microsoft Word document and click the Insert tab, click SmartArt, click Hierarchy, and then click Organization Chart.
- The top shape (a rectangle in this example) is for the head of the organization. Click the shape (you may need to move or hide the text pane) and enter the name of the person. Hit return or shift+return to start a new line to enter a title or other information. The text will automatically resize to fit inside the shape.
- The shape just below the top position is for an assistant. Click the shape and enter their information.
- The next row of shapes are for people reporting to the leader of the organization. Click each one and enter each person’s information.
Using the Text Pane
In addition to adding or editing text in a shape (which are also called autoshapes), you can add or edit text in the text pane.
In the text pane, the L-shaped icon represents an assistant. Bullet points correspond to all other positions.
The text pane is the easiest way to add or delete new shapes, as well as move shapes up or down levels. If the text pane isn’t visible, click the text pane tab (marked in red in the image below).
How to Make Changes to an Organizational Chart in Word
Once you create your org chart in Microsoft Word, use SmartArt to easily change shapes, colors, and fonts. We’ll guide you through how to change shapes, add or change colors and pictures, and modify report lines below:
Add a Shape: Select a shape (the default shape is a rectangle) and click the plus button on the text pane. The new shape will be added on the same row as the selected shape. A couple things to note:
- If no shape is selected, the new shape will not be connected to the other shapes, and will appear on the same level as the top shape in the chart.
- If a direct report is selected when adding a shape, the new shape will also be a direct report to the same position.
Add an Assistant: If the org chart already has an assistant, select that shape and follow the directions above to add a shape in the text pane.
If the assistant box has been removed, or if an assistant is needed for another position, click the shape where you add the new assistant shape, then click SmartArt in the ribbon, click Org Chart, and click Add Assistant.
Resize a Shape: Click the shape, then drag the handles on the corners or sides to make the shape larger or smaller.
Add a Direct Report: Right-click a shape and click Add Shape and choose Add Shape Below. The new shape will be in a subordinate position.
Delete a Shape: Click the shape (in an area that doesn’t include text), and then click the minus button on the text pane.
Change the Text: This is no different than changing other text in Word: Highlight the text, and then change the font, the color, the size, or any other aspect using the options in the Home tab.
Change a Shape’s Background: Right-click on a shape, click Format shape, click Fill, and choose an option.
Change the Layout: Click the Hierarchy menu on the SmartArt ribbon to change the layout of your org chart.
Change the Design: Select the chart, then choose an option from SmartArt Graphic Styles. These options will differ based on the selected layout.
Add Pictures: If you want to include pictures of the people in each position, you can add them as background images (see “Change a Shape’s Background” above).
Another option is to select the Circle Picture Hierarchy layout, then add a picture for each position by clicking on the placeholder and inserting an image.
After you add the pictures, it’ll look something like this:

Modify a Relationship: The easiest way to change a relationship (e.g. if a person moves to a new manager) is to delete the shape from under the former manager and add a new shape under the new manager. Follow the steps for deleting a shape and adding a shape outlined above.
Adding a Line: You can include connector lines by adding a shape that’s linked to another shape.
Some Org Chart Design Considerations
The default design works well for many situations, but you may also customize the appearance of each element in the chart. To keep the org chart easy to read, it’s best to keep the design consistent and simple.
Not all charts include titles, but it’s common to list the person’s name, followed by their title on a separate line. If you want the titles first, enter the information in that order.
What You Can Do with an Org Chart Once It’s Complete
Once you have completed your chart, finalize the layout and share it with others. You can save it as an online document and send or share it, or print it out to use as a handout in meetings or new hire onboarding.
-
Save the Chart as a Picture: Right-click the chart, and then click Save as picture. It’s easy to include the picture as part of a web page, or import it into documents.
-
Print the Chart: If the chart isn’t too big, try to fit it onto a single page. Play around with print settings and page margins to see if that’s applicable. Then you can print and distribute the chart.
-
View in Landscape Mode: Some charts will be easier to read in landscape mode. Change the orientation by selecting Page Setup from the Word File menu, and click Landscape.
How Do I Create an Organogram in Word?
Organogram is another word for an organizational chart, and is used primarily in the United Kingdom. To create an organogram in Microsoft Word, follow the same instructions to create an organizational chart using the SmartArt tool.
Org Charts FAQs
There are many commonly asked questions about organizational charts, including the best programs to create them in and the situations for which they are most useful. We’ve outlined answers to these questions below.
What are some other programs you can use to create org charts?
Microsoft Excel, PowerPoint, and Outlook all use the same SmartArt tool as Word and so you can use those programs to create org charts, as well. Outside of the Microsoft Office family, you can use Visio, LucidChart, OrgPlus, OrgWeaver, Pingboard, OrgChart4U, and others. But the ubiquity of Microsoft Office and the ease of use of the SmartArt feature makes creating org charts in Word or other Microsoft Office products the easiest choice for most people.
Where did the org chart originate?
Engineer Daniel McCallum and artist George Holt Henshaw are credited with creating the modern form of the organizational chart. Their chart showed the organization of the New York and Erie railroad, and included both the position each person held and the location where each worked.
The term “organization chart” made its way into the English vocabulary in the first part of the 20th century and peaked in use in the 1960s. The term continues to be in regular use today.
When are org charts not helpful?
Org charts don’t contain information related to budgeting, track informal communication channels, or map out the complexity of daily operations. Organizations that use a lot of temporary or contract employees with a high turnover rate may find maintaining an org chart to be taxing. An employee list may work better in this situation.
Make Better Decisions, Faster by Creating Org Charts in Smartsheet
Empower your people to go above and beyond with a flexible platform designed to match the needs of your team — and adapt as those needs change.
The Smartsheet platform makes it easy to plan, capture, manage, and report on work from anywhere, helping your team be more effective and get more done. Report on key metrics and get real-time visibility into work as it happens with roll-up reports, dashboards, and automated workflows built to keep your team connected and informed.
When teams have clarity into the work getting done, there’s no telling how much more they can accomplish in the same amount of time. Try Smartsheet for free, today.