
Excel for Microsoft 365 Excel 2019 Excel 2016 More…Less
Important: In Excel for Microsoft 365 and Excel 2021, Power View is removed on October 12, 2021. As an alternative, you can use the interactive visual experience provided by Power BI Desktop, which you can download for free. You can also easily Import Excel workbooks into Power BI Desktop.
In Excel, you can connect to OLAP cubes (often called multidimensional cubes) and create interesting and compelling report pages with Power View.
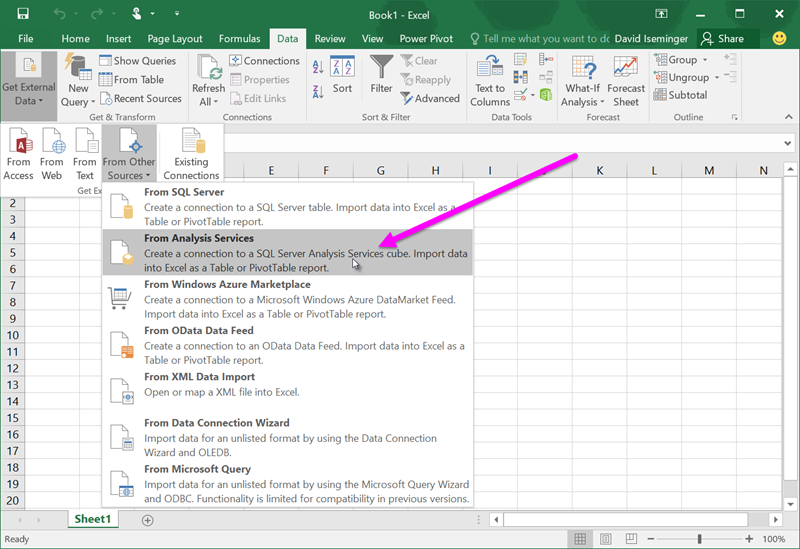
To connect to a multidimensional data source, from the ribbon select Data > Get External Data > From Other Sources > From Analysis Services.
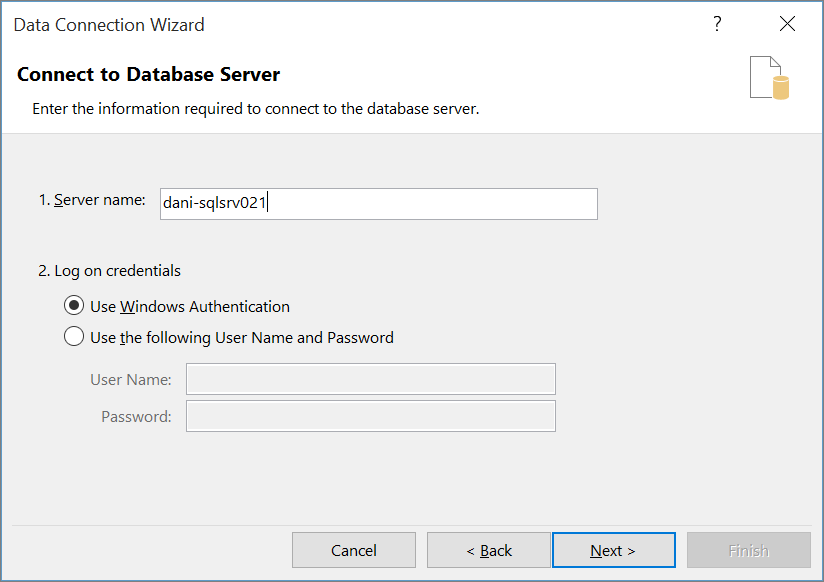
In the Data Connection Wizard, type the server name where the cube is hosted, then select and provide the appropriate credentials.
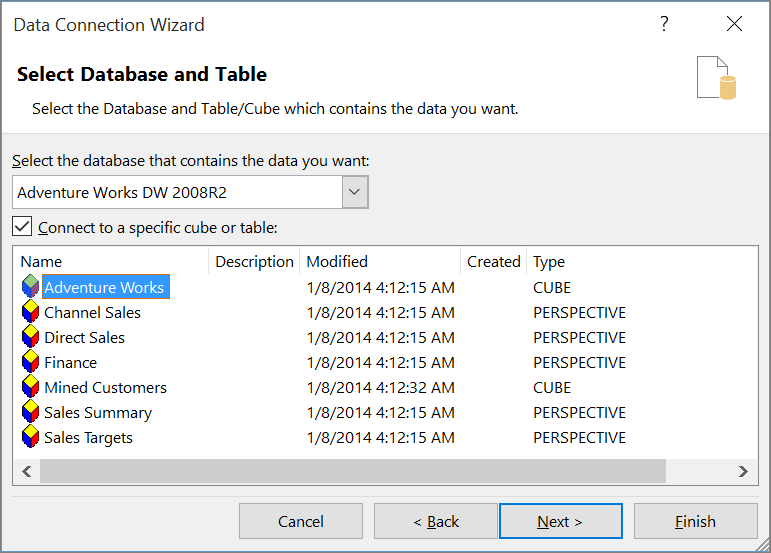
Excel presents a dialog that lists the databases, tables, and cubes that are available from the server.
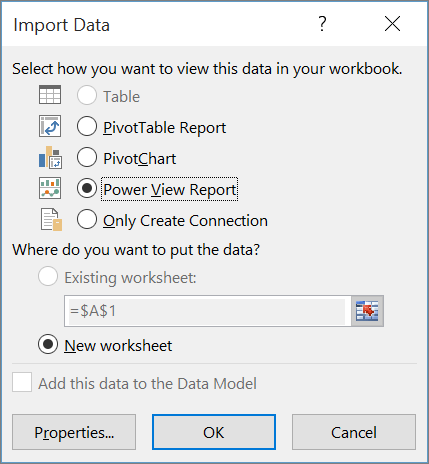
Once you select the cube you’re interested in using and select Next, you can choose where you want to view the connected data in your workbook. In this case you want to create a Power View report, so select the radio button next to Power View Report.
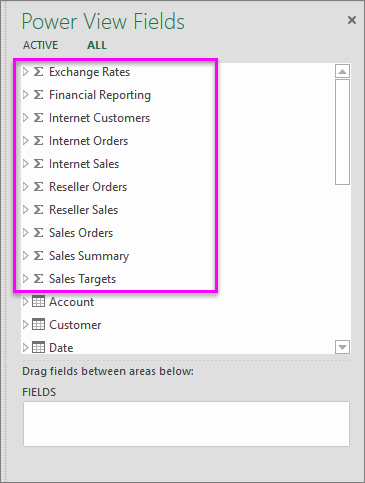
In the Power View Fields pane, you can see and access the available fields from the cube.

Now you’re ready to use the data from the cube to create compelling reports. You may find many different types of data, including the following:
-
Measure groups – this is the collection of measures found in the cube.

-
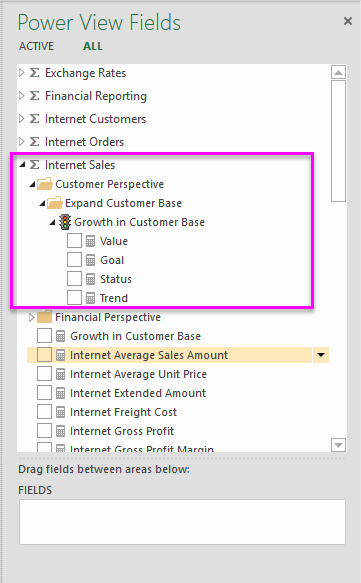
Measures and KPIs within a measure group – you can also use individual measures and KPIs from within measure groups. Just expand a measure group to see the available elements within a measure group, as shown in the following screen.
-
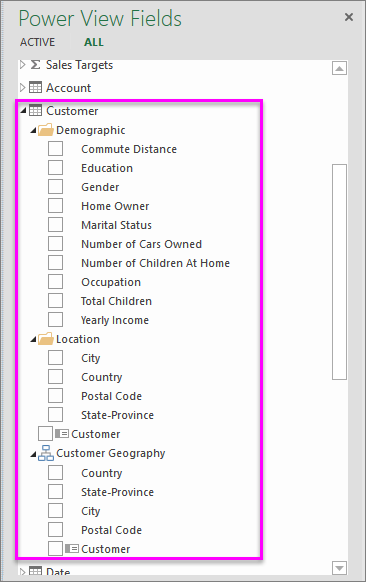
Dimensions, attributes and hierarchies – you can also use other fields from the cube, just like you would use in any other report.
With all those available fields, you can create interesting, interactive reports with Power View and OLAP cubes.

Additional Resources
For more information about Power View, OLAP, or Analysis Services, take a look at the following links:
-
Power View — Overview and Learning
-
Power View: Explore, visualize, and present your data
-
Power View and Power Pivot videos
-
Get data from Analysis Services
Need more help?
Prefer Written Instructions?
How you connect to a cube in Excel depends on if you are connecting to a specific cube for the first time or if you have connected to the cube previously.
To connect to a cube for the first time:
1. Go to the Data Menu in Excel
2. Click the “Get Data” button on the far left
3. Hover over the “From Database” option and click “From Analysis Services”

After selecting “From Analysis Services,” the Data Connection Wizard will pop-up on your screen.
4. When the wizard appears, type in your server name
5. Select “Use Windows Authentication”
6. Then, click next

You will now be able to see all the databases you have access to as well as the individual cubes in each of those databases.
7. Select the database that contains the data you desire by using the drop-down window
8. Then click on the specific cube that you are interested in connecting to
9. Click next

10. The wizard will ask you to save the connection to the desktop. You may want to change the file name, location, and/or friendly name. However, for this demonstration, we’ll leave all the fields at their default settings and click “Finish.”

11. The “Import Data” dialog box will appear and prompt you to create a pivot table with the data you just connected to
12. Simply click “OK”
13. That’s it! Your data is now connected to Excel!

To open a cube you have previously connected to:
1. Go to the Data Menu
2. Click on existing connections
3. This will bring up a list of all the cubes you connected to previously. Select the cube you want to use and click “open.”

4. When the “Import Data” dialog box appears, hit okay
5. Your cube will now be connected to excel!

 This post is part of a series of posts on implementing Jet Reports and is part of the Jet Enterprise sub-series.
With the basic Jet Enterprise installation and configuration now complete, Microsoft Excel can be connected to the cubes to test that everything is working as it should; launch Microsoft Excel, select the Jet tab and click the Data Source Settings button:

In the Data Source Settings window, click the Add button to add a new data source:

Enter a Name and set the Database Type to Cube and click Add:

When returned to the Data Source Settings window, click the Connection tab in the left pane.
Enter the full SQL Server Instance name in the Server field and select the JetGpOlap database in Database field:

Click OK to save the changes and create the data source. To use the cubes, click Pivot Table:

Select Jet Cubes and select the Finance cube and click OK:

The PivotTable can then be put together in the usual way:

ClickHouse is a very powerful database for analytics. Microsoft Excel is one of the world’s most popular business applications. There are several ways to bring ClickHouse data to Excel spreadsheets. In this article we will explain how to connect Excel to ClickHouse using the Mondrian OLAP server. This approach has been pioneered in Sergei Semenkov’s excellent article on the same topic. Sergei kindly helped us to adopt it for Altinity.Cloud.
Introduction
A couple of years ago in our blog we already explained how to connect Excel to ClickHouse using an ODBC driver. Users have to install the ODBC driver on their PCs and create ClickHouse data source in Excel. See this article for more detail on this approach.
The other way to explore ClickHouse data in Excel is using Pentaho Mondrian OLAP server as a middleware. This approach has several advantages. First, it moves configuration responsibility from the user to a DBA or other app developer. There is no need to manage ODBC connections any more. Second, it allows users to define a multi-dimensional model for ClickHouse data that is easier to understand and use than plain database tables. The data is modelled in OLAP way as cubes and dimensions and can be easily plugged to Excel PivotTable. Other applications may run custom MDX queries on ClickHouse data.
Mondrian is an open source project, as well as ClickHouse. Open source allows projects to change rapidly and adapt to user needs. We will use the eMondrian fork that has some compatibility fixes for ADOMD.NET and Excel clients. eMondrian also already includes ClickHouse JDBC driver. Mondrian can be hosted on a variety of popular java servers (Apache Tomcat, Jetty, Tiny Java Web Server).
For the purpose of this article we installed Mondrian server into Altinity.Cloud. It is running at https://emondrian.demo.trial.altinity.cloud/emondrian/xmla, and you are free to use it for your own testing. We will keep it running for the demo purposes but can not guarantee any SLA. Please refer to the original article if you would like to install Mondrian in your own environment.
Let’s start connecting Excel to the Mondrian demo Foodmart database. Open Excel, select the Data tab, then Get Data -> From Database -> From Analysis Services.

Unfortunately, if you are running MacOS it does not work. The MacOS version of Excel does not support Analysis Services. Not surprisingly, Windows is still a preferred home for Microsoft products. If your Excel supports Analysis Services, then enter the address of the Mondrian service as Server name and click Next.

Then choose a cube and click Finish. The PivotTable with cube data will appear.

This is test data. Let’s see how we can plug in ClickHouse.
Mondrian configuration for ClickHouse
In order to expose ClickHouse to Excel via Mondrian, we need to create a Mondrian schema for some ClickHouse table. The popular OnTime dataset is a good test example, and we have one hosted at Altinity.Cloud as well. We define the schema as two OLAP cubes. Cube ‘OnTime’ is based on data from an ontime table. Cube ‘ViewOnTime’ is an example of how to create a cube based on a custom query instead of a table.
On the Altinity.Cloud instance we have already configured Mondrian for OnTime dataset, so it is ready to be used. But for curious minds this is what you have to do in order to duplicate the setup in other environments.
First, you need to configure ClickHouse datasource for Mondrian. It is defined at:
$TOMCATDIR/webapps/emondrian/WEB-INF/datasources.xml
The Altinity.Cloud instance with ontime dataset is running at github.demo.trial.altinity.cloud, so we put server name and credentials in DataSourceInfo tag. You can use your own ClickHouse server as well.
<DataSources>
  <DataSource>
    <DataSourceName>OnTime</DataSourceName>
    <DataSourceDescription>ClickHouse Sample Data</DataSourceDescription>
    <URL>http://localhost:8080/emondrian/xmla</URL>
    <DataSourceInfo>
Provider=mondrian;Jdbc=jdbc:clickhouse://github.demo.trial.altinity.cloud:8443/default?ssl=true&user=mondrian&password=mondrian;JdbcDrivers=ru.yandex.clickhouse.ClickHouseDriver
    </DataSourceInfo>
    <ProviderName>Mondrian</ProviderName>
    <ProviderType>MDP</ProviderType>
    <AuthenticationMode>Unauthenticated</AuthenticationMode>
    <Catalogs>
        <Catalog name="OnTime">
            <Definition>/WEB-INF/schema/OnTime.xml</Definition>
        </Catalog>
    </Catalogs>
  </DataSource>
</DataSources>
Mondrian schema is defined in an XML file that should be deployed to a web server. In this example it should be placed into the emondrian web application folder as follows:
$TOMCATDIR/webapps/emondrian/WEB-INF/schema/OnTime.xml
<?xml version="1.0"?>
<Schema name="OnTime">
<Cube name="OnTime">
  <Table name="ontime"/>
  <Dimension name="Date">
    <Hierarchy hasAll="true" allMemberName="All Dates">
      <Level name="Year" column="Year" uniqueMembers="true" type="Numeric"/>
      <Level name="Quarter" column="Quarter" uniqueMembers="true" type="Numeric">
        <CaptionExpression>
          <SQL dialect="generic">toString(Quarter) || ' ' || toString(Year)</SQL>
        </CaptionExpression>
      </Level>
      <Level name="Month" column="Month" uniqueMembers="true" type="Numeric">
        <CaptionExpression>
<SQL dialect="generic">
transform(Month,
[1,2,3,4,5,6,7,8,9,10,11,12],
['January', 'February', 'March', 'April', 'May', 'June', 'July', 'August', 'September', 'October', 'November', 'December'],
'Unknown') || toString(Year)
</SQL>
        </CaptionExpression>
      </Level>
      <Level name="Day" column="DayofMonth" uniqueMembers="true">
        <CaptionExpression>
          <SQL dialect="generic">toString(Year) || '-' || toString(Month) || '-' || toString(DayofMonth)</SQL>
        </CaptionExpression>
      </Level>
    </Hierarchy>
  </Dimension>
  <Dimension name="Unique Carrier">
    <Hierarchy hasAll="true" allMemberName="All Unique Carriers">
      <Level name="Unique Carrier" uniqueMembers="true">
        <KeyExpression>
          <SQL dialect="generic">toStringCutToZero(UniqueCarrier)</SQL>
        </KeyExpression>
      </Level>
    </Hierarchy>
  </Dimension>
  <Dimension name="Destination">
    <Hierarchy hasAll="true" allMemberName="All Destinations">
      <Level name="Destination State Name" column="DestStateName" uniqueMembers="true"/>
      <Level name="Destination City" column="DestCityName" uniqueMembers="true"/>
    </Hierarchy>
  </Dimension>
  <Dimension name="Origin">
    <Hierarchy hasAll="true" allMemberName="All Origins">
      <Level name="Origin State Name" column="OriginStateName" uniqueMembers="true"/>
      <Level name="Origin City" column="OriginCityName" uniqueMembers="true"/>
    </Hierarchy>
  </Dimension>
  <Measure name="Flights" column="Flights" aggregator="sum" formatString="#,###"/>
  <Measure name="Air Time" column="AirTime" aggregator="sum" formatString="#,###"/>
  <Measure name="Distance" column="Distance" aggregator="sum" formatString="#,###"/>
  <Measure name="Dep Delay" column="DepDelay" aggregator="sum" formatString="#,###"/>
  <Measure name="Carrier Delay" column="CarrierDelay" aggregator="sum" formatString="#,###"/>
  <Measure name="Weather Delay" column="WeatherDelay" aggregator="sum" formatString="#,###"/>
</Cube>
<Cube name="ViewOnTime">
<View alias="ViewOnTime">
<SQL dialect="generic">
<![CDATA[select * from ontime]]>
</SQL>
</View>
  <Dimension name="Destination City Name" foreignKey="DestCityName">
    <Hierarchy hasAll="true" allMemberName="All Destinations">
      <Level name="Destination City Name" column="DestCityName" uniqueMembers="true"/>
    </Hierarchy>
  </Dimension>
  <Dimension name="Origin City Name" foreignKey="OriginCityName">
    <Hierarchy hasAll="true" allMemberName="All Origin Cities">
      <Level name="Origin City Name" column="OriginCityName" uniqueMembers="true"/>
    </Hierarchy>
  </Dimension>
  <Measure name="Dep Delay" column="DepDelay" aggregator="sum" formatString="#,###"/>
</Cube>

</Schema>
You can see how dimensions, hierarchies and measures are defined.
Once all configuration is completed, make sure that files are owned by a tomcat user and restart the server.
Trying everything together
Now we are ready to create a new connection to the Mondrian server in Excel and play with cubes from the OnTime schema. Excel will let you choose the cube. Pick one to browse its data in a PivotTable.


That’s it! We have ClickHouse ontime dataset exposed as an OLAP model in Excel in a user friendly way!
Conclusion
XMLA is a popular cross-platform protocol for querying multi-dimensional data using MDX query language. It is extensively used in Microsoft products, but also supported by popular BI tools such as Tableau, MicroStrategy and others. Having MDX integration layer for ClickHouse allows users of those products to access ClickHouse data without ODBC hassles. The OLAP model makes it easier to use as well.
For years, the only possibility to turn ClickHouse into an OLAP engine was an open source Olaper project from WonderSoft, which could be adopted for ClickHouse. Mondrian is a much more mature solution, and it raises ClickHouse MDX integration to a new level.
We will continue to use Mondrian with ClickHouse and test compatibility with other popular tools besides Excel. We are starting to try Tableau and PowerBI and hope to report on this later. Contact us at info@altinity.com if you have specific use cases that you would like to explore. We can work with you to make your preferred tools work better. Meanwhile, stay tuned!

- Remove From My Forums
-
Вопрос
-
Good Morning,
I have some 30 reports which i created using Excel 2010 . All are working fine until yesterday.
These reports use SSAS Cubes. When we moved to Excel 2016 all the reports stopped refreshing . Can some one please tell me if there is a work around? I can open the and refresh the reports that connect to the sql server tables , the issue is only when
connecting to the cubes.Please need advice.
Thanks
Все ответы
-
What is the error message you are getting while connecting to Cube.
-
Under the Data ribbon in Excel, there is an option for Properties for a connection. If you go there, the seconds tab is Definition. There is the connection string. You should see Provider=MSOLAP,X at the begining of the connection string. Further in the
string is Source=(server/instance name).Under the Usage tab, there is a check box to refresh data when opening file.
Thomas
TheSmilingDBA Thomas LeBlanc MCITP 2008 DBA
Thanks , that doesn’t work. SmilingDBA i am aware of those settings and i have the same for all my 30 reports, that was Excel 2010 and in 2016 i have the same setup, but it wont connect to the CUBES.
-
What is the error message you are getting while connecting to Cube.
Thanks SQLLearner. The error message is «Errors in the OLE DB Provider. Could not connect to the redirector. Ensure that the SQL Browser Service is running on the server».
I checked and the SQL Broswer is running. I’m pretty much sure its the version of Excel, on my other machine i have 2010 and i can open the report from there and make changes.
-
Sorry to hear that, I do not have any problems with new connections in Excel 2016. But, I have not converted any from 2010 to 2016.
The problem might be with the provider MSOLAP.6 on my machine.
The client machine might need a new provider installed from SQL Server data tools or SQL Server management studio installation.
Thomas
TheSmilingDBA Thomas LeBlanc MCITP 2008 DBA
Thanks , under the following path i have two folders 110 and 120 are either compatible with excel 2016? What version of the driver should i install?
C:Program Files (x86)Microsoft Analysis ServicesAS OLEDB
-
Yes, both should be compatible.
Sorry, not sure what the problem is.
Thomas
TheSmilingDBA Thomas LeBlanc MCITP 2008 DBA