
Choosing and implementing color palettes is a difficult task in visualizing data. Color can be used to highlight and draw attention, but also to confuse. It can be used to make things seem drab or to make them “pop”. As Maureen Stone once famously wrote, “Color used poorly will obscure, muddle and confuse.”
Using color in some of the default tools such as Excel and Tableau will yield visualizations that look just like everything else. For me, using those default colors suggests a level of laziness—that the creator couldn’t bother to consider alternative colors to better display the data or convey their argument.
But how do you choose alternative color palettes? If you’re not a designer (like me), this might seem an impossible task. Fortunately, there are lots of creative people out there willing to provide you with samples, or at least a start. For example, in two posts from Canva last year, they provided over 150 different color palettes derived from and photos and “impactful websites”. (In my opinion, Canva’s “Design School” provides some of the best beginner design work out there, which is why I’ve included them in my list of Design Resources.)
At the beginning of this year, Pablo Sáenz de Tejada turned all of those color palettes into a free, downloadable text file you can use to input them into Tableau. In turn, I’ve taken Pablo’s color palettes (thanks again, Pablo!) and converted them into 150 files you can input into Excel for your own use.
How I Created Them
In case you don’t know, every modern version of Excel contains more than 50 alternative color palettes to the default Excel colors. In the left side of the Page Layout tab (and this applies to Excel 2010, 2013, and 2016 on PCs; Macs are a little different and I explain this in a Note below), there is a Themes group, which, among others options, contains a Colors dropdown menu (the images here are all from Excel 2013).

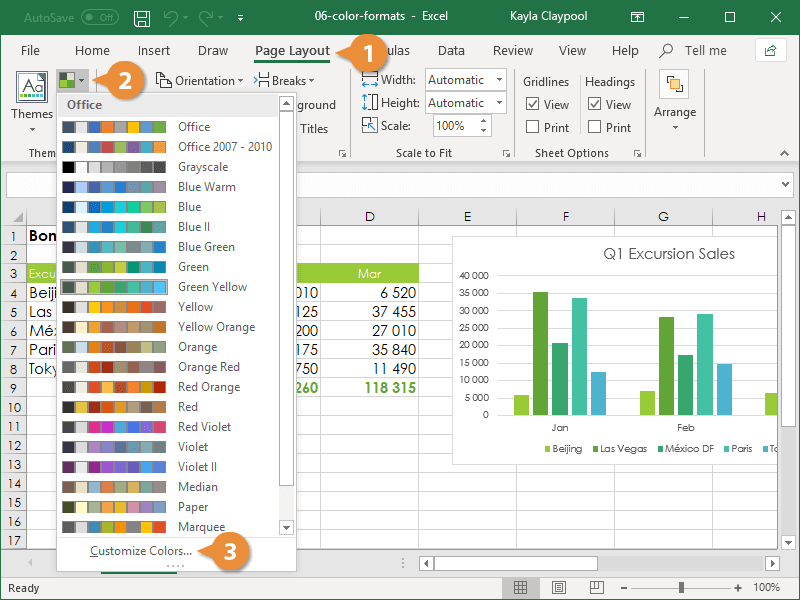
Selecting any of these alternatives changes the default colors applied in your Excel workbook. You may also notice at the very bottom that there is a Customize Colors… option. Selecting that option allows you to manually change each of the colors in the palette that you can save in an XML file format.

Instead of creating 150 palettes manually by clicking and typing in each color code, I took Pablo’s text file and created 150 separate XML files that you can input directly into Excel. (Excel requires 6 colors for each palette, plus a Background and Text color), but because the Canva palettes only have 4 colors, I added black and a gray to the 5th and 6th colors. If you want to change those colors, see the Note at the end.)
(Note: I find it interesting, actually, that to create a custom palette manually in Excel you need to use the RGB or HSL color models, but in the direct-input approach, you can use the HEX color model. Fortunately, this is the format Canva and Pablo provided, so I didn’t need to do any converting. I’d be curious to know why that is—if any of you Excel wizards know, please drop me a line.)
How You Use Them
To input the palettes into your own version of Excel, all you need to do is place the XML file in the appropriate folder. At least on Windows 7 computers, this Theme Colors folder can be found here:
C:UsersUSERNAMEAppDataRoamingMicrosoftTemplatesDocument ThemesTheme Colors.
If that doesn’t work, you need to find the folder manually. I find the best way is to pretend you are going to save a new Theme and then copy the folder location. So, in that same Themes group, use the drop-down menu under Themes and select Save Current Theme at the very bottom. The folder location that will subsequently open should contain the Theme Colors folder—copy the folder location and drop the color palette(s) you want to use in there.

 When you open the Colors dropdown in Excel, all of the color palettes you copied to that Theme Colors folder will appear, as you can see in this side-by-side screenshot.

I hope this is helpful and you find some good colors to use. Be sure to browse the Canva posts to find a palette you like and then install the XML file. You can download a zip file with all of the color palettes below; just unzip and use those you like best.
Excel Color Palettes Download
Note 1: Macs
On the Mac OS, the process is slightly different. For whatever reason, you need to add the Theme Color file through PowerPoint. You basically follow the same procedure described above, but go through PowerPoint and the color palette will then appear in Excel.
Note 2: Changing the Palettes
As I noted above, Excel requires 6 colors for each palette and because Canva provided 4 colors, I simply added a black and gray to each. If you want to change the black and gray or any of the other colors, or you want to create your own palettes, here’s how you do so.
Open any of these XML files in a text editor (I prefer TextWrangler for this purpose). The code looks like this:

Notice the name of the palette on line 3 (and is in quotes). Change this if you like and save the file (with the .xml extension) with that new palette name.
To change any of the colors, simply replace the HEX codes; for example, the first fill color code in this palette is on line 7 and the code is ‘c06014’. The black color palette is on line 11 (000000) and the gray on line 12 (8A8A8A8A). Note that you don’t need to include the hashtag in front of the code as is usually the case. (If you have an RGB palette that you need to convert to HEX, you can use a converter like this one from COLORRRS.) Save the file with the new name of the palette to the Theme Colors menu as described above.
The Excel color palette
As explained in my article about Theme-Enabled Templates, the color Palette in Microsoft Office makes it a lot easier to create a spreadsheet with decent color schemes. You can also generate your own color theme. We created the tool on this page to aid in the creation of set of theme colors that is based on a single primary color.
This will make it a LOT easier for you to customize your color palette. Simply enter the main color you want to use, and our tool will automatically generate the XML file.
Enter the Color for Accent 1
Hue (0-255)
▲1
▲2
▲3
▲4
▲5
▲6
▲D
▲L
Luminosity (Brightness) (0-255)
▲
|
Accent 1 -80% -60% -40% +25% +50% |
Accent 2 Text Text Text Text Text |
Accent 3 Text Text Text Text Text |
Accent 4 Text Text Text Text Text |
Accent 5 Text Text Text Text Text |
Accent 6 Text Text Text Text Text |
Dark 2 Text Text Text Text Text |
Light 2 Text Text Text Text Text |
Simple Budget Worksheet
Expenses
$1
Mortgage
$1
Printer Ink
$6
Flight Lessons
$9
Snacks
$2
Movies
$19
Total
Savings
Income
$20
Expenses
$19
Total Savings
$1
Color Theme
Sample Subtitle
How to Create Your Custom Color Palette
Step 1: Choose a color for Accent 1 that may be based on your brand or just something you think will look great. You can enter the RGB value using RGB(0, 150, 255), the HTML hexidecimal value (such as #557799).
Step 2: Adjust the Saturation and Luminosity to your liking, using the sample graph and budget table to get an idea how the colors will work together.
Step 3: Adjust the Hues of each of the separate Accent colors to your liking. Currently, the color scheme uses Analogous and Complimentary Colors.
Step 4: Download the XML file and store the color theme file in the special «Theme Colors» folder that Excel users to load all custom theme colors (see below).
Note: Typically, the Hue of a color ranges from 1-360 degrees (because it is usually represented in a color wheel), but Excel uses the range 0-255 if you are entering the colors manually using the HSL values.
How to Use the XML File
Excel stores your Color Theme files as separate XML documents inside the program’s user settings on your computer. If you need help finding this location, see Customize how Excel Starts at support.office.com. The location of the folder that contains the XML files for Theme Colors may look like this:
C:UsersusernameAppDataRoamingMicrosoftTemplatesDocument ThemesTheme Colors
The color theme that you use for a workbook in Excel is saved with that workbook. This means that you can save the current color theme in your workbook as a named color theme and use that theme in other workbooks.
After saving the XML file in this location, when you open Excel, you’ll be able to find this color theme listed as an option under Page Layout > Themes > Colors.
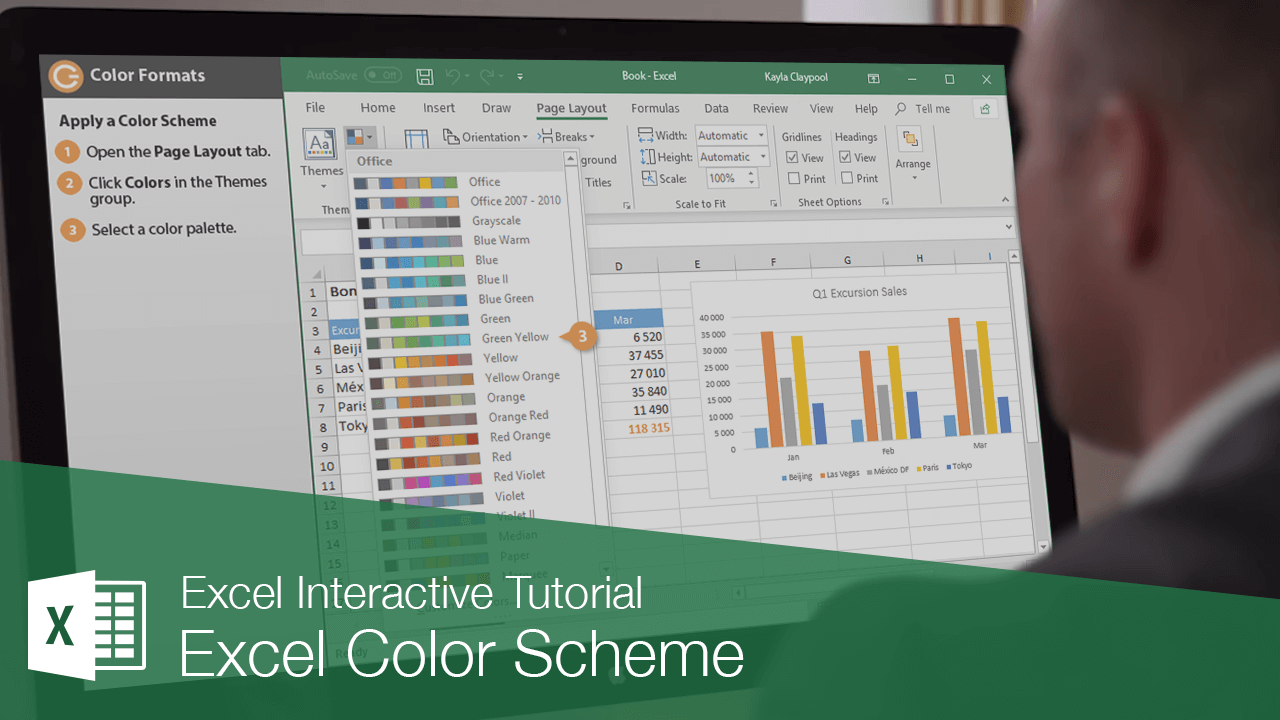
You can quickly customize the look of your spreadsheet by using color schemes. A color scheme is a set of eight coordinating colors used in formatting text and objects in the worksheet.
Apply a Color Scheme
- Click the Page Layout tab.
- Click the Colors button in the Themes group.

Each color scheme listed here shows a small preview of the colors in that set. Any text, shapes, or SmartArt graphics using theme colors will be affected by a change here.
Hover over a palette to see a preview of what it will look like applied to your spreadsheet.
- Select a color palette.
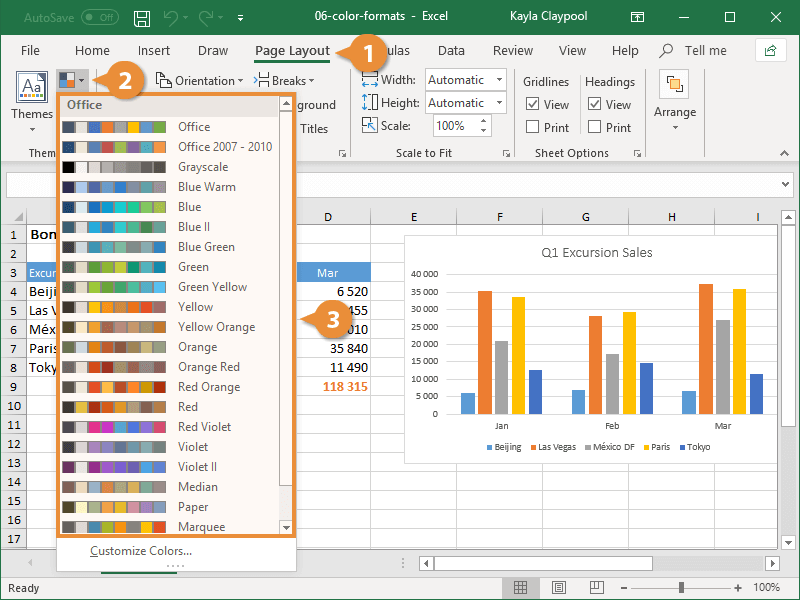
The worksheet’s colors are updated. Anything set to use theme colors, such as heading text or shapes, will be updated. This palette will now be available anywhere you’re selecting color formats in your spreadsheet.
Create a Custom Color Scheme
You can create your own color set to give your document a fresh, unique look or comply with your organization’s brand standards.
- Click the Page Layout tab.
- Click the Colors button in the Themes group.
- Select Create a Custom Color Scheme button.
The Create New Theme Colors dialog box appears where you can modify any of the 12 coordinating theme colors.
You can switch the colors with another from the current theme or a variant of one of those colors.
If you’d prefer to create a new color set entirely, rather than shuffling existing theme colors around, you can.
- Set the theme colors.
- Enter a name for your color palette.
- Click Save.
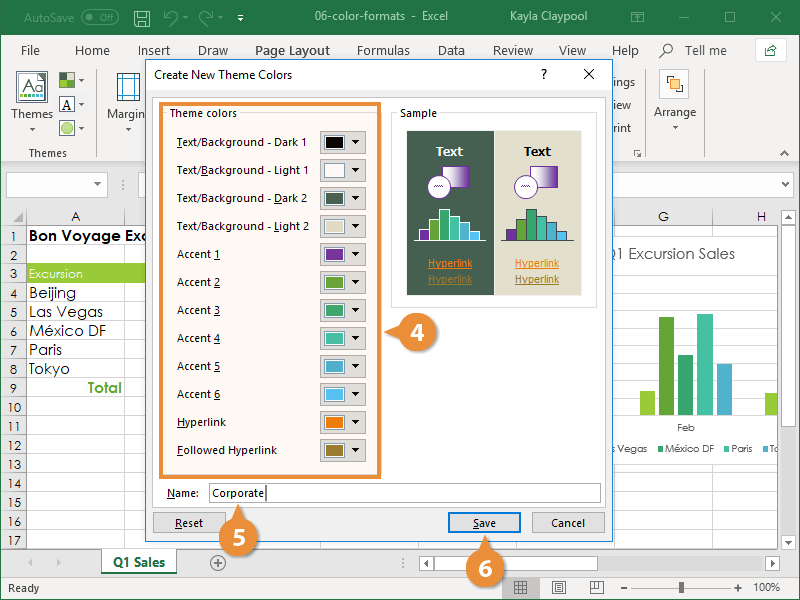
The new color set is saved and automatically applied. You can click the Colors button again to see your custom color scheme in the menu. The custom color scheme is available in all spreadsheets as well as other Office applications.

FREE Quick Reference
Click to Download
Free to distribute with our compliments; we hope you will consider our paid training.
Наименования цветов стандартной палитры Excel из 56 оттенков на русском и английском языках. Соответствие цветов индексам VBA и их RGB и HEX коды.
Стандартная палитра из 56 цветов — это ограниченная палитра оттенков, которая существовала до версии Excel 2007 года, но продолжает использоваться до сих пор.
За ограниченную палитру в VBA Excel отвечает свойство ColorIndex, которое используется для записи и чтения:
|
Sub Primer() Range(«A1»).Interior.ColorIndex = 10 MsgBox Range(«A1»).Interior.ColorIndex End Sub |
Свойство ColorIndex принимает и возвращает значения от 1 до 56.
Наименования 56 цветов палитры
Наименования 56 цветов стандартной ограниченной палитры Excel на русском и английском языках:
| Индекс | Наименование по-русски |
Наименование по-английски | Оттенок |
|---|---|---|---|
| 1 | Черный | Black | |
| 2 | Белый | White | |
| 3 | Красный | Red | |
| 4 | Лайм | Lime | |
| 5 | Синий | Blue | |
| 6 | Желтый | Yellow | |
| 7 | Фуксия* | Fuchsia* | |
| 8 | Цвет морской волны | Aqua | |
| 9 | Темно-бордовый | Maroon | |
| 10 | Зеленый | Green | |
| 11 | Темно-синий | Navy blue | |
| 12 | Оливковый | Olive | |
| 13 | Пурпурный | Purple | |
| 14 | Бирюзовый | Teal | |
| 15 | Серебряный | Silver | |
| 16 | Серый | Gray | |
| 17 | Светло-пурпурно-синий | Light purple blue | |
| 18 | Розовато-лиловый | Mauve | |
| 19 | Бледно-желто-зеленый | Pale yellow green | |
| 20 | Бледно-голубой | Pale blue | |
| 21 | Сливовый | Plum | |
| 22 | Лососевый | Salmon | |
| 23 | Темно-сине-голубой | Light navy blue | |
| 24 | Барвинок | Periwinkle | |
| 25 | Темно-синий | Navy blue | |
| 26 | Фуксия* | Fuchsia* | |
| 27 | Желтый | Yellow | |
| 28 | Цвет морской волны | Aqua | |
| 29 | Пурпурный | Purple | |
| 30 | Коричнево-малиновый | Maroon | |
| 31 | Сине-зеленый | Teal | |
| 32 | Синий | Blue | |
| 33 | Небесно-голубой | Vivid sky blue | |
| 34 | Бледно-голубой | Pale blue | |
| 35 | Бледно-зеленый | Pale green | |
| 36 | Светло-желтый | Light yellow | |
| 37 | Сине-голубой | Shade of blue | |
| 38 | Бледно-пурпурно-розовый | Pale magenta pink | |
| 39 | Светло-сиреневый | Light lilac | |
| 40 | Оранжево-персиковый | Peach-orange | |
| 41 | Светло-синий | Light blue | |
| 42 | Светло-бирюзовый | Light turquoise | |
| 43 | Желто-зеленый | Yellow green | |
| 44 | Желтый мандарин | Tangerine yellow | |
| 45 | Сигнальный оранжевый | Safety orange | |
| 46 | Оранжевый | Orange | |
| 47 | Темно-сине-серый | Dark blue gray | |
| 48 | Светло-серый | Light gray | |
| 49 | Полуночно-синий | Midnight blue | |
| 50 | Зеленая трава | Green grass | |
| 51 | Темно-зеленый | Dark green | |
| 52 | Темно-коричневый | Dark brown | |
| 53 | Темно-красный | Dark red | |
| 54 | Розовато-лиловый | Mauve | |
| 55 | Синий пигмент | Blue pigment | |
| 56 | Темный уголь | Dark charcoal |
* Вместо термина Фуксия (Fuchsia) можно использовать термин Маджента (Magenta), так как в RGB-модели Фуксия и Маджента являются одним и тем же цветом.
Обратите внимание, что в стандартной палитре Excel из 56 цветов есть повторяющиеся оттенки. Наименования цветов (по их HEX-кодам) подобраны, главным образом, по статьям, опубликованным в Википедии.
RGB и HEX коды оттенков палитры
RGB и HEX коды оттенков 56-цветной палитры Excel:
| Индекс | Код HEX | Код RGB | Оттенок |
|---|---|---|---|
| 1 | #000000 | RGB(0, 0, 0) | |
| 2 | #ffffff | RGB(255, 255, 255) | |
| 3 | #ff0000 | RGB(255, 0, 0) | |
| 4 | #00ff00 | RGB(0, 255, 0) | |
| 5 | #0000ff | RGB(0, 0, 255) | |
| 6 | #ffff00 | RGB(255, 255, 0) | |
| 7 | #ff00ff | RGB(255, 0, 255) | |
| 8 | #00ffff | RGB(0, 255, 255) | |
| 9 | #800000 | RGB(128, 0, 0) | |
| 10 | #008000 | RGB(0, 128, 0) | |
| 11 | #000080 | RGB(0, 0, 128) | |
| 12 | #808000 | RGB(128, 128, 0) | |
| 13 | #800080 | RGB(128, 0, 128) | |
| 14 | #008080 | RGB(0, 128, 128) | |
| 15 | #c0c0c0 | RGB(192, 192, 192) | |
| 16 | #808080 | RGB(128, 128, 128) | |
| 17 | #9999ff | RGB(153, 153, 255) | |
| 18 | #993366 | RGB(153, 51, 102) | |
| 19 | #ffffcc | RGB(255, 255, 204) | |
| 20 | #ccffff | RGB(204, 255, 255) | |
| 21 | #660066 | RGB(102, 0, 102) | |
| 22 | #ff8080 | RGB(255, 128, 128) | |
| 23 | #0066cc | RGB(0, 102, 204) | |
| 24 | #ccccff | RGB(204, 204, 255) | |
| 25 | #000080 | RGB(0, 0, 128) | |
| 26 | #ff00ff | RGB(255, 0, 255) | |
| 27 | #ffff00 | RGB(255, 255, 0) | |
| 28 | #00ffff | RGB(0, 255, 255) | |
| 29 | #800080 | RGB(128, 0, 128) | |
| 30 | #800000 | RGB(128, 0, 0) | |
| 31 | #008080 | RGB(0, 128, 128) | |
| 32 | #0000ff | RGB(0, 0, 255) | |
| 33 | #00ccff | RGB(0, 204, 255) | |
| 34 | #ccffff | RGB(204, 255, 255) | |
| 35 | #ccffcc | RGB(204, 255, 204) | |
| 36 | #ffff99 | RGB(255, 255, 153) | |
| 37 | #99ccff | RGB(153, 204, 255) | |
| 38 | #ff99cc | RGB(255, 153, 204) | |
| 39 | #cc99ff | RGB(204, 153, 255) | |
| 40 | #ffcc99 | RGB(255, 204, 153) | |
| 41 | #3366ff | RGB(51, 102, 255) | |
| 42 | #33cccc | RGB(51, 204, 204) | |
| 43 | #99cc00 | RGB(153, 204, 0) | |
| 44 | #ffcc00 | RGB(255, 204, 0) | |
| 45 | #ff9900 | RGB(255, 153, 0) | |
| 46 | #ff6600 | RGB(255, 102, 0) | |
| 47 | #666699 | RGB(102, 102, 153) | |
| 48 | #969696 | RGB(150, 150, 150) | |
| 49 | #003366 | RGB(0, 51, 102) | |
| 50 | #339966 | RGB(51, 153, 102) | |
| 51 | #003300 | RGB(0, 51, 0) | |
| 52 | #333300 | RGB(51, 51, 0) | |
| 53 | #993300 | RGB(153, 51, 0) | |
| 54 | #993366 | RGB(153, 51, 102) | |
| 55 | #333399 | RGB(51, 51, 153) | |
| 56 | #333333 | RGB(51, 51, 51) |
RGB-коды можно использовать в VBA Excel наряду с индексами цветов стандартной палитры, а HEX-коды — в HTML.
Процент черного в оттенках серого
Процентное соотношение черного цвета в оттенках серого:
| Индекс | Наименование | Процент черного | Оттенок |
|---|---|---|---|
| 1 | Черный | 100% | |
| 2 | Белый | 0% | |
| 15 | Серебряный | 25% | |
| 16 | Серый | 50% | |
| 48 | Светло-серый | 40% | |
| 56 | Темный уголь | 80% |
Вывод 56-цветной палитры на лист
Вывод на рабочий лист Excel 56-цветной палитры с помощью кода VBA:
|
1 2 3 4 5 6 7 8 9 10 11 12 13 14 15 16 17 18 19 |
‘Функция, преобразующая десятичный код цвета в аргументы RGB Function DecToRGB(ByVal ColDec As Long) As String Dim r As Long Dim g As Long Dim b As Long r = (ColDec And &HFF&) 256 ^ 0 g = (ColDec And &HFF00&) 256 ^ 1 b = ColDec 256 ^ 2 DecToRGB = CStr(r) & «, « & CStr(g) & «, « & CStr(b) End Function ‘Вывод 56-цветной палитры на активный лист Sub Color56() Dim i As Integer For i = 1 To 56 Cells(i, 1) = i Cells(i, 2).Interior.ColorIndex = i Cells(i, 3).Value = «RGB(« & DecToRGB(Cells(i, 2).Interior.Color) & «)» Next End Sub |
Процедура Color56 записывает в ячейку первого столбца индекс цвета, ячейке второго столбца присваивается соответствующая индексу заливка, в ячейку третьего столбца записывается RGB-код соответствующего индексу цвета.
If you want to look polished, then you have no other choice but to customize your visualization’s color palette. Don’t worry–customizing your colors is an easy low-hanging-fruit edit. Locate your style guide, scroll down to the color section, and decode the jargon. If you don’t have a style guide, or can’t find it, identify your color codes with an eyedropper or with Paint.
Then, enter your color codes in Excel!
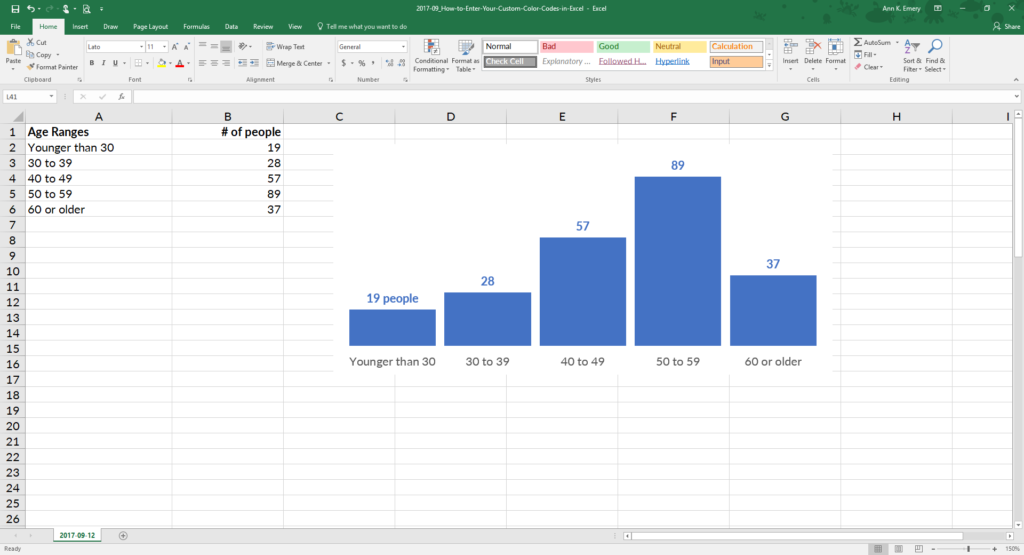
Step 1: Make Your Chart
Build your graph. Here’s a histogram that displays how many people fell into each age range. The default graph has Microsoft’s blue.

Step 2: Edit Your Chart as Needed
Declutter that cluttered graph. Delete the border, grid lines, title, and vertical axis. Label the columns directly. Nudge the columns closer together.
Step 3: Select Your Chart
Now it’s time to customize the color. Click on the bar, line, or pie wedge that you want to adjust. Can you see that the columns are selected?

Step 4: Click on More Fill Colors
Go to Chart Tools, then Format, and then Shape Outline (line graphs) or Shape Fill (all other types of graphs, like this one). Ignore the default colors! Go to the bottom where it says More Fill Colors.

Step 5: Choose a Custom Fill
On the pop-up window, click on the Custom tab.

Step 6: Type Your RGB Codes
Enter your RGB code. RGB stands for red, green, and blue. This is the recipe of reds, greens, and blues that get mixed together to produce your exact shade.
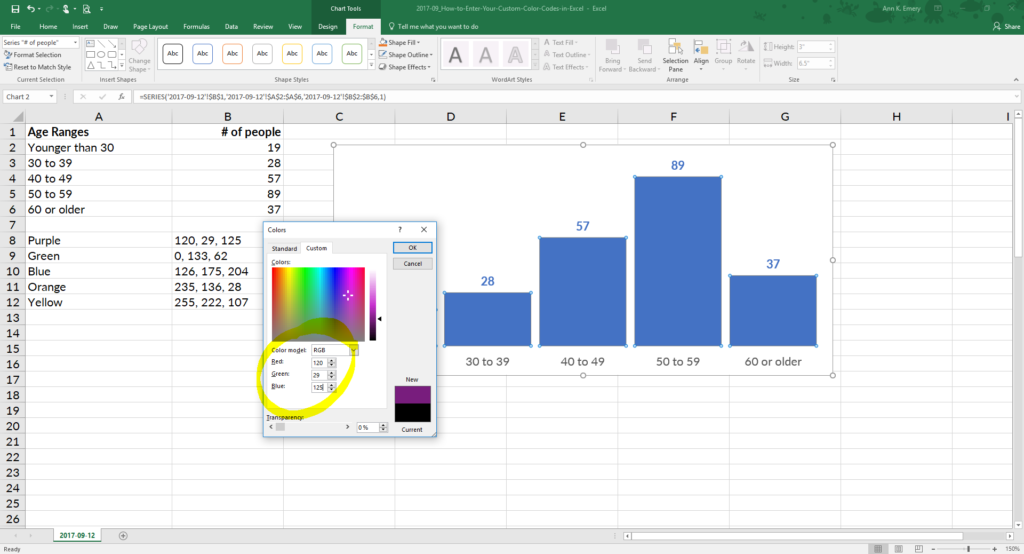
I used 120, 29, 125, which is the exact shade of purple from a client’s logo. Now I can quickly customize other pieces of the graph, like the numeric labels, because that purple is already stored under Recent Colors.

Bonus
With just a few clicks, custom colors reinforce branding and make you look professional.
Purchase the histogram template ($5)
More about Ann K. Emery
Ann K. Emery is a sought-after speaker who is determined to get your data out of spreadsheets and into stakeholders’ hands. Each year, she leads more than 100 workshops, webinars, and keynotes for thousands of people around the globe. Her design consultancy also overhauls graphs, publications, and slideshows with the goal of making technical information easier to understand for non-technical audiences.