
What to Know
- The STDEV and STDEV.S functions provide an estimate of a set of data’s standard deviation.
- STDEV syntax =STDEV(number1, [number2],…). STDEV.S =STDEV.S(number1,[number2],…).
- For older versions, type formula or select cell > select Formulas > More Functions > STDEV.
This article explains how to use the STDEV function in Excel. Information applies to Excel 2019, 2016, 2010, Excel for Microsoft 365, and Excel for the web.
In Microsoft Excel, the STDEV function and the STDEV.S function are both tools to help you estimate the standard deviation based on a set of sample data. A standard deviation is a statistical tool that tells you roughly how far each number in a list of data values varies from the average value or arithmetic mean of the list itself.
In Excel 2010 and later, the STDEV.S function is used, replacing the STDEV function that is part of older versions. STDEV is considered to be a «compatibility function,» meaning it can still be used in later versions of Excel to ensure backward compatibility. Still, Microsoft recommends you use the newer function when backward compatibility isn’t required.
Practical Uses of the STDEV Function
The STDEV and STDEV.S functions provide an estimate of a set of data’s standard deviation. The function assumes that the entered numbers represent only a small sample of the total population being studied. As a result, it doesn’t return the exact standard deviation. For example, for the numbers 1 and 2, the STDEV function in Excel returns an estimated value of 0.71 rather than the exact standard deviation of 0.5.
STDEV and STDEV.S are useful when only a small part of a total population is being tested. For example, if you’re testing manufactured products for conformity to the mean (for measures such as size or durability), you can’t test every unit, but you’ll get an estimate of how much each unit in the entire population varies from the mean.
To show how close the results for STDEV are to the actual standard deviation (using the example above), the sample size used for the function was less than one-third of the total amount of data. The difference between the estimated and the actual standard deviation is 0.02.
While STDEV.S replaces the older STDEV function, both functions have identical behavior.
STDEV and STDEV.S Syntax and Arguments
A function’s syntax refers to the layout of the function and includes the function’s name, brackets, comma separators, and arguments. The syntax for these functions is as follows:
STDEV
STDEV(number1,[number2],…)
Number1 is required. This number can be actual numbers, a named range, or cell references to the location of data in a worksheet. If cell references are used, empty cells, Boolean values, text data, or error values in the range of cell references are ignored.
Number2, … is optional. These number arguments correspond to a sample of the population. You can also use a single array or a reference to an array instead of arguments separated by commas.
STDEV.S
STDEV.S(number1,[number2],…)
Number1 is required. The first number argument corresponds to a sample of a population. You can also use a single array or a reference to an array instead of arguments separated by commas.
Number2, … is optional. Number arguments 2 to 254 correspond to a sample of a population.
Example of the STDEV Function
For this tutorial, the sample of data used for the function’s Number argument is located in cells A5 to D7. The standard deviation for this data will be calculated. For comparison purposes, the standard deviation and the average for the complete data range A1 to D10 are included.
In Excel 2010 and Excel 2007, the formula must be entered manually.
Follow these steps to complete the task and calculate the information using the built-in function:
=STDEV(A5:D7)
-
Select cell D12 to make it the active cell. This is where the results for the STDEV function will display.
-
Type the function =STDEV(A5:D7) and press Enter.
-
The value in D12 changes to 2.37. This new value represents the estimated standard deviation of each number in the list from the average value of 4.5
For older versions of Excel, type the formula manually or select cell D12 and open the visual data selector via Formulas > More Functions > STDEV.
Thanks for letting us know!
Get the Latest Tech News Delivered Every Day
Subscribe
17 авг. 2022 г.
читать 2 мин
Есть три разные функции, которые вы можете использовать для расчета стандартного отклонения в Excel:
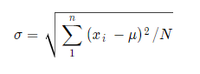
1. STDEV.P: Эта функция вычисляет стандартное отклонение генеральной совокупности. Используйте эту функцию, когда диапазон значений представляет всю совокупность.
Эта функция использует следующую формулу:
Стандартное отклонение населения = √Σ (x i – μ) 2 / N
куда:
- Σ: греческий символ, означающий «сумма».
- x i : i -е значение в наборе данных
- μ: среднее значение населения
- N: общее количество наблюдений
2. СТАНДОТКЛОН.С: Эта функция вычисляет стандартное отклонение выборки. Используйте эту функцию, когда диапазон значений представляет выборку значений, а не всю совокупность.
Эта функция использует следующую формулу:
Стандартное отклонение выборки = √Σ (x i – x ) 2 / (n-1)
куда:
- Σ: греческий символ, означающий «сумма».
- x i : i -е значение в наборе данных
- x : Среднее значение выборки
- N: общее количество наблюдений
3. СТАНДОТКЛОН: Эта функция также вычисляет стандартное отклонение выборки. Она вернет то же значение, что и функция СТАНДОТКЛОН.С .
Техническое примечание:
Поскольку формула для стандартного отклонения совокупности делится на N вместо n-1 , стандартное отклонение совокупности всегда будет меньше, чем стандартное отклонение выборки.
Причина, по которой стандартное отклонение совокупности будет меньше, заключается в том, что если мы знаем каждое значение в совокупности, то мы знаем точное стандартное отклонение.
Однако, когда у нас есть только выборка населения, у нас больше неопределенности в отношении точного стандартного отклонения всей совокупности, поэтому наша оценка стандартного отклонения должна быть больше.
В следующем примере показано, как использовать эти функции на практике.
Пример: СТАНДОТКЛОН.П и СТАНДОТКЛОН.С в Excel
Предположим, у нас есть следующий набор данных в Excel:
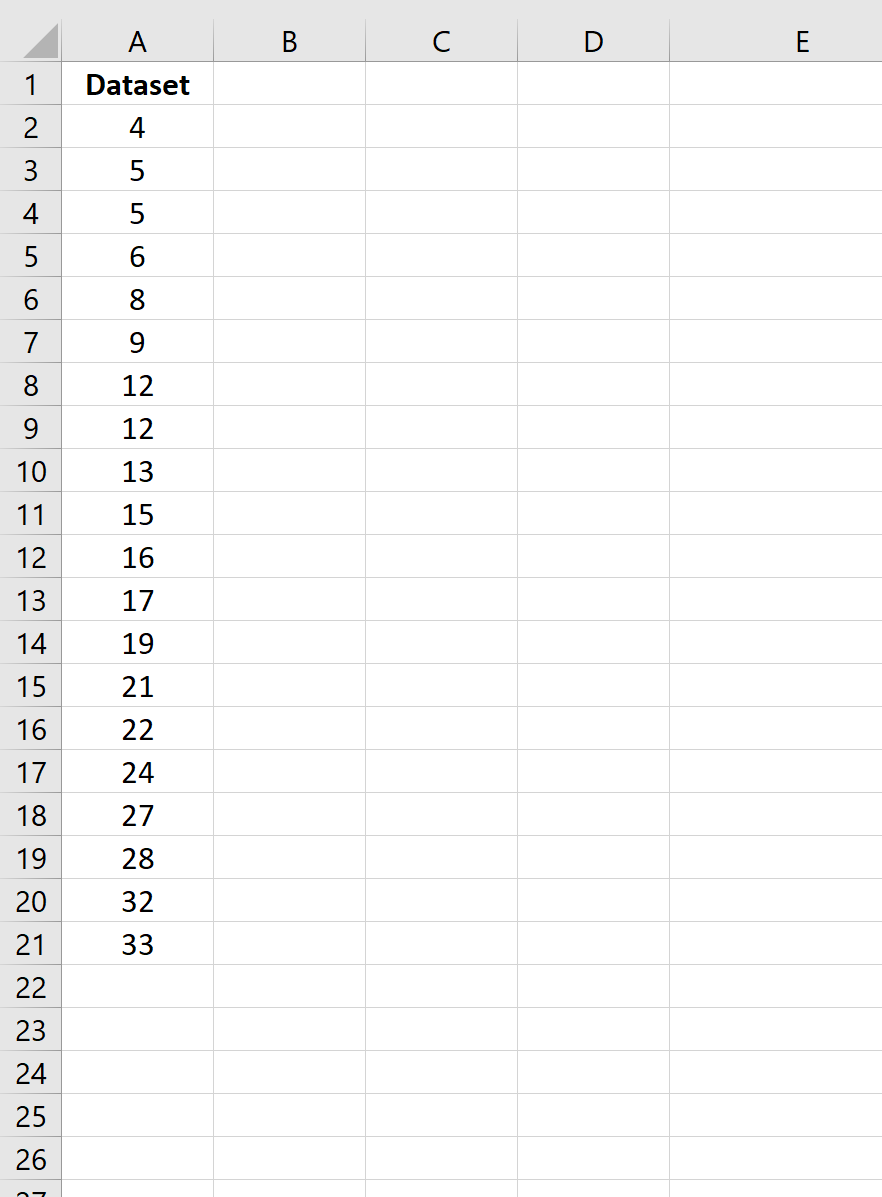
На следующем снимке экрана показано, как рассчитать стандартное отклонение для набора данных с использованием трех различных формул стандартного отклонения:
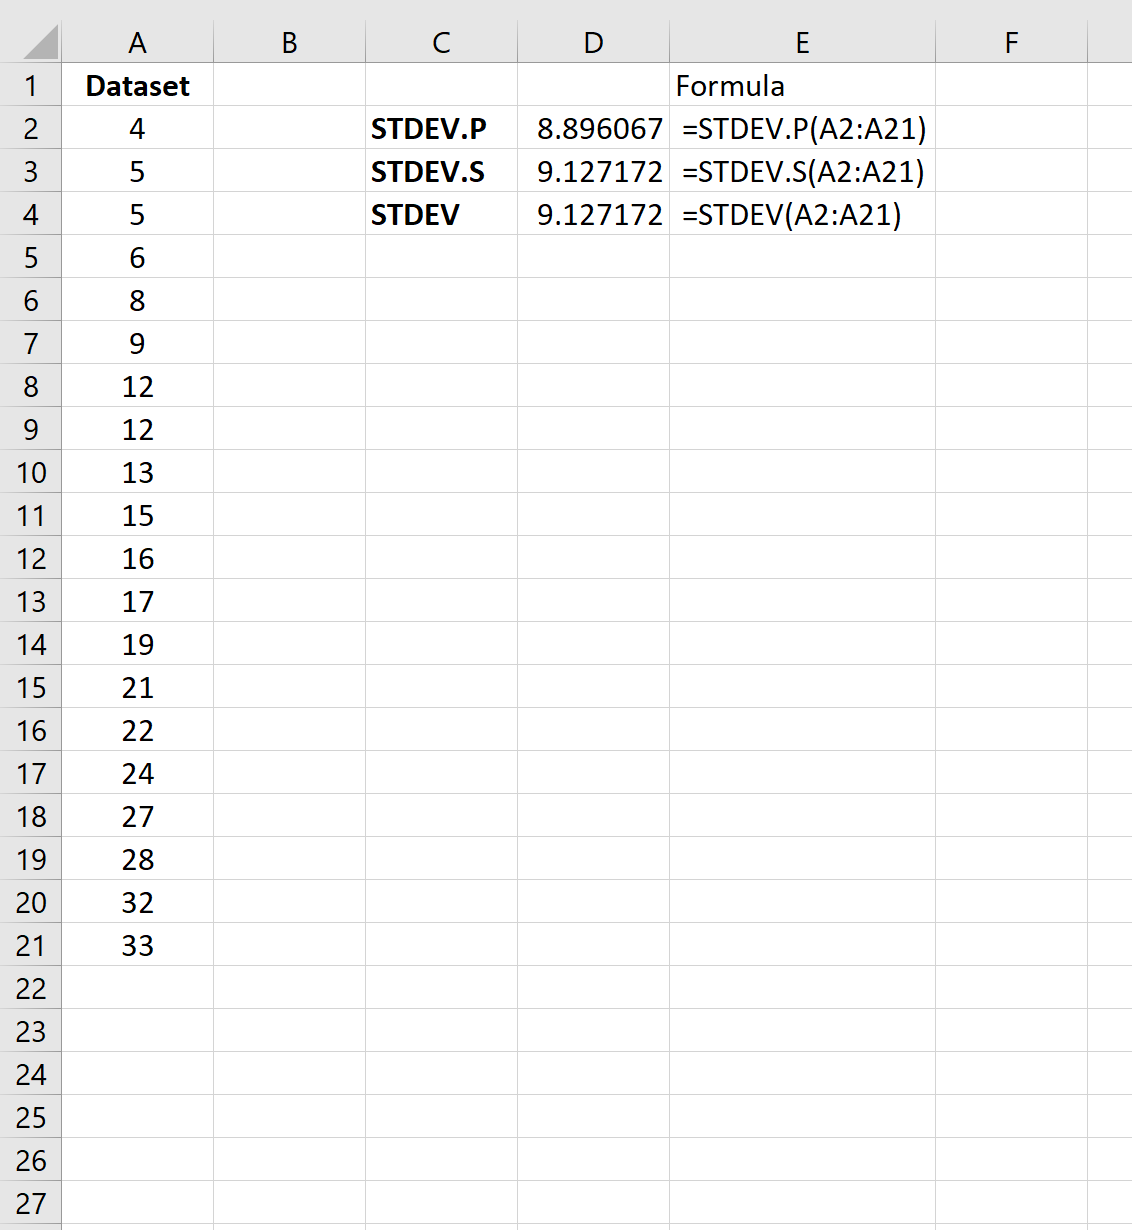
Стандартное отклонение выборки оказалось равным 9,127 , а стандартное отклонение генеральной совокупности — 8,896 .
Как упоминалось ранее, стандартное отклонение генеральной совокупности всегда будет меньше стандартного отклонения выборки.
Когда использовать STDEV.P против STDEV.S
В большинстве случаев мы не можем собрать данные для всего населения, поэтому вместо этого мы собираем данные только для выборки населения.
Таким образом, мы почти всегда используем STDEV.S для расчета стандартного отклонения набора данных, потому что наш набор данных обычно представляет собой выборку.
Обратите внимание, что СТАНДОТКЛОН и СТАНДОТКЛОН.С возвращают одни и те же значения, поэтому мы можем использовать любую функцию для вычисления выборочного стандартного отклонения данного набора данных.
На чтение 3 мин. Просмотров 1.6k. Опубликовано 25.06.2019
Содержание
- Оценить стандартное отклонение в Excel
- Практическое использование функции STDEV
- STDEV в синтаксис и аргументы Excel
- Пример функции STDEV
Оценить стандартное отклонение в Excel
Стандартное отклонение – это статистический инструмент, который приблизительно показывает, насколько в среднем каждое число в списке значений данных отличается от среднего значения или среднего арифметического самого списка.
Инструкции в этой статье относятся к Excel 2019, 2016, 2013, 2010, 2007; Excel для Mac, Excel для Office 365, Excel Online, Excel для iPad, Excel для iPhone и Excel для Android.
Практическое использование функции STDEV
В Excel функция STDEV обеспечивает оценку набора стандартных отклонений данных. Функция предполагает, что введенные числа представляют только небольшую часть или выборку из всей изучаемой популяции. В результате функция STDEV не возвращает точное стандартное отклонение. Например, для чисел 1 и 2 функция STDEV в Excel возвращает приблизительное значение 0,71, а не точное стандартное отклонение 0,5.
Несмотря на то, что функция STDEV оценивает только стандартное отклонение, функция полезна, когда тестируется только небольшая часть совокупности. Например, при тестировании готовой продукции на соответствие среднему значению (для таких мер, как размер или долговечность) тестируется не каждая единица, и это дает оценку того, насколько каждая единица во всей совокупности отличается от средней.

Чтобы показать, насколько близки результаты для STDEV к фактическому стандартному отклонению (с использованием приведенного выше примера), размер выборки, использованный для функции, был менее одной трети от общего объема данных. Разница между расчетным и фактическим стандартным отклонением составляет 0,02.
STDEV в синтаксис и аргументы Excel
Синтаксис функции относится к макету функции и включает имя функции, скобки, разделители запятых и аргументы. Синтаксис для функции стандартного отклонения:
= STDEV ( Number1 , Number2 , ... Number255 )
Number1 (обязательно). Это число может быть фактическим числом, именованным диапазоном или ссылкой на ячейку для расположения данных на листе. Если используются ссылки на ячейки, пустые ячейки, логические значения, текстовые данные или значения ошибок в диапазоне ссылок на ячейки игнорируются.
Number2, … Number255 (необязательно): можно ввести до 255 номеров.

Пример функции STDEV
В этом руководстве образец данных, используемый для аргумента Number функции, находится в ячейках с A5 по D7. Стандартное отклонение для этих данных будет рассчитано. Для сравнения включены стандартное отклонение и среднее значение для всего диапазона данных от A1 до D10.
В Excel 2010 и Excel 2007 формула должна быть введена вручную.
Выполните следующие шаги, чтобы выполнить задачу и рассчитать информацию с помощью встроенной функции:
= СТАНДОТКЛОН (А5: Д7)
-
Выберите ячейку D12 , чтобы сделать ее активной. Здесь будут отображаться результаты функции STDEV.
-
Введите функцию = STDEV (A5: D7) и нажмите Enter .
-
Значение в D12 изменяется до 2,37. Это новое значение представляет собой расчетное стандартное отклонение каждого числа в списке от среднего значения 4,5
Для более старых версий Excel введите формулу вручную или выберите ячейку D12 и откройте селектор визуальных данных с помощью Формулы > Дополнительные функции > STDEV .
Excel for Microsoft 365 Excel for Microsoft 365 for Mac Excel for the web Excel 2021 Excel 2021 for Mac Excel 2019 Excel 2019 for Mac Excel 2016 Excel 2016 for Mac Excel 2013 Excel 2010 Excel 2007 Excel for Mac 2011 Excel Starter 2010 More…Less
Estimates standard deviation based on a sample. The standard deviation is a measure of how widely values are dispersed from the average value (the mean).
Important: This function has been replaced with one or more new functions that may provide improved accuracy and whose names better reflect their usage. Although this function is still available for backward compatibility, you should consider using the new functions from now on, because this function may not be available in future versions of Excel.
For more information about the new function, see STDEV.S function.
Syntax
STDEV(number1,[number2],…)
The STDEV function syntax has the following arguments:
-
Number1 Required. The first number argument corresponding to a sample of a population.
-
Number2, … Optional. Number arguments 2 to 255 corresponding to a sample of a population. You can also use a single array or a reference to an array instead of arguments separated by commas.
Remarks
-
STDEV assumes that its arguments are a sample of the population. If your data represents the entire population, then compute the standard deviation using STDEVP.
-
The standard deviation is calculated using the «n-1» method.
-
Arguments can either be numbers or names, arrays, or references that contain numbers.
-
Logical values and text representations of numbers that you type directly into the list of arguments are counted.
-
If an argument is an array or reference, only numbers in that array or reference are counted. Empty cells, logical values, text, or error values in the array or reference are ignored.
-
Arguments that are error values or text that cannot be translated into numbers cause errors.
-
If you want to include logical values and text representations of numbers in a reference as part of the calculation, use the STDEVA function.
-
STDEV uses the following formula:

where x is the sample mean AVERAGE(number1,number2,…) and n is the sample size.

Example
Copy the example data in the following table, and paste it in cell A1 of a new Excel worksheet. For formulas to show results, select them, press F2, and then press Enter. If you need to, you can adjust the column widths to see all the data.
|
Data |
||
|---|---|---|
|
Strength |
||
|
1345 |
||
|
1301 |
||
|
1368 |
||
|
1322 |
||
|
1310 |
||
|
1370 |
||
|
1318 |
||
|
1350 |
||
|
1303 |
||
|
1299 |
||
|
Formula |
Description (Result) |
Result |
|
=STDEV(A3:A12) |
Standard deviation of breaking strength (27.46392) |
27.46392 |
Need more help?
The amount of variance in a dataset is measured by standard deviation. This statistic can be quite helpful in determining how similar or distinct your data is. Standard deviation may be calculated in Microsoft Excel quickly if you know the formulas and commands to use. In this post, we examine the functions of standard deviation, clarify how to compute standard deviation in Excel, and give an illustration.
In this article, we will learn about the calculation of the standard deviation(std) in Excel. First, let’s learn more about what Standard Deviation is.
What is Standard Deviation?
A statistic called standard deviation assesses a dataset’s dispersion in relation to its mean. It is determined as the variance’s square root (the spread of numbers in a dataset). When comparing data sets that may have the same mean but a distinct range, knowing the variation between each data point relative to the mean is helpful.
In real-life scenarios, we have populations like marks of students in a particular subject, and salaries of multiple employees in a company. Let us consider, in a company named ABC, we have 5 employees.
| Name | Salary(USD) |
|---|---|
| a | 20k |
| b | 50k |
| c | 40k |
| d | 10k |
| e | 30k |
Now, it will tell us how these salaries are dispersed across this company.
Formula for Standard Deviation is
sigma = sqrt{ sum_1^n (x_{i} – mu )^{2} /N}
It will be shown as
Where x represents the value, and μ is the mean of the population.
- Mean = 30
- N = 5
- Std = 14.14
Using Standard Deviation
Because it may be used to gauge market volatility, the standard deviation is often utilized to plan trading and investing strategies. Standard deviation is used by analysts, portfolio managers, and advisors as a fundamental risk indicator. Even the standard deviation of their mutual funds will be disclosed by investment firms.
The statistics are often simple to comprehend, which makes it useful to present them to clients and investors. Excel may be quite helpful in terms of time management by calculating and displaying the standard deviation.
How to Calculate Standard Deviation in Excel
Now, let’s learn how to use it in Excel. In Excel, we have formulas for everything and as you might have guessed for Std also. We can have this list of formulas using ‘=’ symbol shown below
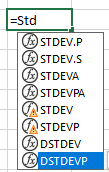
Let’s talk about them briefly,
Choose your Formula in Excel
Using the STDEV.S function
It calculates the std assuming that the sample of the population is its argument. It returns an approximate value and is used with a large population. When using STDEV.S, the Excel standard deviation formula has the following syntax:
=STDEV.S([Number1]:[Number2])
- Number 1: Choose the cell in your spreadsheet that holds the first data point from the sample population for this input.
- Number 2: Choose the cell in your spreadsheet that has the final data point from the sample population for this input.
STDEV.S uses numerical values and ignores text and logical values.
Example – Calculating the Standard Deviation
Let’s say you have the data set depicted below:
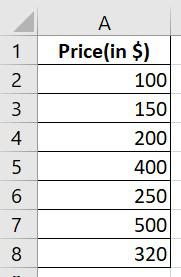
Price Dataset
Use the following formula to determine the standard deviation for this data set:
=STDEV.S(A2:A8)
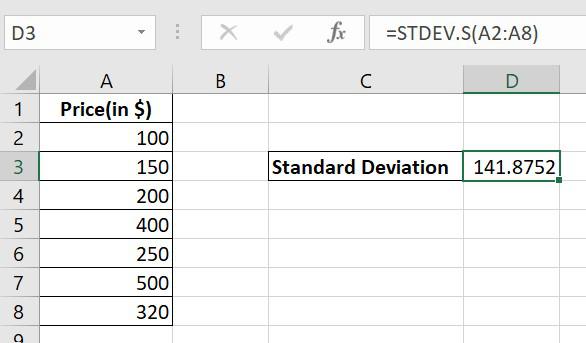
Calculating Standard Deviation
STDEV.P
It calculates the std assuming that the entire population is its argument. It returns an approximate value and is used with a large population. Uses the same formula shown above.
STDEVA
It includes text and logical symbols, whereas the above 2 functions don’t include text and logical symbols. It is used for a sample of the population. Uses “n-1” formula.
STDEPA
It includes text and logical symbols. It is used for the whole population. Uses “n” formula.
Let’s see the difference here,
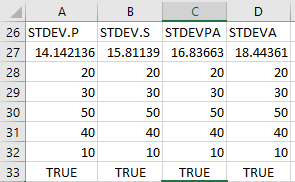
Here, the discrepancy occurs because STDEVPA and STDEVA read TRUE as 1 and STDEV.P and STDEV.S ignore it.
The formula goes like this:
1. =STDEV.P(A28:A33) ———> Formula used in A27 cell]
2. =STDEV.S(B28:B33) ———> [Formula used in B27 cell]
3. =STDEVPA(A28:A33) ———> [Formula used in C27 cell]
4. =STDEVA(A28:A33) ———> [Formula used in D27 cell]
Note – STDEV and STDEVP are for Excel 2007 or earlier. DSTDEV and DSTDEVP are used for fetching data from Database.
FAQs on Standard Deviation in Excel
1. Do I use STDEV P or STDEV s?
- The STDEV. P function is used to determine the Standard Deviation for the entire population
- The STDEV. S function is used to determine the Standard Deviation of a sample population