Липецкий индустриально-строительный колледж
(ЛИСК)
ДОКЛАД
На тему: Microsoft Office Excel
2019г.
Введение
Microsoft
Office, самое популярное семейство офисных программных продуктов, включает в
себя новые версии знакомых приложений, которые поддерживают технологии
Internet, и позволяют создавать гибкие интернет-решения.
Microsoft
Office — семейство программных продуктов Microsoft, которое объединяет самые
популярные в мире приложения в единую среду, идеальную для работы с
информацией. В Microsoft Office входят текстовый процессор Microsoft Word,
электронные таблицы Microsoft Excel, средство подготовки и демонстрации
презентаций Microsoft PowerPoint и новое приложение Microsoft Outlook. Все эти
приложения составляют Стандартную редакцию Microsoft Office. В Профессиональную
редакцию входит также СУБД Microsoft Access.
Microsoft
Excel – программа предназначенная для организации данных в таблице для
документирования и графического представления информации.
Программа
MSExcel применяется при создании комплексных документов в которых необходимо:
•
использовать одни и те же данные в разных рабочих листах;
•
изменить и восстанавливать связи.
Преимуществом
MSExcel является то, что программа помогает оперировать большими объемами
информации. рабочие книги MSExcel предоставляют возможность хранения и
организации данных, вычисление суммы значений в ячейках. MsExcel предоставляет
широкий спектр методов позволяющих сделать информацию простой для восприятия.
В наше
время, каждому человеку важно знать и иметь навыки в работе с приложениями
Microsoft Office, так как современный мир насыщен огромным количеством
информацией, с которой просто необходимо уметь работать.
Более
подробно в этой работе будет представлено приложение MSExcel, его функции и
возможности. А также использование сценариев с их практическим применением.
Microsoft
Excel: Понятия и возможности
Табличный
процессор MS Excel (электронные таблицы) – одно из наиболее часто используемых
приложений пакета MS Office, мощнейший инструмент в умелых руках, значительно
упрощающий рутинную повседневную работу. Основное назначение MS Excel – решение
практически любых задач расчетного характера, входные данные которых можно
представить в виде таблиц. Применение электронных таблиц упрощает работу с
данными и позволяет получать результаты без программирования расчётов. В
сочетании же с языком программирования Visual Basic for Application (VBA),
табличный процессор MS Excel приобретает универсальный характер и позволяет
решить вообще любую задачу, независимо от ее характера.
Особенность
электронных таблиц заключается в возможности применения формул для описания
связи между значениями различных ячеек. Расчёт по заданным формулам выполняется
автоматически. Изменение содержимого какой-либо ячейки приводит к пересчёту
значений всех ячеек, которые с ней связаны формульными отношениями и, тем
самым, к обновлению всей таблицы в соответствии с изменившимися данными.
Основные
возможности электронных таблиц:
1. проведение
однотипных сложных расчётов над большими наборами данных;
2. автоматизация
итоговых вычислений;
3. решение
задач путём подбора значений параметров;
4. обработка
(статистический анализ) результатов экспериментов;
5. проведение
поиска оптимальных значений параметров (решение оптимизационных задач);
6. подготовка
табличных документов;
7. построение
диаграмм (в том числе и сводных) по имеющимся данным;
8. создание
и анализ баз данных (списков).
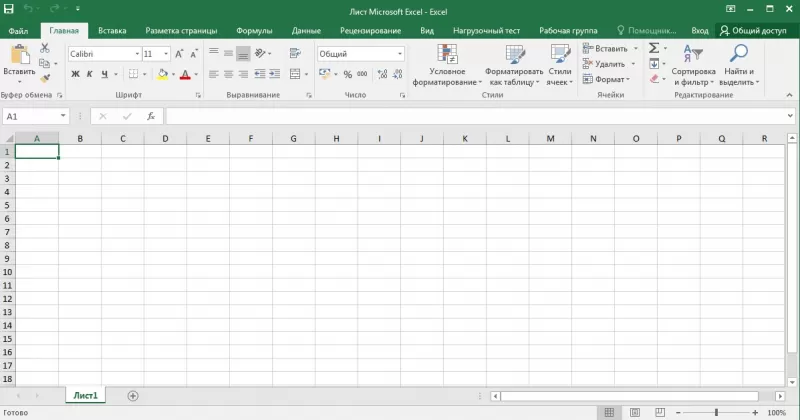
Основные элементы окна MS Excel
Основными элементами рабочего окна являются:
1.
Строка заголовка (в ней указывается имя программы) с кнопками управления окном
программы и окном документа (Свернуть, Свернуть в окно или Развернуть во весь
экран, Закрыть);
2.
Строка основного меню (каждый пункт меню представляет собой набор команд,
объединенных общей функциональной направленностью) плюс окно для поиска
справочной информации.
3.
Панели инструментов (Стандартная, Форматирование и др.).
4.
Строка формул, содержащая в качестве элементов поле Имя и кнопку Вставка
функции (fx), предназначена для ввода и редактирования значений или формул в
ячейках. В поле Имя отображается адрес текущей ячейки.
5.
Рабочая область (активный рабочий лист).
6.
Полосы прокрутки (вертикальная и горизонтальная).
7.
Набор ярлычков (ярлычки листов) для перемещения между рабочими листами.
8.
Строка состояния.
Структура
электронных таблиц
Файл,
созданный средствами MS Excel, принято называть рабочей книгой. Рабочих книг
создать можно столько, сколько позволит наличие свободной памяти на
соответствующем устройстве памяти. Открыть рабочих книг можно столько, сколько
их создано. Однако активной рабочей книгой может быть только одна текущая
(открытая) книга.
Рабочая
книга представляет собой набор рабочих листов, каждый из которых имеет
табличную структуру. В окне документа отображается только текущий (активный)
рабочий лист, с которым и ведётся работа. Каждый рабочий лист имеет название,
которое отображается на ярлычке листа в нижней части окна. С помощью ярлычков
можно переключаться к другим рабочим листам, входящим в ту же рабочую книгу.
Чтобы переименовать рабочий лист, надо дважды щёлкнуть мышкой на его ярлычке и
заменить старое имя на новое или путём выполнения следующих команд: меню
Формат, строка Лист в списке меню, Переименовать. А можно и, установив
указатель мышки на ярлык активного рабочего листа, щёлкнуть правой кнопкой
мыши, после чего в появившемся контекстном меню щёлкнуть по строке «Переименовать»
и выполнить переименование. В рабочую книгу можно добавлять (вставлять) новые
листы или удалять ненужные.
Вставку
листа можно осуществить путём выполнения команды меню» Вставка, строка «Лист» в
списке пунктов меню. Вставка листа произойдёт перед активным листом. Выполнение
вышеизложенных действий можно осуществить и с помощью контекстного меню,
которое активизируется нажатием правой кнопки мышки, указатель которой должен
быть установлен на ярлычке соответствующего листа. Чтобы поменять местами
рабочие листы нужно указатель мышки установить на ярлычок перемещаемого листа,
нажать левую кнопку мышки и перетащить ярлычок в нужное место.
Рабочий
лист (таблица) состоит из строк и столбцов. Столбцы озаглавлены прописными
латинскими буквами и, далее, двухбуквенными комбинациями. Всего рабочий лист
содержит 256 столбцов, поименованных от A до IV. Строки последовательно
нумеруются числами от 1 до 65536.
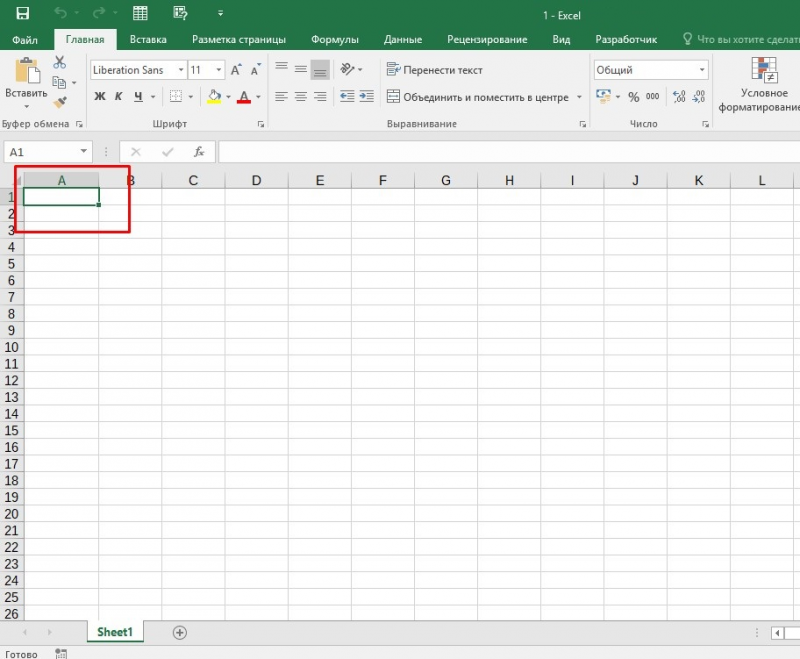
На
пересечении столбцов и строк образуются ячейки таблицы. Они являются
минимальными элементами, предназначенными для хранения данных. Каждая ячейка
имеет свой адрес. Адрес ячейки состоит из имени столбца и номера строки, на
пересечении которых расположена ячейка, например, A1, B5, DE324. Адреса ячеек
используются при записи формул, определяющих взаимосвязь между значениями,
расположенными в разных ячейках. В текущий момент времени активной может быть
только одна ячейка, которая активизируется щелчком мышки по ней и выделяется
рамкой. Эта рамка в Excel играет роль курсора. Операции ввода и редактирования
данных всегда производятся только в активной ячейке.
На
данные, расположенные в соседних ячейках, образующих прямоугольную область,
можно ссылаться в формулах как на единое целое. Группу ячеек, ограниченную
прямоугольной областью, называют диапазоном. Наиболее часто используются
прямоугольные диапазоны, образующиеся на пересечении группы последовательно
идущих строк и группы последовательно идущих столбцов. Диапазон ячеек
обозначают, указывая через двоеточие адрес первой ячейки и адрес последней
ячейки диапазона, например, B5:F15. Выделение диапазона ячеек можно осуществить
протягиванием указателя мышки от одной угловой ячейки до противоположной ячейки
по диагонали. Рамка текущей (активной) ячейки при этом расширяется, охватывая
весь выбранный диапазон.
Для
ускорения и упрощения вычислительной работы Excel предоставляет в распоряжение
пользователя мощный аппарат функций рабочего листа, позволяющих осуществлять
практически все возможные расчёты.
В
целом MS Excel содержит более 400 функций рабочего листа (встроенных функций).
Все они в соответствии с предназначением делятся на 11 групп (категорий):
1.
финансовые функции;
2.
функции даты и времени;
3.
арифметические и тригонометрические
(математические
функции);
4.
статистические функции;
5.
функции ссылок и подстановок;
6.
функции баз данных (анализа списков);
7.
текстовые функции;
8. логические
функции;
9. информационные
функции (проверки свойств и значений);
10. инженерные
функции;
11. внешние
функции.
Запись
любой функции в ячейку рабочего листа обязательно начинается с символа равно
(=). Если функция используется в составе какой-либо другой сложной функции или
в формуле (мегаформуле), то символ равно (=) пишется перед этой функцией
(формулой). Обращение к любой функции производится указанием её имени и
следующего за ним в круглых скобках аргумента (параметра) или списка
параметров. Наличие круглых скобок обязательно, именно они служат признаком
того, что используемое имя является именем функции. Параметры списка (аргументы
функции) разделяются точкой с запятой (;). Их количество не должно превышать
30, а длина формулы, содержащей сколько угодно обращений к функциям, не должна
превышать 1024 символов. Все имена при записи (вводе) формулы рекомендуется набирать
строчными буквами, тогда правильно введённые имена будут отображены прописными
буквами.
Возможные
ошибки при использовании функций в формулах
При
работе с электронными таблицами важно не только уметь ими пользоваться, но и не
совершать распространенных ошибок.
Исследования
показали, что более половины людей, часто использующих Microsoft Excel в своей
деятельности, держат на рабочем столе обычный калькулятор! Причина оказалась
проста: чтобы произвести операцию суммирования двух или более ячеек для
получения промежуточного результата (а такую операцию, как показывает практика,
большинству людей приходится выполнять довольно часто), необходимо выполнить
два лишних действия. Найти место в текущей таблице, где будет располагаться
итоговая сумма, и активизировать операцию суммирования, нажав кнопку S (сумма).
И лишь после этого можно выбрать те ячейки, значения которых предполагается
просуммировать.
В
ячейке Excel вместо ожидаемого вычисленного значения можно увидеть #######
(решетки). Это лишь признак того, что ширина ячейки недостаточна для отображения
полученного числа.
Следующие
значения, называемые константами ошибок, Excel отображает в ячейках, содержащих
формулы, в случае возникновения ошибок при вычислениях по этим формулам:
1. #ИМЯ? – неправильно введено
имя функции или адрес ячейки.
2. # ДЕЛ/0! – значение
знаменателя в формуле равно нулю (деление на нуль).
3. #ЧИСЛО! – значение
аргумента функции не соответствует допустимому. Например, ln(0), ln(-2), .
4. #ЗНАЧ! – параметры функции
введены неправильно. Например, вместо диапазона ячеек введено их последовательное
перечисление.
5. #ССЫЛКА! – неверная ссылка
на ячейку.
Анализ
данных. Использование сценариев
Данные — сведения:
— полученные путем измерения,
наблюдения, логических или арифметических операций;
— представленные в форме,
пригодной для постоянного хранения, передачи и (автоматизированной) обработки.
В Excel тип данных – тип,
значения хранящегося в ячейке.
Когда данные вводятся на
рабочий лист, Excel автоматически анализирует их определяет тип данных. Тип
данных, присваиваемый ячейке по умолчанию, определяет способ анализа данных,
который можно применять к данной ячейке.
Например, в большинстве
инструментах анализа данных используются именно числовые значения. Если вы
попробуете ввести текстовое значении, то программа отреагирует сообщением об
ошибке.
Типы данных:
1. Текстовый
2. Числовой
3. Число
4. Числовые символы
5. Дроби
6. Дата и время
7. Даты
8. Время
9. Формулы
Анализ
данных — область информатики, занимающаяся построением и исследованием наиболее
общих математических методов и вычислительных алгоритмов извлечения знаний из
экспериментальных (в широком смысле) данных.
Анализ данных – сравнение
различной информации.
Работа с таблицей не
ограничивается простым занесением в нее данных. Трудно представить себе
область, где бы ни требовался
анализ этих данных.
Таблицы
данных являются частью блока задач, который иногда называют инструментами
анализа «что-если». Таблица данных представляет собой диапазон ячеек,
показывающий, как изменение определенных значений в формулах влияет на
результаты этих формул. Таблицы предоставляют способ быстрого вычисления
нескольких версий в рамках одной операции, а также способ просмотра и сравнения
результатов всех различных вариантов на одном листе.
MsExcel
представляет широкие возможности для проведения анализа данных, находящихся в
списке. К средствам анализа относятся :
• Обработка списка с помощью
различных формул и функций;
• Построение диаграмм и
использование карт MsExcel;
• Проверка данных рабочих
листов и рабочих книг на наличие ошибок;
• Структуризация рабочих
листов;
•
Автоматическое подведение итогов (включая мстер частичных сумм);
• Консолидация данных;
• Сводные таблицы;
• Специальные средства анализа
выборочных записей и данных – подбор параметра, поиск решения, сценарии и др.
Сценарии
Одно
из главных преимуществ анализа данных – предсказание будущих событий на основе
сегодняшней информации.
Сценарии
являются частью блока задач, который иногда называют инструментами анализа
«что-если» (Анализ «что-если». Процесс изменения значений ячеек и анализа
влияния этих изменений на результат вычисления формул на листе, например
изменение процентной ставки, используемой в таблице амортизации для определения
сумм платежей.).
Сценарий
— это набор значений, которые в приложении Microsoft Office Excel сохраняются и
могут автоматически подставляться в лист. Сценарии можно использовать для
прогноза результатов моделей расчетов листа. Существует возможность создать и
сохранить в листе различные группы значений, а затем переключаться на любой из
этих новых сценариев, чтобы просматривать различные результаты. Или можно
создать несколько входных наборов данных (изменяемых ячеек) для любого
количества переменных и присвоить имя каждому набору. По имени выбранного
набора данных MSExcel сформирует на рабочем листе результаты анализа. Кроме
этого, диспетчер сценариев позволяет создать итоговый отчет по сценариям, в
котором отображаются результаты подстановки различных комбинаций входных
параметров.
При
разработке сценария данные на листе будут меняться. По этой причине перед
началом работы со сценарием придется создать сценарий, сохраняющий
первоначальные данные, или же создать копию листа Excel.
Все
сценарии создаются в диалоговом окне Добавление сценария. Прежде всего
необходимо указать ячейки для отображения прогнозируемых изменений. Ссылки на
ячейки отделяются друг от друга двоеточием или точкой с запятой. Затем в
диалоговом окне Значение ячеек сценария каждой ячейке присваивается новое
значение. Эти значения используются при выполнении соответствующего сценария.
После ввода значений генерируется сценарий. При выборе другого сценария,
значения в ячейках меняются так, как указано в сценарии.
Для
защиты сценария используются флажки, которые выставляются в нижней части
диалогового окна Добавление сценария. Флажок Запретить изменения не позволяет
пользователям изменить сценарий. Если активизирован флажок Скрыть, то
пользователи не смогут, открыв лист, увидеть сценарий. Эти опции применяются
только тогда, когда установлена защита листа.
Если
требуется одновременно сравнить несколько сценариев, то можно создать Итоговый
отчет, щелкнув в диалоговом окне по кнопке «Отчет».
Во
многих экономических задачах результат расчета зависит от нескольких параметров,
которыми можно управлять.
Диспетчер
сценариев открывается командой «Сервис/Сценарии.»
В окне
диспетчера сценариев с помощью соответствующих кнопок можно добавить новый
сценарий, изменить, удалить или вывести существующий, а также – объединить
несколько различных сценариев и получить итоговый отчет по существующим сценариям.
Заключение
Характерной чертой
современности является стремительный научно-технический прогресс, что требует
от менеджеров и бизнесменов значительного повышения ответственности за качество
принятия решений. Это основная причина, которая обусловливает необходимость
научного принятия управленческих решений.
При помощи этого продукта
можно анализировать большие массивы данных. В Excel можно использовать более
400 математических, статистических, финансовых и других специализированных
функций, связывать различные таблицы между собой, выбирать произвольные форматы
представления данных, создавать иерархические структуры.
Программа MS Excel, являясь
лидером на рынке программ обработки электронных таблиц, определяет тенденции
развития в этой области. Вплоть до версии 4.0 программа Excel представляла
собой фактический стандарт с точки зрения функциональных возможностей и
удобства работы. Теперь на рынке появились гораздо более новые версии, которые
содержат много улучшений и приятных неожиданностей.
Изучив возможности приложения, можно сделать вывод, что оно подходит для экономистов и бухгалтер…
Изучив возможности приложения, можно
сделать вывод, что оно подходит для
экономистов и бухгалтеров.
Excel – это
табличный процессор, который оснащен
инструментами для создания отчетов,
вычислений, составления диаграмм. Но и
рядовому пользователю для решения
бытовых нужд он пригодится. Эксель –
это средоточие полезных функций.
Программа помогает автоматизировать
рабочий процесс.
При изучении опций
становится понятно, что Microsoft Excel – это
универсальное средство, которое
позволяет:
- работать с различными типами данных;
- выполнять расчеты;
- организовывать дневники и журналы;
- хранить информацию;
- составлять отчеты;
- строить графики и диаграммы;
- создавать схемы и рисунки;
- организовывать списки и базы данных;
-
импортировать и экспортировать
информацию; - автоматизировать однотипные действия;
- создавать панели управления;
-
находить решение математических задач
и уравнений; - вести семейный бюджет;
-
программировать на встроенном языке
VBA и т.д.
Интерфейс
программы
Мы
узнали, что такое Эксель, теперь можно
приступать к рассмотрению следующего
вопроса. Как выглядит главное окно
приложения? В MS Excel – это белый лист,
расчерченный в виде таблицы. Минимальная
единица – прямоугольник, называемый
ячейкой (клеткой). Табличная форма –
область создаваемой или редактируемой
книги.
При
рассмотрении интерфейса приложения
пользователей волнует вопрос: «В Excel
что это находится над таблицей?».
Поле, располагающееся слева от пиктограммы
fx, – это строка формул. Предназначена
она для ввода текста, формул, функций,
числовой информации.
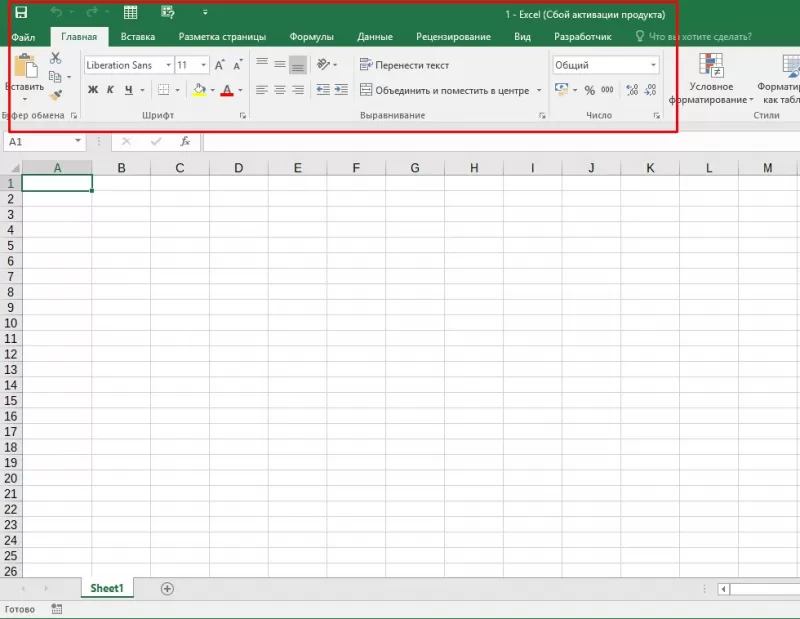
В
MS Excel 2007 и выше над строкой формул
размещается лента (панель инструментов
в развернутом виде). Новшество 2007 версии
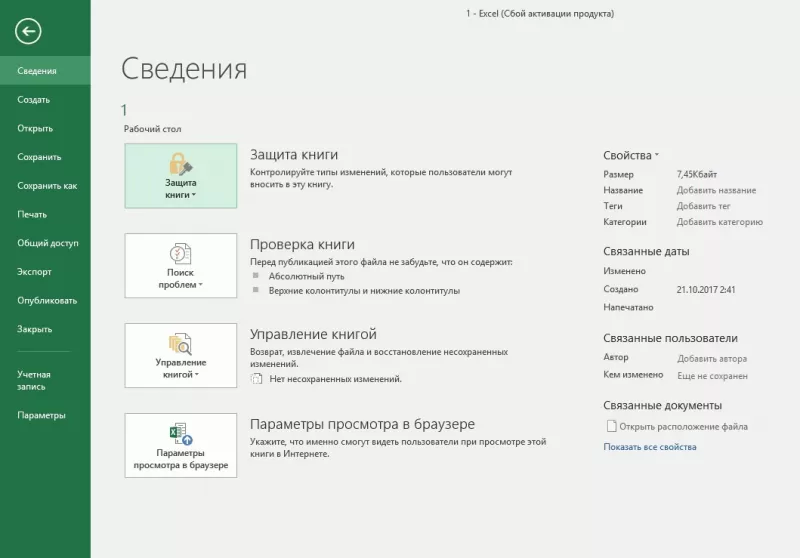
заключается в наличии круглой кнопки
со значком компании. Кликнув на
пиктограмму, пользователь откроет меню
(аналогичное меню «Файл» в вариации
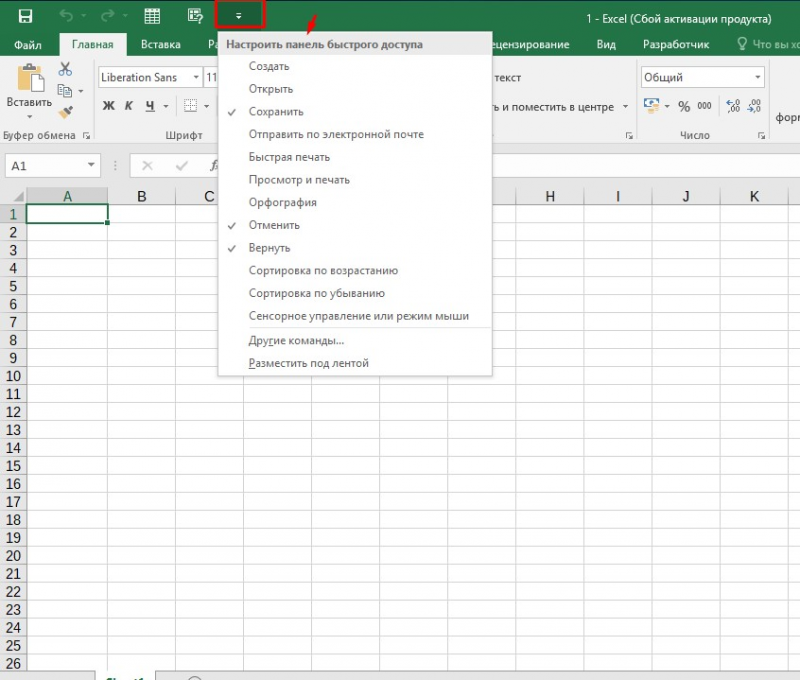
2003). Справа размещается панель быстрого
доступа. Пользователь настраивает ее
по своему усмотрению. По умолчанию на
ней располагаются кнопки: «Сохранить»,
«Отменить», «Вернуть».
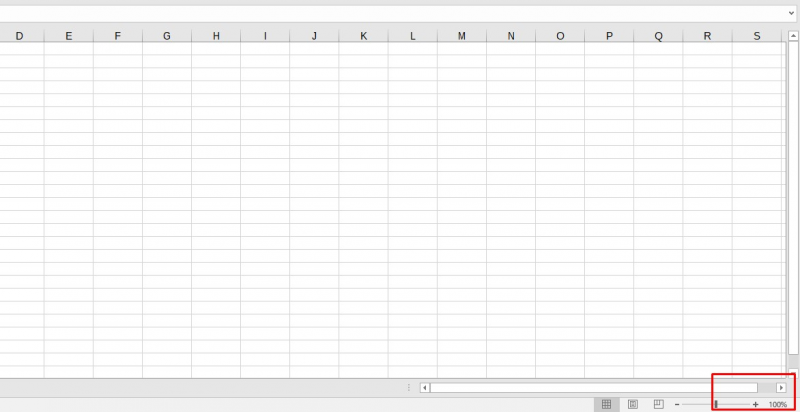
Строка
состояния внизу рабочей области позволяет
менять масштаб, вид страницы.
Лента
В
Эксель 2007 меню отображается в виде
ленты так, что это расположение
пиктограмм и команд удобно для
пользователя. В ранних версиях меню
оформлено в виде панелей инструментов
и строки. Юзер создавал рабочую область
по своему усмотрению, иногда она
становилась слишком громоздкой.
Ориентироваться
в ленте просто: кликнув на вкладку,
пользователь замечает доступные команды.
На каждой вкладке пиктограммы разделены
на блоки.
Если
в нижней части блока отображается
стрелка, то при нажатии на значок
пользователь вызывает диалоговое окно.
Здесь отображается расширенная версия
пунктов меню.
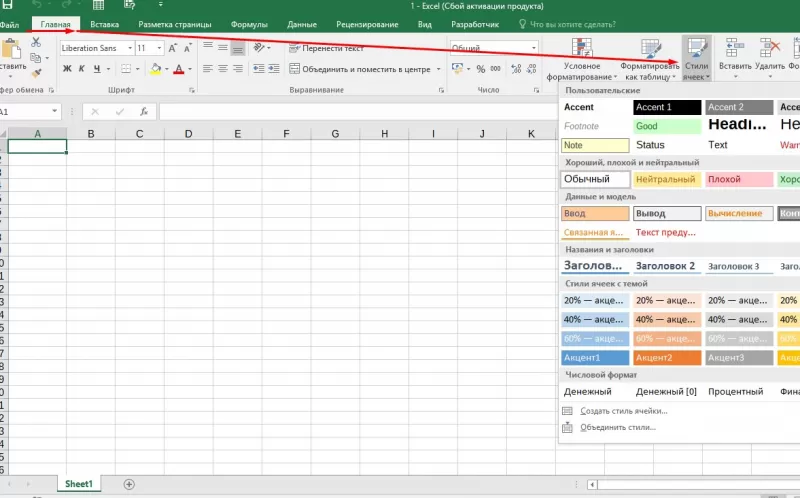
Нововведение
в Excel – наличие галереи.
Оформлена она в виде графического меню,
в котором содержатся образцы (на вкладке
«Главная» – «Стили ячеек»).
Панель
быстрого доступа
При
работе с MS Excel следует изучить: что
это за приложение, как им пользоваться
для автоматизации работы. Для увеличения
работоспособности юзер настраивает
панель быстрого доступа.
Она
находится справа от кнопки «Office».
Пользователь вправе добавить пиктограммы
команд, которые чаще всего используются.
По умолчанию офисный пакет располагает
на панели 3 пиктограммы: «Сохранить»,
«Назад» и «Вернуть». Справа находится
стрелка, раскрывающая список дополнительных
команд.
Панель
быстрого доступа отображается всегда,
независимо от того, какая вкладка
активирована.
Работа
в Excel
Программа
Эксель – это приложение, разработанное
для вычислений (в первую очередь).
Позволяет производить арифметические
действия с внесенной числовой информацией.
Если пользователю нужна таблица для
отображения текста, проще создать объект
в MS Word.
 |
|
A simple bar graph being created in Excel, running on Windows 11 |
|
| Developer(s) | Microsoft |
|---|---|
| Initial release | November 19, 1987; 35 years ago |
| Stable release |
2103 (16.0.13901.20400) |
| Written in | C++ (back-end)[2] |
| Operating system | Microsoft Windows |
| Type | Spreadsheet |
| License | Trialware[3] |
| Website | microsoft.com/en-us/microsoft-365/excel |
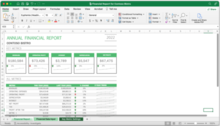
Excel for Mac (version 16.67), running on macOS Big Sur 11.5.2 |
|
| Developer(s) | Microsoft |
|---|---|
| Initial release | September 30, 1985; 37 years ago |
| Stable release |
16.70 (Build 23021201) |
| Written in | C++ (back-end), Objective-C (API/UI)[2] |
| Operating system | macOS |
| Type | Spreadsheet |
| License | Proprietary commercial software |
| Website | products.office.com/mac |
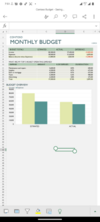
Excel for Android running on Android 13 |
|
| Developer(s) | Microsoft Corporation |
|---|---|
| Stable release |
16.0.14729.20146 |
| Operating system | Android Oreo and later |
| Type | Spreadsheet |
| License | Proprietary commercial software |
| Website | products.office.com/en-us/excel |
| Developer(s) | Microsoft Corporation |
|---|---|
| Stable release |
2.70.1 |
| Operating system | iOS 15 or later iPadOS 15 or later |
| Type | Spreadsheet |
| License | Proprietary commercial software |
| Website | products.office.com/en-us/excel |
Microsoft Excel is a spreadsheet developed by Microsoft for Windows, macOS, Android, iOS and iPadOS. It features calculation or computation capabilities, graphing tools, pivot tables, and a macro programming language called Visual Basic for Applications (VBA). Excel forms part of the Microsoft 365 suite of software.
Features
Basic operation
Microsoft Excel has the basic features of all spreadsheets,[7] using a grid of cells arranged in numbered rows and letter-named columns to organize data manipulations like arithmetic operations. It has a battery of supplied functions to answer statistical, engineering, and financial needs. In addition, it can display data as line graphs, histograms and charts, and with a very limited three-dimensional graphical display. It allows sectioning of data to view its dependencies on various factors for different perspectives (using pivot tables and the scenario manager).[8] A PivotTable is a tool for data analysis. It does this by simplifying large data sets via PivotTable fields. It has a programming aspect, Visual Basic for Applications, allowing the user to employ a wide variety of numerical methods, for example, for solving differential equations of mathematical physics,[9][10] and then reporting the results back to the spreadsheet. It also has a variety of interactive features allowing user interfaces that can completely hide the spreadsheet from the user, so the spreadsheet presents itself as a so-called application, or decision support system (DSS), via a custom-designed user interface, for example, a stock analyzer,[11] or in general, as a design tool that asks the user questions and provides answers and reports.[12][13] In a more elaborate realization, an Excel application can automatically poll external databases and measuring instruments using an update schedule,[14] analyze the results, make a Word report or PowerPoint slide show, and e-mail these presentations on a regular basis to a list of participants. Excel was not designed to be used as a database.[citation needed]
Microsoft allows for a number of optional command-line switches to control the manner in which Excel starts.[15]
Functions
Excel 2016 has 484 functions.[16] Of these, 360 existed prior to Excel 2010. Microsoft classifies these functions in 14 categories. Of the 484 current functions, 386 may be called from VBA as methods of the object «WorksheetFunction»[17] and 44 have the same names as VBA functions.[18]
With the introduction of LAMBDA, Excel will become Turing complete.[19]
Macro programming
VBA programming
Use of a user-defined function sq(x) in Microsoft Excel. The named variables x & y are identified in the Name Manager. The function sq is introduced using the Visual Basic editor supplied with Excel.
Subroutine in Excel calculates the square of named column variable x read from the spreadsheet, and writes it into the named column variable y.
The Windows version of Excel supports programming through Microsoft’s Visual Basic for Applications (VBA), which is a dialect of Visual Basic. Programming with VBA allows spreadsheet manipulation that is awkward or impossible with standard spreadsheet techniques. Programmers may write code directly using the Visual Basic Editor (VBE), which includes a window for writing code, debugging code, and code module organization environment. The user can implement numerical methods as well as automating tasks such as formatting or data organization in VBA[20] and guide the calculation using any desired intermediate results reported back to the spreadsheet.
VBA was removed from Mac Excel 2008, as the developers did not believe that a timely release would allow porting the VBA engine natively to Mac OS X. VBA was restored in the next version, Mac Excel 2011,[21] although the build lacks support for ActiveX objects, impacting some high level developer tools.[22]
A common and easy way to generate VBA code is by using the Macro Recorder.[23] The Macro Recorder records actions of the user and generates VBA code in the form of a macro. These actions can then be repeated automatically by running the macro. The macros can also be linked to different trigger types like keyboard shortcuts, a command button or a graphic. The actions in the macro can be executed from these trigger types or from the generic toolbar options. The VBA code of the macro can also be edited in the VBE. Certain features such as loop functions and screen prompt by their own properties, and some graphical display items, cannot be recorded but must be entered into the VBA module directly by the programmer. Advanced users can employ user prompts to create an interactive program, or react to events such as sheets being loaded or changed.
Macro Recorded code may not be compatible with Excel versions. Some code that is used in Excel 2010 cannot be used in Excel 2003. Making a Macro that changes the cell colors and making changes to other aspects of cells may not be backward compatible.
VBA code interacts with the spreadsheet through the Excel Object Model,[24] a vocabulary identifying spreadsheet objects, and a set of supplied functions or methods that enable reading and writing to the spreadsheet and interaction with its users (for example, through custom toolbars or command bars and message boxes). User-created VBA subroutines execute these actions and operate like macros generated using the macro recorder, but are more flexible and efficient.
History
From its first version Excel supported end-user programming of macros (automation of repetitive tasks) and user-defined functions (extension of Excel’s built-in function library). In early versions of Excel, these programs were written in a macro language whose statements had formula syntax and resided in the cells of special-purpose macro sheets (stored with file extension .XLM in Windows.) XLM was the default macro language for Excel through Excel 4.0.[25] Beginning with version 5.0 Excel recorded macros in VBA by default but with version 5.0 XLM recording was still allowed as an option. After version 5.0 that option was discontinued. All versions of Excel, including Excel 2021 are capable of running an XLM macro, though Microsoft discourages their use.[26]
Charts
Graph made using Microsoft Excel
Excel supports charts, graphs, or histograms generated from specified groups of cells. It also supports Pivot Charts that allow for a chart to be linked directly to a Pivot table. This allows the chart to be refreshed with the Pivot Table. The generated graphic component can either be embedded within the current sheet or added as a separate object.
These displays are dynamically updated if the content of cells changes. For example, suppose that the important design requirements are displayed visually; then, in response to a user’s change in trial values for parameters, the curves describing the design change shape, and their points of intersection shift, assisting the selection of the best design.
Add-ins
Additional features are available using add-ins. Several are provided with Excel, including:
- Analysis ToolPak: Provides data analysis tools for statistical and engineering analysis (includes analysis of variance and regression analysis)
- Analysis ToolPak VBA: VBA functions for Analysis ToolPak
- Euro Currency Tools: Conversion and formatting for euro currency
- Solver Add-In: Tools for optimization and equation solving
Data storage and communication
Number of rows and columns
Versions of Excel up to 7.0 had a limitation in the size of their data sets of 16K (214 = 16384) rows. Versions 8.0 through 11.0 could handle 64K (216 = 65536) rows and 256 columns (28 as label ‘IV’). Version 12.0 onwards, including the current Version 16.x, can handle over 1M (220 = 1048576) rows, and 16384 (214, labeled as column ‘XFD’) columns.[27]
File formats
| Filename extension |
.xls, (.xlsx, .xlsm, .xlsb — Excel 2007) |
|---|---|
| Internet media type |
application/vnd.ms-excel |
| Uniform Type Identifier (UTI) | com.microsoft.excel.xls |
| Developed by | Microsoft |
| Type of format | Spreadsheet |
Microsoft Excel up until 2007 version used a proprietary binary file format called Excel Binary File Format (.XLS) as its primary format.[28] Excel 2007 uses Office Open XML as its primary file format, an XML-based format that followed after a previous XML-based format called «XML Spreadsheet» («XMLSS»), first introduced in Excel 2002.[29]
Although supporting and encouraging the use of new XML-based formats as replacements, Excel 2007 remained backwards-compatible with the traditional, binary formats. In addition, most versions of Microsoft Excel can read CSV, DBF, SYLK, DIF, and other legacy formats. Support for some older file formats was removed in Excel 2007.[30] The file formats were mainly from DOS-based programs.
Binary
OpenOffice.org has created documentation of the Excel format. Two epochs of the format exist: the 97-2003 OLE format, and the older stream format.[31] Microsoft has made the Excel binary format specification available to freely download.[32]
XML Spreadsheet
The XML Spreadsheet format introduced in Excel 2002[29] is a simple, XML based format missing some more advanced features like storage of VBA macros. Though the intended file extension for this format is .xml, the program also correctly handles XML files with .xls extension. This feature is widely used by third-party applications (e.g. MySQL Query Browser) to offer «export to Excel» capabilities without implementing binary file format. The following example will be correctly opened by Excel if saved either as Book1.xml or Book1.xls:
<?xml version="1.0"?>
<Workbook xmlns="urn:schemas-microsoft-com:office:spreadsheet"
 xmlns:o="urn:schemas-microsoft-com:office:office"
 xmlns:x="urn:schemas-microsoft-com:office:excel"
 xmlns:ss="urn:schemas-microsoft-com:office:spreadsheet"
 xmlns:html="http://www.w3.org/TR/REC-html40">
 <Worksheet ss:Name="Sheet1">
  <Table ss:ExpandedColumnCount="2" ss:ExpandedRowCount="2" x:FullColumns="1" x:FullRows="1">
   <Row>
    <Cell><Data ss:Type="String">Name</Data></Cell>
    <Cell><Data ss:Type="String">Example</Data></Cell>
   </Row>
   <Row>
    <Cell><Data ss:Type="String">Value</Data></Cell>
    <Cell><Data ss:Type="Number">123</Data></Cell>
   </Row>
  </Table>
 </Worksheet>
</Workbook>
Current file extensions
Microsoft Excel 2007, along with the other products in the Microsoft Office 2007 suite, introduced new file formats. The first of these (.xlsx) is defined in the Office Open XML (OOXML) specification.
| Format | Extension | Description |
|---|---|---|
| Excel Workbook | .xlsx
|
The default Excel 2007 and later workbook format. In reality, a ZIP compressed archive with a directory structure of XML text documents. Functions as the primary replacement for the former binary .xls format, although it does not support Excel macros for security reasons. Saving as .xlsx offers file size reduction over .xls[33] |
| Excel Macro-enabled Workbook | .xlsm
|
As Excel Workbook, but with macro support. |
| Excel Binary Workbook | .xlsb
|
As Excel Macro-enabled Workbook, but storing information in binary form rather than XML documents for opening and saving documents more quickly and efficiently. Intended especially for very large documents with tens of thousands of rows, and/or several hundreds of columns. This format is very useful for shrinking large Excel files as is often the case when doing data analysis. |
| Excel Macro-enabled Template | .xltm
|
A template document that forms a basis for actual workbooks, with macro support. The replacement for the old .xlt format. |
| Excel Add-in | .xlam
|
Excel add-in to add extra functionality and tools. Inherent macro support because of the file purpose. |
Old file extensions
| Format | Extension | Description |
|---|---|---|
| Spreadsheet | .xls
|
Main spreadsheet format which holds data in worksheets, charts, and macros |
| Add-in (VBA) | .xla
|
Adds custom functionality; written in VBA |
| Toolbar | .xlb
|
The file extension where Microsoft Excel custom toolbar settings are stored. |
| Chart | .xlc
|
A chart created with data from a Microsoft Excel spreadsheet that only saves the chart. To save the chart and spreadsheet save as .XLS. XLC is not supported in Excel 2007 or in any newer versions of Excel. |
| Dialog | .xld
|
Used in older versions of Excel. |
| Archive | .xlk
|
A backup of an Excel Spreadsheet |
| Add-in (DLL) | .xll
|
Adds custom functionality; written in C++/C, Fortran, etc. and compiled in to a special dynamic-link library |
| Macro | .xlm
|
A macro is created by the user or pre-installed with Excel. |
| Template | .xlt
|
A pre-formatted spreadsheet created by the user or by Microsoft Excel. |
| Module | .xlv
|
A module is written in VBA (Visual Basic for Applications) for Microsoft Excel |
| Library | .DLL
|
Code written in VBA may access functions in a DLL, typically this is used to access the Windows API |
| Workspace | .xlw
|
Arrangement of the windows of multiple Workbooks |
Using other Windows applications
Windows applications such as Microsoft Access and Microsoft Word, as well as Excel can communicate with each other and use each other’s capabilities. The most common are Dynamic Data Exchange: although strongly deprecated by Microsoft, this is a common method to send data between applications running on Windows, with official MS publications referring to it as «the protocol from hell».[34] As the name suggests, it allows applications to supply data to others for calculation and display. It is very common in financial markets, being used to connect to important financial data services such as Bloomberg and Reuters.
OLE Object Linking and Embedding allows a Windows application to control another to enable it to format or calculate data. This may take on the form of «embedding» where an application uses another to handle a task that it is more suited to, for example a PowerPoint presentation may be embedded in an Excel spreadsheet or vice versa.[35][36][37][38]
Using external data
Excel users can access external data sources via Microsoft Office features such as (for example) .odc connections built with the Office Data Connection file format. Excel files themselves may be updated using a Microsoft supplied ODBC driver.
Excel can accept data in real-time through several programming interfaces, which allow it to communicate with many data sources such as Bloomberg and Reuters (through addins such as Power Plus Pro).
- DDE: «Dynamic Data Exchange» uses the message passing mechanism in Windows to allow data to flow between Excel and other applications. Although it is easy for users to create such links, programming such links reliably is so difficult that Microsoft, the creators of the system, officially refer to it as «the protocol from hell».[34] In spite of its many issues DDE remains the most common way for data to reach traders in financial markets.
- Network DDE Extended the protocol to allow spreadsheets on different computers to exchange data. Starting with Windows Vista, Microsoft no longer supports the facility.[39]
- Real Time Data: RTD although in many ways technically superior to DDE, has been slow to gain acceptance, since it requires non-trivial programming skills, and when first released was neither adequately documented nor supported by the major data vendors.[40][41]
Alternatively, Microsoft Query provides ODBC-based browsing within Microsoft Excel.[42][43][44]
Export and migration of spreadsheets
Programmers have produced APIs to open Excel spreadsheets in a variety of applications and environments other than Microsoft Excel. These include opening Excel documents on the web using either ActiveX controls, or plugins like the Adobe Flash Player. The Apache POI opensource project provides Java libraries for reading and writing Excel spreadsheet files.
Password protection
Microsoft Excel protection offers several types of passwords:
- Password to open a document[45]
- Password to modify a document[46]
- Password to unprotect the worksheet
- Password to protect workbook
- Password to protect the sharing workbook[47]
All passwords except password to open a document can be removed instantly regardless of the Microsoft Excel version used to create the document. These types of passwords are used primarily for shared work on a document. Such password-protected documents are not encrypted, and a data sources from a set password is saved in a document’s header. Password to protect workbook is an exception – when it is set, a document is encrypted with the standard password «VelvetSweatshop», but since it is known to the public, it actually does not add any extra protection to the document. The only type of password that can prevent a trespasser from gaining access to a document is password to open a document. The cryptographic strength of this kind of protection depends strongly on the Microsoft Excel version that was used to create the document.
In Microsoft Excel 95 and earlier versions, the password to open is converted to a 16-bit key that can be instantly cracked. In Excel 97/2000 the password is converted to a 40-bit key, which can also be cracked very quickly using modern equipment. As regards services that use rainbow tables (e.g. Password-Find), it takes up to several seconds to remove protection. In addition, password-cracking programs can brute-force attack passwords at a rate of hundreds of thousands of passwords a second, which not only lets them decrypt a document but also find the original password.
In Excel 2003/XP the encryption is slightly better – a user can choose any encryption algorithm that is available in the system (see Cryptographic Service Provider). Due to the CSP, an Excel file cannot be decrypted, and thus the password to open cannot be removed, though the brute-force attack speed remains quite high. Nevertheless, the older Excel 97/2000 algorithm is set by the default. Therefore, users who do not change the default settings lack reliable protection of their documents.
The situation changed fundamentally in Excel 2007, where the modern AES algorithm with a key of 128 bits started being used for decryption, and a 50,000-fold use of the hash function SHA1 reduced the speed of brute-force attacks down to hundreds of passwords per second. In Excel 2010, the strength of the protection by the default was increased two times due to the use of a 100,000-fold SHA1 to convert a password to a key.
Other platforms
Excel for mobile
Excel Mobile is a spreadsheet program that can edit XLSX files. It can edit and format text in cells, calculate formulas, search within the spreadsheet, sort rows and columns, freeze panes, filter the columns, add comments, and create charts. It cannot add columns or rows except at the edge of the document, rearrange columns or rows, delete rows or columns, or add spreadsheet tabs.[48][49][50][51][52][53] The 2007 version has the ability to use a full-screen mode to deal with limited screen resolution, as well as split panes to view different parts of a worksheet at one time.[51] Protection settings, zoom settings, autofilter settings, certain chart formatting, hidden sheets, and other features are not supported on Excel Mobile, and will be modified upon opening and saving a workbook.[52] In 2015, Excel Mobile became available for Windows 10 and Windows 10 Mobile on Windows Store.[54][55]
Excel for the web
Excel for the web is a free lightweight version of Microsoft Excel available as part of Office on the web, which also includes web versions of Microsoft Word and Microsoft PowerPoint.
Excel for the web can display most of the features available in the desktop versions of Excel, although it may not be able to insert or edit them. Certain data connections are not accessible on Excel for the web, including with charts that may use these external connections. Excel for the web also cannot display legacy features, such as Excel 4.0 macros or Excel 5.0 dialog sheets. There are also small differences between how some of the Excel functions work.[56]
Microsoft Excel Viewer
Microsoft Excel Viewer was a freeware program for Microsoft Windows for viewing and printing spreadsheet documents created by Excel.[57] Microsoft retired the viewer in April 2018 with the last security update released in February 2019 for Excel Viewer 2007 (SP3).[58][59]
The first version released by Microsoft was Excel 97 Viewer.[60][61] Excel 97 Viewer was supported in Windows CE for Handheld PCs.[62] In October 2004, Microsoft released Excel Viewer 2003.[63] In September 2007, Microsoft released Excel Viewer 2003 Service Pack 3 (SP3).[64] In January 2008, Microsoft released Excel Viewer 2007 (featuring a non-collapsible Ribbon interface).[65] In April 2009, Microsoft released Excel Viewer 2007 Service Pack 2 (SP2).[66] In October 2011, Microsoft released Excel Viewer 2007 Service Pack 3 (SP3).[67]
Microsoft advises to view and print Excel files for free to use the Excel Mobile application for Windows 10 and for Windows 7 and Windows 8 to upload the file to OneDrive and use Excel for the web with a Microsoft account to open them in a browser.[58][68]
Quirks
In addition to issues with spreadsheets in general, other problems specific to Excel include numeric precision, misleading statistics functions, mod function errors, date limitations and more.
Numeric precision
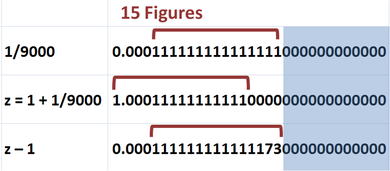
Excel maintains 15 figures in its numbers, but they are not always accurate: the bottom line should be the same as the top line.
Despite the use of 15-figure precision, Excel can display many more figures (up to thirty) upon user request. But the displayed figures are not those actually used in its computations, and so, for example, the difference of two numbers may differ from the difference of their displayed values. Although such departures are usually beyond the 15th decimal, exceptions do occur, especially for very large or very small numbers. Serious errors can occur if decisions are made based upon automated comparisons of numbers (for example, using the Excel If function), as equality of two numbers can be unpredictable.[citation needed]
In the figure, the fraction 1/9000 is displayed in Excel. Although this number has a decimal representation that is an infinite string of ones, Excel displays only the leading 15 figures. In the second line, the number one is added to the fraction, and again Excel displays only 15 figures. In the third line, one is subtracted from the sum using Excel. Because the sum in the second line has only eleven 1’s after the decimal, the difference when 1 is subtracted from this displayed value is three 0’s followed by a string of eleven 1’s. However, the difference reported by Excel in the third line is three 0’s followed by a string of thirteen 1’s and two extra erroneous digits. This is because Excel calculates with about half a digit more than it displays.
Excel works with a modified 1985 version of the IEEE 754 specification.[69] Excel’s implementation involves conversions between binary and decimal representations, leading to accuracy that is on average better than one would expect from simple fifteen digit precision, but that can be worse. See the main article for details.
Besides accuracy in user computations, the question of accuracy in Excel-provided functions may be raised. Particularly in the arena of statistical functions, Excel has been criticized for sacrificing accuracy for speed of calculation.[70][71]
As many calculations in Excel are executed using VBA, an additional issue is the accuracy of VBA, which varies with variable type and user-requested precision.[72]
Statistical functions
The accuracy and convenience of statistical tools in Excel has been criticized,[73][74][75][76][77] as mishandling missing data, as returning incorrect values due to inept handling of round-off and large numbers, as only selectively updating calculations on a spreadsheet when some cell values are changed, and as having a limited set of statistical tools. Microsoft has announced some of these issues are addressed in Excel 2010.[78]
Excel MOD function error
Excel has issues with modulo operations. In the case of excessively large results, Excel will return the error warning #NUM! instead of an answer.[79]
Fictional leap day in the year 1900
Excel includes February 29, 1900, incorrectly treating 1900 as a leap year, even though e.g. 2100 is correctly treated as a non-leap year.[80][81] The bug originated from Lotus 1-2-3 (deliberately implemented to save computer memory), and was also purposely implemented in Excel, for the purpose of bug compatibility.[82] This legacy has later been carried over into Office Open XML file format.[83]
Thus a (not necessarily whole) number greater than or equal to 61 interpreted as a date and time are the (real) number of days after December 30, 1899, 0:00, a non-negative number less than 60 is the number of days after December 31, 1899, 0:00, and numbers with whole part 60 represent the fictional day.
Date range
Excel supports dates with years in the range 1900–9999, except that December 31, 1899, can be entered as 0 and is displayed as 0-jan-1900.
Converting a fraction of a day into hours, minutes and days by treating it as a moment on the day January 1, 1900, does not work for a negative fraction.[84]
Conversion problems
Entering text that happens to be in a form that is interpreted as a date, the text can be unintentionally changed to a standard date format. A similar problem occurs when a text happens to be in the form of a floating-point notation of a number. In these cases the original exact text cannot be recovered from the result. Formatting the cell as TEXT before entering ambiguous text prevents Excel from converting to a date.
This issue has caused a well known problem in the analysis of DNA, for example in bioinformatics. As first reported in 2004,[85] genetic scientists found that Excel automatically and incorrectly converts certain gene names into dates. A follow-up study in 2016 found many peer reviewed scientific journal papers had been affected and that «Of the selected journals, the proportion of published articles with Excel files containing gene lists that are affected by gene name errors is 19.6 %.»[86] Excel parses the copied and pasted data and sometimes changes them depending on what it thinks they are. For example, MARCH1 (Membrane Associated Ring-CH-type finger 1) gets converted to the date March 1 (1-Mar) and SEPT2 (Septin 2) is converted into September 2 (2-Sep) etc.[87] While some secondary news sources[88] reported this as a fault with Excel, the original authors of the 2016 paper placed the blame with the researchers misusing Excel.[86][89]
In August 2020 the HUGO Gene Nomenclature Committee (HGNC) published new guidelines in the journal Nature regarding gene naming in order to avoid issues with «symbols that affect data handling and retrieval.» So far 27 genes have been renamed, including changing MARCH1 to MARCHF1 and SEPT1 to SEPTIN1 in order to avoid accidental conversion of the gene names into dates.[90]
Errors with large strings
The following functions return incorrect results when passed a string longer than 255 characters:[91]
type()incorrectly returns 16, meaning «Error value»IsText(), when called as a method of the VBA objectWorksheetFunction(i.e.,WorksheetFunction.IsText()in VBA), incorrectly returns «false».
Filenames
Microsoft Excel will not open two documents with the same name and instead will display the following error:
- A document with the name ‘%s’ is already open. You cannot open two documents with the same name, even if the documents are in different folders. To open the second document, either close the document that is currently open, or rename one of the documents.[92]
The reason is for calculation ambiguity with linked cells. If there is a cell ='[Book1.xlsx]Sheet1'!$G$33, and there are two books named «Book1» open, there is no way to tell which one the user means.[93]
Versions
Early history
Microsoft originally marketed a spreadsheet program called Multiplan in 1982. Multiplan became very popular on CP/M systems, but on MS-DOS systems it lost popularity to Lotus 1-2-3. Microsoft released the first version of Excel for the Macintosh on September 30, 1985, and the first Windows version was 2.05 (to synchronize with the Macintosh version 2.2) on November 19, 1987.[94][95] Lotus was slow to bring 1-2-3 to Windows and by the early 1990s, Excel had started to outsell 1-2-3 and helped Microsoft achieve its position as a leading PC software developer. This accomplishment solidified Microsoft as a valid competitor and showed its future of developing GUI software. Microsoft maintained its advantage with regular new releases, every two years or so.
Microsoft Windows
Excel 2.0 is the first version of Excel for the Intel platform. Versions prior to 2.0 were only available on the Apple Macintosh.
Excel 2.0 (1987)
The first Windows version was labeled «2» to correspond to the Mac version. It was announced on October 6, 1987, and released on November 19.[96] This included a run-time version of Windows.[97]
BYTE in 1989 listed Excel for Windows as among the «Distinction» winners of the BYTE Awards. The magazine stated that the port of the «extraordinary» Macintosh version «shines», with a user interface as good as or better than the original.
Excel 3.0 (1990)
Included toolbars, drawing capabilities, outlining, add-in support, 3D charts, and many more new features.[97]
Excel 4.0 (1992)
Introduced auto-fill.[98]
Also, an easter egg in Excel 4.0 reveals a hidden animation of a dancing set of numbers 1 through 3, representing Lotus 1-2-3, which is then crushed by an Excel logo.[99]
Excel 5.0 (1993)
With version 5.0, Excel has included Visual Basic for Applications (VBA), a programming language based on Visual Basic which adds the ability to automate tasks in Excel and to provide user-defined functions (UDF) for use in worksheets. VBA includes a fully featured integrated development environment (IDE). Macro recording can produce VBA code replicating user actions, thus allowing simple automation of regular tasks. VBA allows the creation of forms and in‑worksheet controls to communicate with the user. The language supports use (but not creation) of ActiveX (COM) DLL’s; later versions add support for class modules allowing the use of basic object-oriented programming techniques.
The automation functionality provided by VBA made Excel a target for macro viruses. This caused serious problems until antivirus products began to detect these viruses. Microsoft belatedly took steps to prevent the misuse by adding the ability to disable macros completely, to enable macros when opening a workbook or to trust all macros signed using a trusted certificate.
Versions 5.0 to 9.0 of Excel contain various Easter eggs, including a «Hall of Tortured Souls», a Doom-like minigame, although since version 10 Microsoft has taken measures to eliminate such undocumented features from their products.[100]
5.0 was released in a 16-bit x86 version for Windows 3.1 and later in a 32-bit version for NT 3.51 (x86/Alpha/PowerPC)
Excel 95 (v7.0)
Released in 1995 with Microsoft Office for Windows 95, this is the first major version after Excel 5.0, as there is no Excel 6.0 with all of the Office applications standardizing on the same major version number.
Internal rewrite to 32-bits. Almost no external changes, but faster and more stable.
Excel 95 contained a hidden Doom-like mini-game called «The Hall of Tortured Souls», a series of rooms featuring the names and faces of the developers as an easter egg.[101]
Excel 97 (v8.0)
Included in Office 97 (for x86 and Alpha). This was a major upgrade that introduced the paper clip office assistant and featured standard VBA used instead of internal Excel Basic. It introduced the now-removed Natural Language labels.
This version of Excel includes a flight simulator as an Easter Egg.
Excel 2000 (v9.0)
Included in Office 2000. This was a minor upgrade but introduced an upgrade to the clipboard where it can hold multiple objects at once. The Office Assistant, whose frequent unsolicited appearance in Excel 97 had annoyed many users, became less intrusive.
A small 3-D game called «Dev Hunter» (inspired by Spy Hunter) was included as an easter egg.[102][103]
Excel 2002 (v10.0)
Included in Office XP. Very minor enhancements.
Excel 2003 (v11.0)
Included in Office 2003. Minor enhancements.
Excel 2007 (v12.0)
Included in Office 2007. This release was a major upgrade from the previous version. Similar to other updated Office products, Excel in 2007 used the new Ribbon menu system. This was different from what users were used to, and was met with mixed reactions. One study reported fairly good acceptance by users except highly experienced users and users of word processing applications with a classical WIMP interface, but was less convinced in terms of efficiency and organization.[104] However, an online survey reported that a majority of respondents had a negative opinion of the change, with advanced users being «somewhat more negative» than intermediate users, and users reporting a self-estimated reduction in productivity.
Added functionality included Tables,[105] and the SmartArt set of editable business diagrams. Also added was an improved management of named variables through the Name Manager, and much-improved flexibility in formatting graphs, which allow (x, y) coordinate labeling and lines of arbitrary weight. Several improvements to pivot tables were introduced.
Also like other office products, the Office Open XML file formats were introduced, including .xlsm for a workbook with macros and .xlsx for a workbook without macros.[106]
Specifically, many of the size limitations of previous versions were greatly increased. To illustrate, the number of rows was now 1,048,576 (220) and columns was 16,384 (214; the far-right column is XFD). This changes what is a valid A1 reference versus a named range. This version made more extensive use of multiple cores for the calculation of spreadsheets; however, VBA macros are not handled in parallel and XLL add‑ins were only executed in parallel if they were thread-safe and this was indicated at registration.
Excel 2010 (v14.0)
Microsoft Excel 2010 running on Windows 7
Included in Office 2010, this is the next major version after v12.0, as version number 13 was skipped.
Minor enhancements and 64-bit support,[107] including the following:
- Multi-threading recalculation (MTR) for commonly used functions
- Improved pivot tables
- More conditional formatting options
- Additional image editing capabilities
- In-cell charts called sparklines
- Ability to preview before pasting
- Office 2010 backstage feature for document-related tasks
- Ability to customize the Ribbon
- Many new formulas, most highly specialized to improve accuracy[108]
Excel 2013 (v15.0)
Included in Office 2013, along with a lot of new tools included in this release:
- Improved Multi-threading and Memory Contention
- FlashFill[109]
- Power View[110]
- Power Pivot[111]
- Timeline Slicer
- Windows App
- Inquire[112]
- 50 new functions[113]
Excel 2016 (v16.0)
Included in Office 2016, along with a lot of new tools included in this release:
- Power Query integration
- Read-only mode for Excel
- Keyboard access for Pivot Tables and Slicers in Excel
- New Chart Types
- Quick data linking in Visio
- Excel forecasting functions
- Support for multiselection of Slicer items using touch
- Time grouping and Pivot Chart Drill Down
- Excel data cards[114]
Excel 2019, Excel 2021, Office 365 and subsequent (v16.0)
Microsoft no longer releases Office or Excel in discrete versions. Instead, features are introduced automatically over time using Windows Update. The version number remains 16.0. Thereafter only the approximate dates when features appear can now be given.
- Dynamic Arrays. These are essentially Array Formulas but they «Spill» automatically into neighboring cells and does not need the ctrl-shift-enter to create them. Further, dynamic arrays are the default format, with new «@» and «#» operators to provide compatibility with previous versions. This is perhaps the biggest structural change since 2007, and is in response to a similar feature in Google Sheets. Dynamic arrays started appearing in pre-releases about 2018, and as of March 2020 are available in published versions of Office 365 provided a user selected «Office Insiders».
Apple Macintosh
Microsoft Excel for Mac 2011
- 1985 Excel 1.0
- 1988 Excel 1.5
- 1989 Excel 2.2
- 1990 Excel 3.0
- 1992 Excel 4.0
- 1993 Excel 5.0 (part of Office 4.x—Final Motorola 680×0 version[115] and first PowerPC version)
- 1998 Excel 8.0 (part of Office 98)
- 2000 Excel 9.0 (part of Office 2001)
- 2001 Excel 10.0 (part of Office v. X)
- 2004 Excel 11.0 (part of Office 2004)
- 2008 Excel 12.0 (part of Office 2008)
- 2010 Excel 14.0 (part of Office 2011)
- 2015 Excel 15.0 (part of Office 2016—Office 2016 for Mac brings the Mac version much closer to parity with its Windows cousin, harmonizing many of the reporting and high-level developer functions, while bringing the ribbon and styling into line with its PC counterpart.)[116]
OS/2
- 1989 Excel 2.2
- 1990 Excel 2.3
- 1991 Excel 3.0
Summary
| Legend: | Old version, not maintained | Older version, still maintained | Current stable version |
|---|
| Year | Name | Version | Comments |
|---|---|---|---|
| 1987 | Excel 2 | 2.0 | Renumbered to 2 to correspond with contemporary Macintosh version. Supported macros (later known as Excel 4 macros). |
| 1990 | Excel 3 | 3.0 | Added 3D graphing capabilities |
| 1992 | Excel 4 | 4.0 | Introduced auto-fill feature |
| 1993 | Excel 5 | 5.0 | Included Visual Basic for Applications (VBA) and various object-oriented options |
| 1995 | Excel 95 | 7.0 | Renumbered for contemporary Word version. Both programs were packaged in Microsoft Office by this time. |
| 1997 | Excel 97 | 8.0 | |
| 2000 | Excel 2000 | 9.0 | Part of Microsoft Office 2000, which was itself part of Windows Millennium (also known as «Windows ME»). |
| 2002 | Excel 2002 | 10.0 | |
| 2003 | Excel 2003 | 11.0 | Released only 1 year later to correspond better with the rest of Microsoft Office (Word, PowerPoint, etc.). |
| 2007 | Excel 2007 | 12.0 | |
| 2010 | Excel 2010 | 14.0 | Due to superstitions surrounding the number 13, Excel 13 was skipped in version counting. |
| 2013 | Excel 2013 | 15.0 | Introduced 50 more mathematical functions (available as pre-packaged commands, rather than typing the formula manually). |
| 2016 | Excel 2016 | 16.0 | Part of Microsoft Office 2016 |
| Year | Name | Version | Comments |
|---|---|---|---|
| 1985 | Excel 1 | 1.0 | Initial version of Excel. Supported macros (later known as Excel 4 macros). |
| 1988 | Excel 1.5 | 1.5 | |
| 1989 | Excel 2 | 2.2 | |
| 1990 | Excel 3 | 3.0 | |
| 1992 | Excel 4 | 4.0 | |
| 1993 | Excel 5 | 5.0 | Only available on PowerPC-based Macs. First PowerPC version. |
| 1998 | Excel 98 | 8.0 | Excel 6 and Excel 7 were skipped to correspond with the rest of Microsoft Office at the time. |
| 2000 | Excel 2000 | 9.0 | |
| 2001 | Excel 2001 | 10.0 | |
| 2004 | Excel 2004 | 11.0 | |
| 2008 | Excel 2008 | 12.0 | |
| 2011 | Excel 2011 | 14.0 | As with the Windows version, version 13 was skipped for superstitious reasons. |
| 2016 | Excel 2016 | 16.0 | As with the rest of Microsoft Office, so it is for Excel: Future release dates for the Macintosh version are intended to correspond better to those for the Windows version, from 2016 onward. |
| Year | Name | Version | Comments |
|---|---|---|---|
| 1989 | Excel 2.2 | 2.2 | Numbered in between Windows versions at the time |
| 1990 | Excel 2.3 | 2.3 | |
| 1991 | Excel 3 | 3.0 | Last OS/2 version. Discontinued subseries of Microsoft Excel, which is otherwise still an actively developed program. |
Impact
Excel offers many user interface tweaks over the earliest electronic spreadsheets; however, the essence remains the same as in the original spreadsheet software, VisiCalc: the program displays cells organized in rows and columns, and each cell may contain data or a formula, with relative or absolute references to other cells.
Excel 2.0 for Windows, which was modeled after its Mac GUI-based counterpart, indirectly expanded the installed base of the then-nascent Windows environment. Excel 2.0 was released a month before Windows 2.0, and the installed base of Windows was so low at that point in 1987 that Microsoft had to bundle a runtime version of Windows 1.0 with Excel 2.0.[117] Unlike Microsoft Word, there never was a DOS version of Excel.
Excel became the first spreadsheet to allow the user to define the appearance of spreadsheets (fonts, character attributes, and cell appearance). It also introduced intelligent cell re-computation, where only cells dependent on the cell being modified are updated (previous spreadsheet programs recomputed everything all the time or waited for a specific user command). Excel introduced auto-fill, the ability to drag and expand the selection box to automatically copy a cell or row contents to adjacent cells or rows, adjusting the copies intelligently by automatically incrementing cell references or contents. Excel also introduced extensive graphing capabilities.
Security
Because Excel is widely used, it has been attacked by hackers. While Excel is not directly exposed to the Internet, if an attacker can get a victim to open a file in Excel, and there is an appropriate security bug in Excel, then the attacker can gain control of the victim’s computer.[118] UK’s GCHQ has a tool named TORNADO ALLEY with this purpose.[119][120]
Games
Besides the easter eggs, numerous games have been created or recreated in Excel, such as Tetris, 2048, Scrabble, Yahtzee, Angry Birds, Pac-Man, Civilization, Monopoly, Battleship, Blackjack, Space Invaders, and others.[121][122][123][124][125]
In 2020, Excel became an esport with the advent of the Financial Modeling World Cup.[126]
See also
- Comparison of spreadsheet software
- Numbers (spreadsheet)—the iWork equivalent
- Spreadmart
- Financial Modeling World Cup, online esport financial modelling competition using Excel
References
- ^ «Update history for Microsoft Office 2019». Microsoft Docs. Retrieved April 13, 2021.
- ^ a b «C++ in MS Office». cppcon. July 17, 2014. Archived from the original on November 7, 2019. Retrieved June 25, 2019.
- ^ «Microsoft Office Excel 365». Microsoft.com. Retrieved January 25, 2021.
- ^ «Update history for Office for Mac». Microsoft Docs.
- ^ «Microsoft Excel APKs». APKMirror.
- ^ «Microsoft Excel». App Store.
- ^
Harvey, Greg (2006). Excel 2007 For Dummies (1st ed.). Wiley. ISBN 978-0-470-03737-9. - ^
Harvey, Greg (2007). Excel 2007 Workbook for Dummies (2nd ed.). Wiley. p. 296 ff. ISBN 978-0-470-16937-7. - ^
de Levie, Robert (2004). Advanced Excel for scientific data analysis. Oxford University Press. ISBN 978-0-19-515275-3. - ^
Bourg, David M. (2006). Excel scientific and engineering cookbook. O’Reilly. ISBN 978-0-596-00879-6. - ^
Şeref, Michelle M. H. & Ahuja, Ravindra K. (2008). «§4.2 A portfolio management and optimization spreadsheet DSS». In Burstein, Frad & Holsapple, Clyde W. (eds.). Handbook on Decision Support Systems 1: Basic Themes. Springer. ISBN 978-3-540-48712-8. - ^
Wells, Eric & Harshbarger, Steve (1997). Microsoft Excel 97 Developer’s Handbook. Microsoft Press. ISBN 978-1-57231-359-0. Excellent examples are developed that show just how applications can be designed. - ^
Harnett, Donald L. & Horrell, James F. (1998). Data, statistics, and decision models with Excel. Wiley. ISBN 978-0-471-13398-8. - ^
Some form of data acquisition hardware is required. See, for example, Austerlitz, Howard (2003). Data acquisition techniques using PCs (2nd ed.). Academic Press. p. 281 ff. ISBN 978-0-12-068377-2. - ^
«Description of the startup switches for Excel». Microsoft Help and Support. Microsoft Support. May 7, 2007. Retrieved December 14, 2010.Microsoft Excel accepts a number of optional switches that you can use to control how the program starts. This article lists the switches and provides a description of each switch.
{{cite web}}: CS1 maint: url-status (link) - ^ «Excel functions (alphabetical)». microsoft.com. Microsoft. Retrieved November 4, 2018.
{{cite web}}: CS1 maint: url-status (link) - ^ «WorksheetFunction Object (Excel)». Office VBA Reference. Microsoft. March 30, 2022. Retrieved November 4, 2018.
{{cite web}}: CS1 maint: url-status (link) - ^ «Functions (Visual Basic for Applications)». Office VBA Reference. Microsoft. September 13, 2021. Retrieved November 4, 2018.
{{cite web}}: CS1 maint: url-status (link) - ^ Gordon, Andy (January 25, 2021). «LAMBDA: The ultimate Excel worksheet function». microsoft.com. Microsoft. Retrieved April 23, 2021.
{{cite web}}: CS1 maint: url-status (link) - ^
For example, by converting to Visual Basic the recipes in Press, William H. Press; Teukolsky, Saul A.; Vetterling, William T. & Flannery, Brian P. (2007). Numerical recipes: the art of scientific computing (3rd ed.). Cambridge University Press. ISBN 978-0-521-88068-8. Code conversion to Basic from Fortran probably is easier than from C++, so the 2nd edition (ISBN 0521437210) may be easier to use, or the Basic code implementation of the first edition: Sprott, Julien C. (1991). Numerical recipes: routines and examples in BASIC. Cambridge University Press. ISBN 978-0-521-40689-5. - ^ «Excel». Office for Mac. OfficeforMacHelp.com. Archived from the original on June 19, 2012. Retrieved July 8, 2012.
- ^ «Using Excel — PC or Mac? | Excel Lemon». www.excellemon.com. Archived from the original on September 21, 2016. Retrieved July 29, 2015.
- ^ However an increasing proportion of Excel functionality is not captured by the Macro Recorder leading to largely useless macros. Compatibility among multiple versions of Excel is also a downfall of this method. A macro recorder in Excel 2010 may not work in Excel 2003 or older. This is most common when changing colors and formatting of cells.
Walkenbach, John (2007). «Chapter 6: Using the Excel macro recorder». Excel 2007 VBA Programming for Dummies (Revised by Jan Karel Pieterse ed.). Wiley. p. 79 ff. ISBN 978-0-470-04674-6. - ^ Walkenbach, John (February 2, 2007). «Chapter 4: Introducing the Excel object model». cited work. p. 53 ff. ISBN 978-0-470-04674-6.
- ^ «The Spreadsheet Page for Excel Users and Developers». spreadsheetpage.com. J-Walk & Associates, Inc. Retrieved December 19, 2012.
- ^ «Working with Excel 4.0 macros». microsoft.com. Microsoft Office Support. Retrieved December 19, 2012.
- ^ «The «Big Grid» and Increased Limits in Excel 2007″. microsoft.com. May 23, 2014. Retrieved April 10, 2008.
{{cite web}}: CS1 maint: url-status (link) - ^ «How to extract information from Office files by using Office file formats and schemas». microsoft.com. Microsoft. February 26, 2008. Retrieved November 10, 2008.
{{cite web}}: CS1 maint: url-status (link) - ^ a b «XML Spreadsheet Reference». Microsoft Excel 2002 Technical Articles. MSDN. August 2001. Retrieved November 10, 2008.
- ^ «Deprecated features for Excel 2007». Microsoft—David Gainer. August 24, 2006. Retrieved January 2, 2009.
- ^ «OpenOffice.org’s documentation of the Microsoft Excel File Format» (PDF). August 2, 2008.
- ^ «Microsoft Office Excel 97 — 2007 Binary File Format Specification (*.xls 97-2007 format)». Microsoft Corporation. 2007.
- ^ Fairhurst, Danielle Stein (March 17, 2015). Using Excel for Business Analysis: A Guide to Financial Modelling Fundamentals. John Wiley & Sons. ISBN 978-1-119-06245-5.
- ^ a b Newcomer, Joseph M. «Faking DDE with Private Servers». Dr. Dobb’s.
- ^ Schmalz, Michael (2006). «Chapter 5: Using Access VBA to automate Excel». Integrating Excel and Access. O’Reilly Media, Inc. ISBN 978-0-596-00973-1.Schmalz, Michael (2006). «Chapter 5: Using Access VBA to automate Excel». Integrating Excel and Access. O’Reilly Media, Inc. ISBN 978-0-596-00973-1.
- ^ Cornell, Paul (2007). «Chapter 5: Connect to other databases». Excel as Your Database. Apress. p. 117 ff. ISBN 978-1-59059-751-4.
- ^ DeMarco, Jim (2008). «Excel’s data import tools». Pro Excel 2007 VBA. Apress. p. 43 ff. ISBN 978-1-59059-957-0.
- ^
Harts, Doug (2007). «Importing Access data into Excel 2007». Microsoft Office 2007 Business Intelligence: Reporting, Analysis, and Measurement from the Desktop. McGraw-Hill Professional. ISBN 978-0-07-149424-3. - ^ «About Network DDE — Win32 apps». learn.microsoft.com.
- ^ «How to set up and use the RTD function in Excel — Office». learn.microsoft.com.
- ^
DeMarco, Jim (2008). Pro Excel 2007 VBA. Berkeley, CA: Apress. p. 225. ISBN 978-1-59059-957-0.External data is accessed through a connection file, such as an Office Data Connection (ODC) file (.odc)
- ^
Bullen, Stephen; Bovey, Rob & Green, John (2009). Professional Excel Development (2nd ed.). Upper Saddle River, NJ: Addison-Wesley. p. 665. ISBN 978-0-321-50879-9.To create a robust solution, we always have to include some VBA code …
- ^ William, Wehrs (2000). «An Applied DSS Course Using Excel and VBA: IS and/or MS?» (PDF). The Proceedings of ISECON (Information System Educator Conference). p. 4. Archived from the original (PDF) on August 21, 2010. Retrieved February 5, 2010.
Microsoft Query is a data retrieval tool (i.e. ODBC browser) that can be employed within Excel 97. It allows a user to create and save queries on external relational databases for which an ODBC driver is available.
- ^ Use Microsoft Query to retrieve external data Archived March 12, 2010, at the Wayback Machine
- ^ «Password protect documents, workbooks, and presentations — Word — Office.com». Office.microsoft.com. Retrieved April 24, 2013.
- ^ «Password protect documents, workbooks, and presentations — Word — Office.com». Office.microsoft.com. Retrieved April 24, 2013.
- ^ «Password protect worksheet or workbook elements — Excel — Office.com». Office.microsoft.com. Archived from the original on March 26, 2013. Retrieved April 24, 2013.
- ^ Ralph, Nate. «Office for Windows Phone 8: Your handy starter guide». TechHive. Archived from the original on October 15, 2014. Retrieved August 30, 2014.
- ^ Wollman, Dana. «Microsoft Office Mobile for iPhone hands-on». Engadget. Retrieved August 30, 2014.
- ^ Pogue, David. «Microsoft Adds Office for iPhone. Yawn». The New York Times. Retrieved August 30, 2014.
- ^ a b Ogasawara, Todd. «What’s New in Excel Mobile». Microsoft. Archived from the original on February 8, 2008. Retrieved September 13, 2007.
- ^ a b «Unsupported features in Excel Mobile». Microsoft. Archived from the original on October 20, 2007. Retrieved September 21, 2007.
- ^ Use Excel Mobile Archived October 20, 2007, at the Wayback Machine. Microsoft. Retrieved September 21, 2007.
- ^ «Excel Mobile». Windows Store. Microsoft. Retrieved June 26, 2016.
- ^ «PowerPoint Mobile». Windows Store. Microsoft. Retrieved June 26, 2016.
- ^ «Differences between using a workbook in the browser and in Excel — Office Support». support.office.com. Archived from the original on 8 February 2017. Retrieved 7 February 2017.
- ^ «Description of the Excel Viewer». Microsoft. February 17, 2012. Archived from the original on April 6, 2013.
- ^ a b «How to obtain the latest Excel Viewer». Microsoft Docs. May 22, 2020. Retrieved January 3, 2021.
- ^ «Description of the security update for Excel Viewer 2007: February 12, 2019». Microsoft. April 16, 2020. Retrieved January 3, 2021.
- ^ «Microsoft Excel Viewer». Microsoft. 1997. Archived from the original on January 20, 1998.
- ^ «Excel 97/2000 Viewer: Spreadsheet Files». Microsoft. Archived from the original on January 13, 2004.
- ^ «New Features in Windows CE .NET 4.1». Microsoft Docs. June 30, 2006. Retrieved January 3, 2021.
- ^ «Excel Viewer 2003». Microsoft. October 12, 2004. Archived from the original on January 15, 2005.
- ^ «Excel Viewer 2003 Service Pack 3 (SP3)». Microsoft. September 17, 2007. Archived from the original on October 11, 2007.
- ^ «Excel Viewer». Microsoft. January 14, 2008. Archived from the original on September 26, 2010.
- ^ «Excel Viewer 2007 Service Pack 2 (SP2)». Microsoft. April 24, 2009. Archived from the original on April 28, 2012.
- ^ «Excel Viewer 2007 Service Pack 3 (SP3)». Microsoft. October 25, 2011. Archived from the original on December 29, 2011.
- ^ «Supported versions of the Office viewers». Microsoft. April 16, 2020. Retrieved January 3, 2021.
- ^
Microsoft’s overview is found at: «Floating-point arithmetic may give inaccurate results in Excel». Revision 8.2 ; article ID: 78113. Microsoft support. June 30, 2010. Retrieved July 2, 2010. - ^
Altman, Micah; Gill, Jeff; McDonald, Michael (2004). «§2.1.1 Revealing example: Computing the coefficient standard deviation». Numerical issues in statistical computing for the social scientist. Wiley-IEEE. p. 12. ISBN 978-0-471-23633-7. - ^ de Levie, Robert (2004). cited work. pp. 45–46. ISBN 978-0-19-515275-3.
- ^
Walkenbach, John (2010). «Defining data types». Excel 2010 Power Programming with VBA. Wiley. pp. 198 ff and Table 8–1. ISBN 978-0-470-47535-5. - ^ McCullough, Bruce D.; Wilson, Berry (2002). «On the accuracy of statistical procedures in Microsoft Excel 2000 and Excel XP». Computational Statistics & Data Analysis. 40 (4): 713–721. doi:10.1016/S0167-9473(02)00095-6.
- ^ McCullough, Bruce D.; Heiser, David A. (2008). «On the accuracy of statistical procedures in Microsoft Excel 2007». Computational Statistics & Data Analysis. 52 (10): 4570–4578. CiteSeerX 10.1.1.455.5508. doi:10.1016/j.csda.2008.03.004.
- ^ Yalta, A. Talha (2008). «The accuracy of statistical distributions in Microsoft Excel 2007». Computational Statistics & Data Analysis. 52 (10): 4579–4586. doi:10.1016/j.csda.2008.03.005.
- ^ Goldwater, Eva. «Using Excel for Statistical Data Analysis—Caveats». University of Massachusetts School of Public Health. Retrieved November 10, 2008.
- ^
Heiser, David A. (2008). «Microsoft Excel 2000, 2003 and 2007 faults, problems, workarounds and fixes». Archived from the original on April 18, 2010. Retrieved April 8, 2010. - ^
Function improvements in Excel 2010 Archived April 6, 2010, at the Wayback Machine Comments are provided from readers that may illuminate some remaining problems. - ^ «The MOD bug». Byg Software. Archived from the original on January 11, 2016. Retrieved November 10, 2008.
- ^ «Days of the week before March 1, 1900 are incorrect in Excel». Microsoft. Archived from the original on July 14, 2012. Retrieved November 10, 2008.
- ^ «Excel incorrectly assumes that the year 1900 is a leap year». Microsoft. Retrieved May 1, 2019.
- ^ Spolsky, Joel (June 16, 2006). «My First BillG Review». Joel on Software. Retrieved November 10, 2008.
- ^ «The Contradictory Nature of OOXML». ConsortiumInfo.org. January 17, 2007.
- ^ «Negative date and time value are displayed as pound signs (###) in Excel». Microsoft. Retrieved March 26, 2012.
- ^ Zeeberg, Barry R; Riss, Joseph; Kane, David W; Bussey, Kimberly J; Uchio, Edward; Linehan, W Marston; Barrett, J Carl; Weinstein, John N (2004). «Mistaken Identifiers: Gene name errors can be introduced inadvertently when using Excel in bioinformatics». BMC Bioinformatics. 5 (1): 80. doi:10.1186/1471-2105-5-80. PMC 459209. PMID 15214961.
- ^ a b Ziemann, Mark; Eren, Yotam; El-Osta, Assam (2016). «Gene name errors are widespread in the scientific literature». Genome Biology. 17 (1): 177. doi:10.1186/s13059-016-1044-7. PMC 4994289. PMID 27552985.
- ^ Anon (2016). «Microsoft Excel blamed for gene study errors». bbc.co.uk. London: BBC News.
- ^ Cimpanu, Catalin (August 24, 2016). «One in Five Scientific Papers on Genes Contains Errors Because of Excel». Softpedia. SoftNews.
- ^ Ziemann, Mark (2016). «Genome Spot: My personal thoughts on gene name errors». genomespot.blogspot.co.uk. Archived from the original on August 30, 2016.
- ^ Vincent, James (August 6, 2020). «Scientists rename human genes to stop Microsoft Excel from misreading them as dates». The Verge. Retrieved October 9, 2020.
- ^ «Excel: type() and
WorksheetFunction.IsText()fail for long strings». Stack Overflow. November 3, 2018. - ^ Rajah, Gary (August 2, 2004). «Trouble with macros». The Hindu Business Line. Retrieved March 19, 2019.
- ^ Chirilov, Joseph (January 8, 2009). «Microsoft Excel — Why Can’t I Open Two Files With the Same Name?». MSDN Blogs. Microsoft Corporation. Archived from the original on July 29, 2010. Retrieved March 19, 2019.
- ^ Infoworld Media Group, Inc. (July 7, 1986). InfoWorld First Look: Supercalc 4 challenging 1-2-3 with new tactic.
- ^ «The History of Microsoft — 1987». channel9.msdn.com. Archived from the original on September 27, 2010. Retrieved October 7, 2022.
- ^ «The History of Microsoft — 1987». learn.microsoft.com. Retrieved October 7, 2022.
- ^ a b Walkenbach, John (December 4, 2013). «Excel Version History». The Spreadsheet Page. John Walkenbach. Retrieved July 12, 2020.
- ^ Lewallen, Dale (1992). PC/Computing guide to Excel 4.0 for Windows. Ziff Davis. p. 13. ISBN 9781562760489. Retrieved July 27, 2013.
- ^ Lake, Matt (April 6, 2009). «Easter Eggs we have loved: Excel 4». crashreboot.blogspot.com. Retrieved November 5, 2013.
- ^ Osterman, Larry (October 21, 2005). «Why no Easter Eggs?». Larry Osterman’s WebLog. MSDN Blogs. Retrieved July 29, 2006.
- ^ «Excel 95 Hall of Tortured Souls». Retrieved July 7, 2006.
- ^ «Excel Oddities: Easter Eggs». Archived from the original on August 21, 2006. Retrieved August 10, 2006.
- ^ «Car Game In Ms Excel». Totalchoicehosting.com. September 6, 2005. Retrieved January 28, 2014.
- ^ Dostál, M (December 9, 2010). User Acceptance of the Microsoft Ribbon User Interface (PDF). Palacký University of Olomouc. ISBN 978-960-474-245-5. ISSN 1792-6157. Retrieved May 28, 2013.
- ^ [Using Excel Tables to
Manipulate Billing Data https://mooresolutionsinc.com/downloads/Billing_MJ12.pdf] - ^ Dodge, Mark; Stinson, Craig (2007). «Chapter 1: What’s new in Microsoft Office Excel 2007». Microsoft Office Excel 2007 inside out. Microsoft Press. p. 1 ff. ISBN 978-0-7356-2321-7.
- ^ «What’s New in Excel 2010 — Excel». Archived from the original on December 2, 2013. Retrieved September 23, 2010.
- ^ Walkenbach, John (2010). «Some Essential Background». Excel 2010 Power Programming with VBA. Indianapolis, Indiana: Wiley Publishing, Inc. p. 20. ISBN 9780470475355.
- ^ Harris, Steven (October 1, 2013). «Excel 2013 — Flash Fill». Experts-Exchange.com. Experts Exchange. Retrieved November 23, 2013.
- ^ «What’s new in Excel 2013». Office.com. Microsoft. Retrieved January 25, 2014.
- ^ K., Gasper (October 10, 2013). «Does a PowerPivot Pivot Table beat a regular Pivot Table». Experts-Exchange.com. Experts Exchange. Retrieved November 23, 2013.
- ^ K., Gasper (May 20, 2013). «Inquire Add-In for Excel 2013». Experts-Exchange.com. Experts Exchange. Retrieved November 23, 2013.
- ^ «New functions in Excel 2013». Office.com. Microsoft. Retrieved November 23, 2013.
- ^ «What’s new in Office 2016». Office.com. Microsoft. Retrieved August 16, 2015.
- ^ «Microsoft Announces March Availability of Office 98 Macintosh Edition». Microsoft. January 6, 1998. Retrieved December 29, 2017.
- ^ «Office for Mac Is Finally a ‘First-Class Citizen’«. Re/code. July 16, 2015. Retrieved July 29, 2015.
- ^ Perton, Marc (November 20, 2005). «Windows at 20: 20 things you didn’t know about Windows 1.0». switched.com. Archived from the original on April 11, 2013. Retrieved August 1, 2013.
- ^ Keizer, Gregg (February 24, 2009). «Attackers exploit unpatched Excel vulnerability». Computerworld. IDG Communications, Inc. Retrieved March 19, 2019.
- ^ «JTRIG Tools and Techniques». The Intercept. First Look Productions, Inc. July 14, 2014. Archived from the original on July 14, 2014. Retrieved March 19, 2019.
- ^ Cook, John. «JTRIG Tools and Techniques». The Intercept. p. 4. Retrieved March 19, 2019 – via DocumentCloud.
- ^ Phillips, Gavin (December 11, 2015). «8 Legendary Games Recreated in Microsoft Excel». MUO.
- ^ «Excel Games – Fun Things to Do With Spreadsheets». November 10, 2021.
- ^ «Unusual Uses of Excel». techcommunity.microsoft.com. August 5, 2022.
- ^ «Someone made a version of ‘Civilization’ that runs in Microsoft Excel». Engadget.
- ^ Dalgleish, Debra. «Have Fun Playing Games in Excel». Contextures Excel Tips.
- ^ «Microsoft Excel esports is real and it already has an international tournament». ONE Esports. June 9, 2021.
References
- Bullen, Stephen; Bovey, Rob; Green, John (2009). Professional Excel Development: The Definitive Guide to Developing Applications Using Microsoft Excel and VBA (2nd ed.). Boston: Addison Wesley. ISBN 978-0-321-50879-9.
- Dodge, Mark; Stinson, Craig (2007). Microsoft Office Excel 2007 Inside Out. Redmond, Wash.: Microsoft Press. ISBN 978-0-7356-2321-7.
- Billo, E. Joseph (2011). Excel for Chemists: A Comprehensive Guide (3rd ed.). Hoboken, N.J.: John Wiley & Sons. ISBN 978-0-470-38123-6.
- Gordon, Andy (January 25, 2021). «LAMBDA: The ultimate Excel worksheet function». microsoft.com. Microsoft. Retrieved April 23, 2021.
External links
Wikibooks has a book on the topic of: Excel
- Microsoft Excel – official site
Для автоматизации обработки данных, представленных в табличной форме, используются специальные программы, называемые электронными таблицами или табличными процессорами.
Мы познакомимся с табличным процессором Microsoft Excel.
Окно табличного процессора Excel содержит стандартную строку заголовка, строку меню и панели инструментов. В основном мы будем использовать панели инструментов Стандартная и Форматирование.
Документ в Excel называется рабочей книгой, которая в свою очередь делится на рабочие листы. Между рабочими листами можно переключаться внизу окна.
Основная часть окна табличного процессора — рабочий лист. Рабочий лист состоит из (256) столбцов и (65 536) строк. Столбцы именуются латинскими буквами (одно- и двухбуквенными именами) в алфавитном порядке в направлении слева направо. Строки нумеруются сверху вниз, начиная с (1).
Ячейка — это место пересечения столбца и строки.
Имя ячейки составляется из буквенного обозначения столбца и номера строки.
На рисунке выделена ячейка А1. Она имеет такое имя, потому что находится в столбце А и первой строке.
Адрес ячейки — имя ячейки.
Диапазон — идущие подряд ячейки в строке или прямоугольнике.
Диапазон задаётся следующим образом: D4:D15, F6:F18, B2:K10. Указывается начальная и конечная ячейки диапазона, в прямоугольном диапазоне — ячейки левого верхнего и правого нижнего углов.
Табличный курсор — элемент таблицы, который показывает на текущую или активную ячейку.
Активная ячейка — это ячейка электронной таблицы, которая используется в данный момент или готова к вводу или редактированию содержащихся в ней данных.
Обрати внимание!
В ячейках может содержаться текст, число либо формула.
Текст используется для оформления таблиц, числами задаются количественные характеристики, с помощью формул производят математические вычисления.
Формулы являются своеобразными инструкциями, определяющими порядок вычислительных действий. Они могут содержать имена ячеек, числа, знаки операций и обращения к функциям.
Арифметические операции «сложение», «вычитание», «умножение» и «деление» обозначаются соответственно символами «+», «-», «*» и «/».
При решении задач мы будем использовать функции суммирования (СУММ), вычисления среднего арифметического значения (СРЗНАЧ), нахождения максимума (МАКС) и минимума (МИН).
При вычислении по формуле используется порядок операций, принятый в математике.
Для его изменения можно применять круглые скобки.
Изменение содержимого любой ячейки приводит к автоматическому пересчёту значений всех ячеек таблицы, в которых есть ссылки на данную.
Электронные таблицы не только автоматизируют расчёты, но и являются эффективным средством моделирования различных вариантов и ситуаций.
Меняя значения исходных данных, можно проследить за изменением получаемых результатов и из множества вариантов решения задачи выбрать наиболее подходящий.
МИНИСТЕРСТВО НАУКИ И ВЫСШЕГО ОБРАЗОВАНИЯ РОССИЙСКОЙ ФЕДЕРАЦИИ
Федеральное государственное бюджетное образовательное учреждение высшего образования
«Воронежский государственный технический университет»
Т. В. Волобуева
ИНФОРМАТИКА. ВВЕДЕНИЕ В EXCEL
Учебное пособие
Воронеж 2019
1
УДК 004(07) ББК 32.81я73 В68
Рецензенты:
кафедра высшей математики и информационных технологий Воронежского государственного университета инженерных технологий (канд. техн. наук, доц. Л. А. Коробова);
канд. техн. наук, доц. Т. В. Корелина
Волобуева, Т. В.
Информатика. Введение в Excel: учебное пособие / Т. В. Воло-
В68 буева; ФГБОУ ВО «Воронежcкий государственный технический университет». – Воронеж: Изд-во ВГТУ, 2019. – 94 с.
ISBN 978-5-7731-0769-9
В учебном пособии изложен теоретический материал по основам Excel с демонстрацией некоторых возможностей программы на примерах. Приводятся задания для самостоятельной работы, позволяющие закрепить усвоенный теоретический материал.
Издание соответствует требованиям Федерального государственного образовательного стандарта высшего образования по направлениям 13.03.01 «Теплоэнергетика и теплотехника» (профиль «Прикладная информатика в экономике») и 21.03.01 «Нефтегазовое дело» (профили «Проектирование, строительство и эксплуатация газонефтепроводов и газонефтехранилищ», «Эксплуатация и обслуживание объектов транспорта и хранения нефти, газа и продуктов переработки»).
Ил. 180. Табл. 5. Библиогр.: 7 назв.
УДК 004(07)
ББК 32.81я73
Печатается по решению учебно-методического совета Воронежского государственного технического университета
|
ISBN 978-5-7731-0769-9 |
© Волобуева Т. В., 2019 |
|
© ФГБОУ ВО «Воронежский государственный |
|
|
технический университет», 2019 |
2
ВВЕДЕНИЕ
MS Excel используют везде, где исходные данные, предназначенные для обработки, можно представить в виде таблиц. Программа обладает широким спектром возможностей от создания элементарных таблиц и построения графиков (диаграмм) до решения сложных вычислительных задач и моделирования различных процессов. MS Excel имеет многочисленные средства автоматизации работы и оформления итоговых документов. Используя Excel удобно, например, осуществлять хранение и визуализацию данных, вести систематизированную работу с клиентами, проводить сложные расчеты, проводить анализ информации по различным параметрам и составлять отчеты с использованием инструмента сводных таблиц. Программа обладает широким потенциалом для финансовых и инженерных расчетов, используется администраторами баз данных, менеджерами, бухгалтерами, финансистами, аналитиками, банковскими служащими, а так же в науке и медицине, социологии и статистике, IT и SEO, маркетинге и рекламе.
1. ИСТОРИЯ РАЗВИТИЯ И ОСНОВНЫЕ ПОНЯТИЯ ЭЛЕКТРОННЫХ ТАБЛИЦ И ТАБЛИЧНЫХ ПРОЦЕССОРОВ
В1961 году американский ученый Ричард Маттесич опубликовал труд
«Budgeting Models and System Simulation», где впервые сформулировал идею электронных таблиц.
В1979 году Дэн Бриклин, совместно с Бобом Фрэнкстоном разработали для компьютеров Apple II программу VisiCalc. Они и считаются родоначальником электронных таблиц как отдельного класса программного обеспечения. Созданный ими табличный редактор дал возможность использовать персональный компьютер как массовый инструмент для бизнеса. Впоследствии появились многочисленные программные продукты этого класса: SuperCalc (1980 год), Abacus, Lotus 1-2-3 (1982 год, предназначен для IBM PC и
объединил в себе вычислительные возможности электронных таблиц, деловую графику и функции реляционной СУБД), Microsoft Excel (1985 год, входит в состав пакета Microsoft Office), OpenOffice.org Calc, Gnumeric, KSpread, Quattro Pro, Numbers.
Табличные редакторы могли обрабатывать только двухмерные электронные таблицы с числовыми данными. Табличными процессорами называют программное обеспечение, предназначенное для работы с электронными таблицами, однако, эти программные продукты, помимо возможностей табличных редакторов обладают возможностью обрабатывать и текстовые, и графические, и другие элементы, содержат широкий спектр математических функции, позволяющих выполнять сложные инженерные, статистические, финансовые, и прочие расчеты.
3
Электронная таблица это средство информационных технологий, позволяющее решать целый комплекс задач:
1.Выполнение вычислений. Многие расчеты выполняются в табличной форме (расчетные ведомости, табуляграммы, сметы расходов). Ряд математических задач эффективно решаются численными методами и их также удобно выполнять в табличной форме. Электронные таблицы представляют собой удобный инструмент для автоматизации таких вычислений. Благодаря электронным таблицам появляется возможность реализовать решения многих вычислительных задач на ЭВМ, которые раньше можно было осуществить только путем программирования.
2.Математическое моделирование. Основное свойство электронной таблицы – автоматический (мгновенный) пересчет формул при изменении значений входящих в них операндов. Таким образом, использование математических формул в электронных таблицах позволяет представить взаимосвязь между различными параметрами некоторой реальной системы. Это позволяет использовать электронные таблицы для организации численного эксперимента и поиска оптимального решения, для подбора параметров и прогноза проведения моделируемой системы, для планирования и анализа различных зависимостей.
3.Анализ результатов вычислений и их визуализацию, т.е. представления результатов в наглядном виде (графики, диаграммы). В настоящее время, когда выдвигаются требования к оперативности и наглядности предоставляемой информации, эта возможность особенно актуальна.
4.Обеспечение безопасности хранения информации и данных.
1.1.Интерфейс Microsoft Excel
Программа, как и любая другая под Widows открывается в окно. Оно содержит:
1.«Строка заголовка» (в ней указывается имя программы) с кнопками управления окном программы и окном документа («Свернуть», «Свернуть в окно» или «Развернуть во весь экран», «Закрыть»).
2.«Панель быстрого доступа». Благодаря этой панели имеется возможность получить доступ к некоторой группе основных команд независимо от того, какая вкладка «Ленты» в данный момент открыта. По умолчанию панель быстрого доступа содержит команды: «Сохранить», «Отменить» и «Вернуть». Всегда имеется возможность добавить любые другие команды на эту панель (настроить ее).
3.«Лента». Является основным рабочим элементом интерфейса MS Excel
исодержит все команды, необходимые для выполнения наиболее распространенных задач. «Лента» состоит из вкладок («Главная», «Вставка», «Разметка страницы», «Формулы», «Данные» и т.д.), каждая из которых в свою очередь содержит несколько групп команд.
4
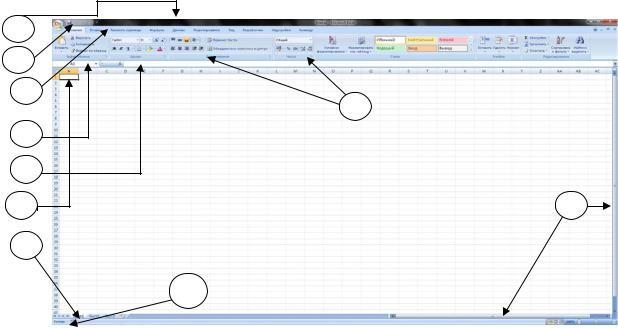
1
2
3
4
5
6
8
10
Рис. 1
4. «Группа команд» (на раскрывшейся, текущей ленте, на рисунке выше это группа команд раскрывшейся текущей ленты «Главная»). Каждая группа содержит блок различных команд. Для выполнения выбранной команды необходимо кликнуть мышью на ее ярлык. Некоторые группы содержат стрелку в правом нижнем углу, нажав на которую можно увидеть еще большее число команд.
5. «Поле имя». В нем отображается адрес, т.е. имя выбранной (активной) ячейки. Ячейка А1, например, – это пересечение столбца А и строки 1.
6. «Строка формул», содержащаяfx в качестве элементов «поле имя» и кнопку «Вставка функции» ( ), предназначенную для ввода и редактирования формул в ячейках. При этом в «поле имя» отображается адрес текущей ячейки. В строку формул можно вводить данные, формулы и функции, которые синхронно появятся в активной ячейке.
7. «Ячейка таблицы». На пересечении строк и столбцов образуются ячейки таблицы. Ячейка – это минимально адресуемый элемент рабочего листа. Имя ячейки (ее адрес) состоит из имени столбца и номера строки. Например, А1 или B23. Для того чтобы выделить ячейку, требуется кликнуть на нее мышью. Чтобы войти в ячейку для редактирования необходимо кликнуть на нее дважды. Темный контур вокруг текущей активной ячейки называют табличным курсором. На рисунке выше выбрана (активна) ячейка A1. Адресация ячеек используется при записи формул. Одна из ячеек всегда является активной, и в ней производятся операции ввода и редактирования. Группа ячеек называется диапазоном. Диапазон ячеек обозначают, указывая через двоеточие имена ячеек, расположенных в противоположных углах, например: А5:D20. Диапазон ячеек можно выделить из подряд идущих ячеек в строке, столбце или прямоугольнике. При задании диапазона указывают его
5
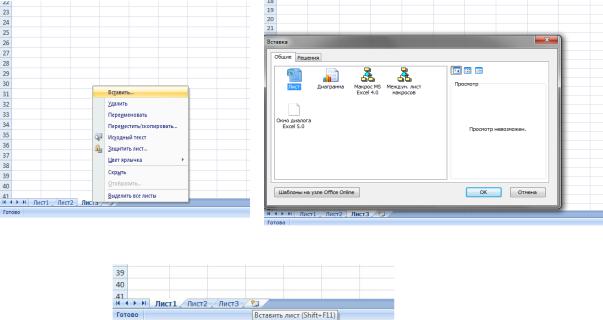
начальную и конечную ячейки, в прямоугольном диапазоне – ячейки левого верхнего и правого нижнего углов. Наибольший диапазон представляет вся таблица, наименьший одна ячейка. Примеры диапазонов – A1:A100; B12:AZ12; B2:К40. Если диапазон содержит числовые величины, то они могут быть просуммированы, вычислено среднее значение, найдено минимальное или максимальное значение и т.д.
8.«Рабочий лист». Файлы Excel называют «Рабочими книгами». Каждая книга состоит из одного или нескольких листов (вкладки в нижней части экрана по умолчанию с названиями Лист1, Лист2 и т.д.). Их также называют электронными таблицами. Листы можно добавлять, удалять и переименовывать. Для перехода от одного листа к другому необходимо просто кликнуть на его название.
9.«Полосы прокрутки» (вертикальная и горизонтальная).
«Лист» в Excel имеет гораздо большее количество ячеек, чем можно увидеть на экране. Для выбора остальной части листа и служат вертикальная или горизонтальная полоса прокрутки в зависимости от того, какую часть «Листа» необходимо увидеть. Чтобы переименовать рабочий лист, надо дважды щелкнуть на его ярлыке, либо нажать правой кнопкой мыши на ярлыке листа (открыть контекстное меню объекта) и выбрать пункт «Переименовать». Листам можно давать произвольные имена, исключая специальные символы * : / ?[]. Чтобы переместить рабочий лист в другую позицию в той же рабочей книге, нужно мышью отбуксировать (перетащить) его ярлычок в соответствующее место. Если пользователю необходимо добавить новый рабочий лист, необходимо из контекстного меню любого уже существующего листа выбрать команду Вставить->Лист->Ok (рис. 2а-2б),
в)
Рис. 2
6
Соседние файлы в предмете [НЕСОРТИРОВАННОЕ]
- #
- #
- #
- #
- #
- #
- #
- #
- #
- #
- #

