Power Pivot — обзор и обучение
Excel для Microsoft 365 Excel 2021 Excel 2019 Excel 2016 Excel 2013 Еще…Меньше
Power Pivot — это технология моделирования данных, которая позволяет создавать модели данных, устанавливать отношения и добавлять вычисления. С помощью Power Pivot вы можете работать с большими наборами данных, создавать развернутые отношения и сложные (или простые) вычисления — и все это в знакомой высокопроизводительной среде Excel.
Power Pivot — одно из трех средств анализа данных, доступных в Excel:
-
Power Pivot
-
Power Query
-
Power View
Ресурсы по Power Pivot
Приведенные ниже ссылки и сведения помогут вам освоиться с Power Pivot (в том числе узнать, как включить Power Query в Excel и как начать работу с Power Pivot), а также найти учебники и подключиться к сообществу.
Как получить Power Pivot?
Power Pivot можно использовать в качестве надстройки для Excel, которую можно включить, выполнив несколько простых действий. Базовая технология моделирования Power Pivot используется также в конструкторе Power BI Designer, который является частью службы Power BI, предлагаемой корпорацией Майкрософт.
Начало работы с Power Pivot
Когда надстройка Power Pivot включена, на ленте появляется вкладка Power Pivot, которая показана на следующем изображении.
На вкладке ленты Power Pivot в разделе Модель данных выберите управление.
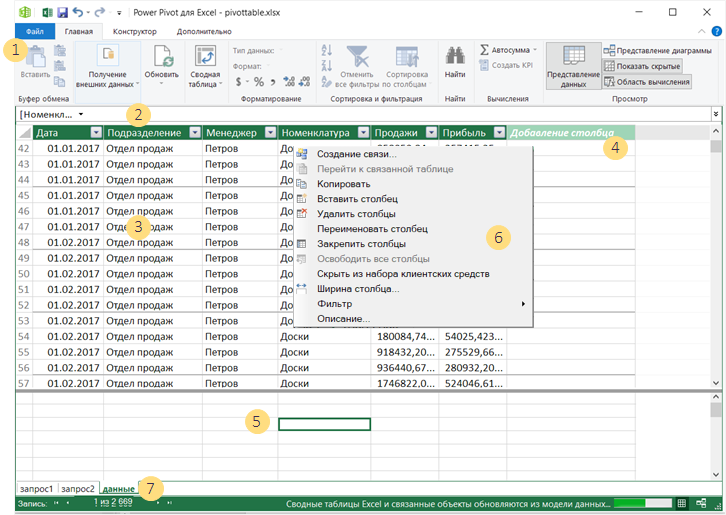
После выбора элемента Управление появляется окно Power Pivot, в котором вы можете просматривать модель данных и управлять ею, добавлять вычисления, устанавливать отношения и видеть элементы своей модели данных Power Pivot. Модель данных — это коллекция таблиц или других данных, между которыми зачастую установлены отношения. На рисунке ниже показано окно Power Pivot с таблицей.
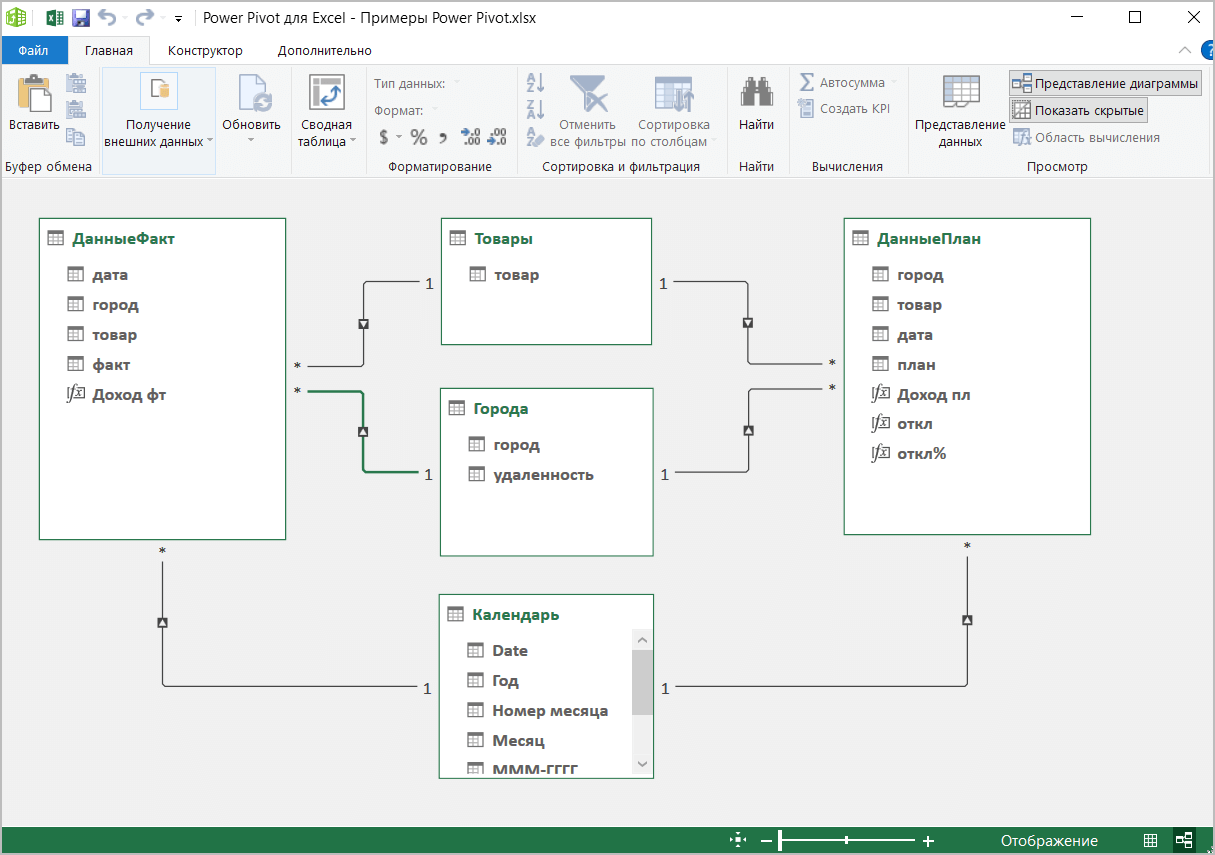
В окне Power Pivot также можно устанавливать и графически выражать отношения между данными, включенными в модель. Щелкнув значок представления схемы в правом нижнем углу окна Power Pivot, вы увидите имеющиеся отношения в модели данных Power Pivot. На приведенном ниже изображении показано окно Power Pivot в представлении схемы.
Краткое руководство по использованию Power Pivot вы найдете в следующей статье:
-
Учебник. Расширение связей модели данных с использованием Excel, Power Pivot и DAX
В дополнение к этому руководству по следующей ссылке вы найдете исчерпывающую подборку ссылок, ресурсов и дополнительных сведений о Power Pivot:
-
Справка по Power Pivot
В последующих разделах перечислены дополнительные ресурсы и руководства, в которых подробнее рассказывается о том, как использовать Power Pivot, в том числе в сочетании с Power Query и Power View, для самостоятельного выполнения комплексных, интуитивно понятных задач бизнес-аналитики в Excel.
Учебники по PowerPivot
Посмотрите на Power Pivot в действии — это поможет вам понять принципы работы и ознакомиться с полезными вариантами использования, демонстрирующими возможности Power Pivot. Начать работу вам помогут следующие руководства:
-
Создание модели данных в Excel (начинается с базовой модели данных, которая затем настраивается с помощью Power Pivot)
-
Импорт данных в Excel и создание модели данных (первый из шести конечных рядов учебников)
-
Оптимизация модели данных для отчетов Power View
-
Краткое руководство. Обучение основам DAX за 30 минут
Дополнительные сведения о Power Pivot
Power Pivot проста в использовании и быстро работает. Эта надстройка позволяет создавать многофункциональные и сложные вычисления, индикаторы и формулы. Приведенные ниже ссылки помогут вам определиться со многими задачами, которые можно выполнять с помощью Power Pivot.
-
Создание модели данных с эффективным использованием памяти с помощью Excel 2013 и надстройки Power Pivot
-
Общие сведения о вычислениях в PowerPivot
-
Выражения анализа данных (DAX) в PowerPivot
-
Иерархии в PowerPivot
-
Агрегатные функции в PowerPivot
-
Power Pivot: мощные средства анализа и моделирования данных в Excel (сравнение моделей данных)
-
Оптимизатор размера книги (скачивание)
По следующей ссылке вы найдете исчерпывающий набор ссылок и полезных сведений (еще раз):
-
Справка по Power Pivot
Ссылки на форумы и связанные темы
Множество разных людей используют Power Query, и они с удовольствием делятся тем, что узнали. С помощью указанных ниже ресурсов вы можете пообщаться с другими пользователями в сообществе Power Query.
-
Форум Power Pivot.
-
Выражения анализа данных (DAX) в PowerPivot
Нужна дополнительная помощь?
Power Pivot — встроенный инструмент Excel для обработки и анализа больших объёмов данных. С помощью неё в Excel загружают данные из нескольких источников разных форматов, моделируют их в одну базу и работают с ней дальше.
В Power Pivot нет ограничений по количеству строк. Excel позволяет работать только с 1 048 000 строк, а в Power Pivot их может быть гораздо больше. При этом производительность программы не уменьшается.
Поэтому Power Pivot точно пригодится в случаях, когда стандартный Excel не справляется с количеством данных и их форматами.
В статье разберёмся:
- для чего нужна и как работает надстройка Power Pivot;
- как загрузить данные из внешних источников в Power Pivot;
- как смоделировать данные в Power Pivot и создать базу данных;
- как узнать больше о работе в Excel.
Как мы сказали выше, Power Pivot расширяет стандартные возможности Excel и позволяет обрабатывать большое количество данных из разных источников.
Power Pivot — бесплатная надстройка для Excel. Для Excel 2010 года её нужно загружать отдельно с сайта Microsoft. Для версий после 2013 года она встроена в стандартную функциональность программы. К сожалению, Power Pivot не предусмотрен для macOS-версии Excel.
Работа в Power Pivot проходит в таком порядке:
- Загружаем данные из разных источников — например, из базы данных Microsoft Access, «1C», из текстовых файлов или электронных таблиц, из интернета.
- Настраиваем связи между загруженными данными — создаём модель данных. Для этого не нужна функция ВПР или другие поисковые функции Excel — в Power Pivot свои инструменты для объединения данных.
- Проводим дополнительные вычисления — при необходимости.
- Power Pivot строит на основе моделей данных необходимые отчёты — в виде сводных таблиц или диаграмм.
В следующих разделах разберём на примере, как загружать данные из внешних источников в Power Pivot, как их моделировать. А также покажем, как на основании этих данных создать отчёт в форме сводной таблицы.
Предположим, у нас есть четыре файла разных форматов:
- данные о продажах книжного издательства → в формате TXT;
- справочник регионов → в виде базы данных в Access;
- справочник товаров → в XLS;
- ценовая политика → на слайде Power Point.
Скриншот: курс Skillbox «Excel + Google Таблицы с нуля до PRO»
Данные о продажах. Это таблица с четырьмя столбцами — город, ID товара, дата продажи и количество проданных единиц — и более чем полутора миллионами строк.
Скриншот: курс Skillbox «Excel + Google Таблицы с нуля до PRO»
Справочник регионов. В файле одна таблица, в которой перечислены все города России, субъекты и округа.
Скриншот: курс Skillbox «Excel + Google Таблицы с нуля до PRO»
Справочник товаров. В этой таблице перечислены названия книг, их формат и ID‑номер.
Скриншот: курс Skillbox «Excel + Google Таблицы с нуля до PRO»
Ценовая политика. Это слайд, где указаны актуальные цены на книги разных форматов.
Скриншот: курс Skillbox «Excel + Google Таблицы с нуля до PRO»
Наша задача — связать данные из этих источников в одну базу. Для начала нужно загрузить эти данные в Power Pivot.
Для этого потребуется разблокировать вкладку «Разработчик». Переходим во вкладку «Файл» и выбираем пункты «Параметры» → «Настройка ленты». В открывшемся окне в разделе «Основные вкладки» находим пункт «Разработчик», отмечаем его галочкой и нажимаем кнопку «ОК» → в основном меню Excel появляется новая вкладка «Разработчик».
Теперь на этой вкладке нажимаем кнопку «Настройки COM», в появившемся окне выбираем Microsoft Power Pivot for Excel и жмём «ОК».
Скриншот: курс Skillbox «Excel + Google Таблицы с нуля до PRO»
Готово — на панели появилась отдельная вкладка Power Pivot.
Для этого переходим на вкладку Power Pivot и нажимаем на кнопку «Управление».
Скриншот: курс Skillbox «Excel + Google Таблицы с нуля до PRO»
Готово — открылось окно Power Pivot. Оно относится к файлу Excel, через который мы его открыли.
Скриншот: курс Skillbox «Excel + Google Таблицы с нуля до PRO»
В этом окне нам нужно собрать данные из наших четырёх источников и настроить связи между ними.
На вкладке «Главная» нажимаем кнопку «Из базы данных» и выбираем «Из Access».
Скриншот: курс Skillbox «Excel + Google Таблицы с нуля до PRO»
В появившемся окне в поле «Имя базы данных» прописываем адрес, где хранится файл Access со справочником регионов, — адрес можно найти через кнопку «Обзор».
Если база данных зашифрована, в этом же окне нужно ввести имя пользователя и пароль.
Нажимаем «Далее».
Скриншот: курс Skillbox «Excel + Google Таблицы с нуля до PRO»
В следующем окне появляется список всех таблиц, которые хранятся в выбранной базе данных.
В нашем случае она одна — «Справочник регионов». Выбираем её и нажимаем «Готово».
Скриншот: курс Skillbox «Excel + Google Таблицы с нуля до PRO»
Начинается импорт выбранной таблицы в Power Pivot. После этого появляется окно с результатом. Проверяем информацию и нажимаем «Закрыть».
Скриншот: курс Skillbox «Excel + Google Таблицы с нуля до PRO»
Готово — первые данные загрузились в Power Pivot. В окне появился отдельный лист «Справочник регионов», на нём отражена та же таблица, что была и во внешнем источнике.
Скриншот: курс Skillbox «Excel + Google Таблицы с нуля до PRO»
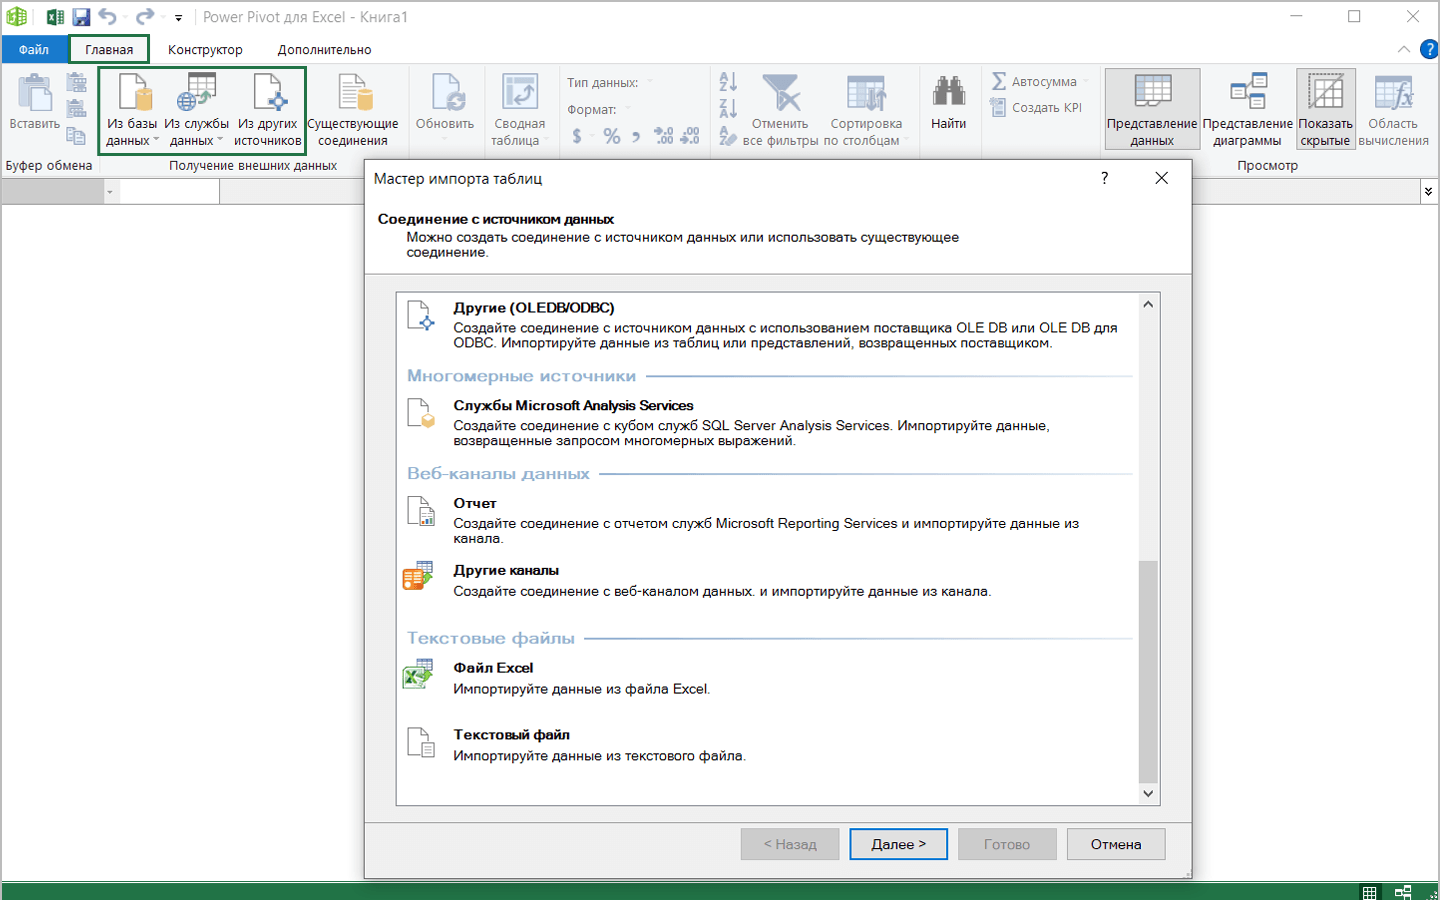
На вкладке «Главная» нажимаем кнопку «Из других источников». В появившемся окне выбираем «Текстовый файл» и нажимаем «Далее».
Скриншот: курс Skillbox «Excel + Google Таблицы с нуля до PRO»
В появившемся окне в поле «Имя базы данных» прописываем адрес, где хранится текстовый файл с данными о продажах.
После этого в нижней части окна появляется предпросмотр таблицы из источника данных.
При необходимости корректируем настройки — например, меняем вид разделителя столбцов или отключаем ненужные графы таблицы. Затем нажимаем «Готово».
Скриншот: курс Skillbox «Excel + Google Таблицы с нуля до PRO»
Начинается импорт выбранной таблицы из текстового файла в Power Pivot. После этого появляется окно с результатом. Проверяем информацию и нажимаем «Закрыть».
Скриншот: курс Skillbox «Excel + Google Таблицы с нуля до PRO»
Готово — в окне Power Pivot появилась вторая вкладка «Продажи» — на ней более полутора миллионов строк. Напомним, в Excel без надстройки могло бы поместиться около миллиона.
Скриншот: курс Skillbox «Excel + Google Таблицы с нуля до PRO»
По аналогии с предыдущим шагом на вкладке «Главная» нажимаем кнопку «Из других источников». Во всплывшем окне выбираем «Файл Excel» и нажимаем «Далее».
В появившемся окне в поле «Имя базы данных» прописываем адрес, по которому хранится файл Excel со справочником товаров. Нажимаем «Далее»,
Скриншот: курс Skillbox «Excel + Google Таблицы с нуля до PRO»
В следующем окне появляется список всех таблиц, которые хранятся в выбранной базе данных.
В нашем случае она одна — «Справочник товаров». Выбираем её и нажимаем «Готово».
Снова происходит импорт и появляется окно с результатом.
Скриншот: курс Skillbox «Excel + Google Таблицы с нуля до PRO»
В окне Power Pivot появилась третья вкладка «Справочник товаров». Также со всеми данными, которые хранились в первоисточнике — внешнем файле Excel.
Скриншот: курс Skillbox «Excel + Google Таблицы с нуля до PRO»
В этом случае выгрузить данные можно только методом «копировать — вставить».
Открываем файл Power Point, содержащий ценовую политику. Выделяем таблицу, нажимаем правую кнопку мыши и выбираем «Скопировать».
Скриншот: курс Skillbox «Excel + Google Таблицы с нуля до PRO»
Затем возвращаемся в окно Power Pivot и на любой вкладке нажимаем кнопку «Вставить» на главной панели.
Скриншот: курс Skillbox «Excel + Google Таблицы с нуля до PRO»
В появившемся окне вводим имя таблицы — «Цены» — и нажимаем «ОК».
Скриншот: курс Skillbox «Excel + Google Таблицы с нуля до PRO»
Готово — в окне Power Pivot появилась четвёртая вкладка «Цены».
Скриншот: курс Skillbox «Excel + Google Таблицы с нуля до PRO»
Важно понимать, что при таком варианте выгрузки данных — копировании и вставке — таблица не будет обновляться, если внести изменения в исходный файл Power Point.
В предыдущих трёх вариантах — при загрузке таблиц из базы данных, текстового файла и файла Excel — в случае изменения данных в исходных файлах они также изменятся и в Power Pivot. Ниже показываем, как это сделать.
Для этого на главной панели любой вкладки нужно нажать кнопку «Обновить», затем «Обновить все».
Скриншот: курс Skillbox «Excel + Google Таблицы с нуля до PRO»
Появится окно, где будет видно, какие вкладки обновляются. В нашем случае это только первые три вкладки.
Обновление проходит быстро — примерно за 10–15 секунд обновляются три вкладки, в одной из которых более полутора миллионов строк.
Файл из Power Point придётся обновлять вручную.
Скриншот: курс Skillbox «Excel + Google Таблицы с нуля до PRO»
В предыдущем разделе мы загрузили данные из внешних источников в Power Pivot. Сейчас у нас есть четыре вкладки, в которых хранятся четыре таблицы: «Справочник регионов», «Продажи», «Справочник товаров», «Цены».
Задача этого этапа — связать данные всех таблиц так, чтобы можно было анализировать информацию одновременно по всем столбцам.
Для этого на главной вкладке окна Power Pivot нажмём кнопку «Представление диаграммы».
Скриншот: курс Skillbox «Excel + Google Таблицы с нуля до PRO»
В этом режиме отображения каждая таблица показана в виде прямоугольника, в котором перечислены её столбцы. Для удобства эти прямоугольники можно двигать и менять местами.
В этом же режиме отображения в Power Pivot настраивают связи между таблицами.
Первая связь. В таблице «Продажи» есть столбец «Город», но нет столбцов «Субъекты» и «Округ». Все эти столбцы, включая столбец «Город», есть в таблице «Справочник регионов».
Соответственно, чтобы объединить данные этих двух таблиц, нужно создать связь по столбцу «Город». Для этого нужно зажать мышкой такой столбец в одной из таблиц и перетянуть его во вторую таблицу. Между таблицами появится линия.
Скриншот: курс Skillbox «Excel + Google Таблицы с нуля до PRO»
Готово — между таблицами «Справочник регионов» и «Продажи» появилась связь по столбцу «Город». Теперь у каждой строки продаж будет указан не только город, но также субъект и округ.
Скриншот: курс Skillbox «Excel + Google Таблицы с нуля до PRO»
Вторая связь. В таблице «Продажи» есть столбец «Товар», где перечислены ID‑номера книг, но нет названий книг и их форматов. Все эти данные находятся в таблице «Справочник товаров».
По аналогии с предыдущей связью построим связь между столбцом «Товар» в таблице «Продажи» и столбцом «ID товара» в таблице «Справочник товаров».
Скриншот: курс Skillbox «Excel + Google Таблицы с нуля до PRO»
Названия столбцов, по которым строят связи между таблицами, не обязательно должны быть одинаковыми. Главное, чтобы в таких столбцах хранилась аналогичная информация. В нашем случае это ID-номера книг.
При этом Power Pivot не проверяет самостоятельно, правильно ли настроена связь — совпадают ли данные столбцов двух таблиц, — поэтому проводить связи между таблицами нужно внимательно.
Третья связь. Теперь к уже объединённым данным нужно добавить цены. Они хранятся в четвёртой таблице. Настроим связь между ней и таблицей «Справочник товаров» по столбцу «Формат».
Благодаря этой связи в «Справочнике товаров» появится информация о ценах на книги.
Скриншот: курс Skillbox «Excel + Google Таблицы с нуля до PRO»
Готово. Мы построили модель из четырёх таблиц из разных источников и связали данные этих таблиц по идентичным столбцам. Чтобы увидеть результат, нужно создать сводную таблицу.
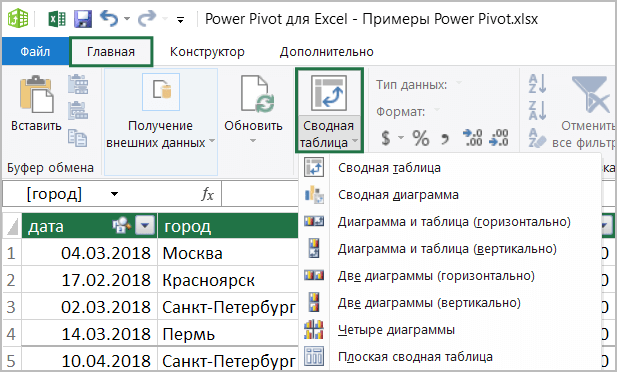
На главной вкладке нажимаем кнопку «Сводная таблица».
Скриншот: курс Skillbox «Excel + Google Таблицы с нуля до PRO»
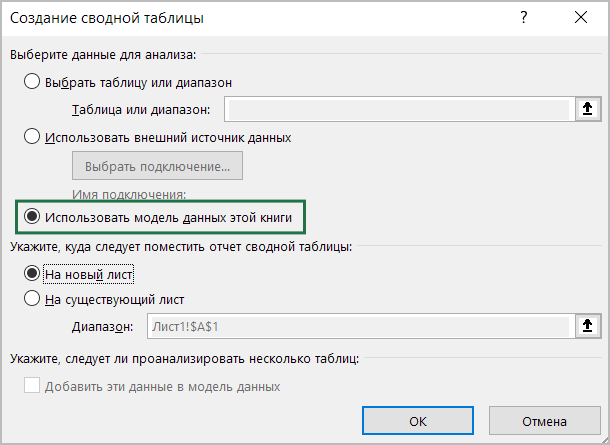
Дальше выбираем, на каком листе нужно создать сводную таблицу — на новом или на существующем.
Скриншот: курс Skillbox «Excel + Google Таблицы с нуля до PRO»
Готово — появился новый лист для сводной таблицы. Слева на листе расположена область, где появится отчёт сводной таблицы после настроек. Справа — панель «Поля сводной таблицы», в которой мы будем работать с этими настройками.
Скриншот: курс Skillbox «Excel + Google Таблицы с нуля до PRO»
Панель «Поля сводной таблицы» состоит из двух частей. В верхней части находится список полей — в нашем случае Power Pivot перенёс в список полей данные четырёх таблиц, которые мы связали между собой. В нижней части — четыре области: «Значения», «Строки», «Столбцы» и «Фильтры». У каждой области своё назначение.
Чтобы создать отчёт сводной таблицы, нужно выбрать необходимые поля из списка полей и перенести их в нужную область.
Подробнее о назначении областей, а также о том, как строить и настраивать сводные таблицы в стандартной версии Excel, говорили в этой статье Skillbox Media.
Для примера построим отчёт в форме сводной таблицы, который покажет количество продаж издательства в субъектах России с детализацией по формату книг.
Для этого в область «Строки» перенесём поля «Округ» и «Субъект» из «Справочника регионов», в область «Значения» — поле «Количество» из таблицы «Продажи», в область «Столбцы» — поле «Формат» из «Справочника товаров».
Скриншот: курс Skillbox «Excel + Google Таблицы с нуля до PRO»
Готово. Мы получили таблицу, где по вертикали расположены все субъекты и округа страны, по горизонтали — количество проданных книг с разбивкой по форматам.
По такому же принципу можно строить другие отчёты — в зависимости от того, какую информацию для анализа нужно получить. Например, в отчёте можно показать количество продаж с детализацией по названиям книг и датам их продажи.
- В этой статье Skillbox Media собрали в одном месте 15 статей и видео об инструментах Excel, которые ускорят и упростят работу с электронными таблицами.
- В Skillbox есть курс «Excel + Google Таблицы с нуля до PRO». Он подойдёт как новичкам, которые хотят научиться работать в Excel с нуля, так и уверенным пользователям, которые хотят улучшить свои навыки. На курсе учат быстро делать сложные расчёты, визуализировать данные, строить прогнозы, работать с внешними источниками данных, создавать макросы и скрипты.
- Кроме того, Skillbox даёт бесплатный доступ к записи онлайн-интенсива «Экспресс-курс по Excel: осваиваем таблицы с нуля за 3 дня». Он подходит для начинающих пользователей. На нём можно научиться создавать и оформлять листы, вводить данные, использовать формулы и функции для базовых вычислений, настраивать пользовательские форматы и создавать формулы с абсолютными и относительными ссылками.
Другие материалы Skillbox Media по Excel
Термины «Power Query», «Power Pivot», «Power BI» и прочие «пауэры» все чаще всплывают в статьях и материалах о Microsoft Excel. По моему опыту, далеко не все ясно представляют себе что скрывается за этими понятиями, как они между собой взаимосвязаны и как могут помочь простому пользователю Excel.
Давайте проясним ситуацию.
Power Query
Еще в 2013 году специально созданная группа разработчиков внутри Microsoft выпустила для Excel бесплатную надстройку Power Query (другие названия — Data Explorer, Get&Transform), которая умеет массу полезных для повседневной работы вещей:
- Загружать данные в Excel из почти 40 различных источников, среди которых базы данных (SQL, Oracle, Access, Teradata…), корпоративные ERP-системы (SAP, Microsoft Dynamics, 1C…), интернет-сервисы (Facebook, Google Analytics, почти любые сайты).
- Собирать данные из файлов всех основных типов данных (XLSX, TXT, CSV, JSON, HTML, XML…), как поодиночке, так и сразу оптом — из всех файлов указанной папки. Из книг Excel можно автоматически загружать данные сразу со всех листов.
- Зачищать полученные данные от «мусора»: лишних столбцов или строк, повторов, служебной информации в «шапке», лишних пробелов или непечатаемых символов и т.п.
- Приводить данные в порядок: исправлять регистр, числа-как-текст, заполнять пробелы, добавлять правильную «шапку» таблицы, разбирать «слипшийся» текст на столбцы и склеивать обратно, делить дату на составляющие и т.д.
- Всячески трансформировать таблицы, приводя их в желаемый вид (фильтровать, сортировать, менять порядок столбцов, транспонировать, добавлять итоги, разворачивать кросс-таблицы в плоские и сворачивать обратно).
- Подставлять данные из одной таблицы в другую по совпадению одного или нескольких параметров, т.е. прекрасно заменяет функцию ВПР (VLOOKUP) и ее аналоги.
Power Query встречается в двух вариантах: как отдельная надстройка для Excel 2010-2013, которую можно скачать с официального сайта Microsoft и как часть Excel 2016. В первом случае после установки в Excel появляется отдельная вкладка:

В Excel 2016 весь функционал Power Query уже встроен по умолчанию и находится на вкладке Данные (Data) в виде группы Получить и преобразовать (Get & Transform):

Возможности этих вариантов совершенно идентичны.
Принципиальной особоенностью Power Query является то, что все действия по импорту и трансформации данных запоминаются в виде запроса — последовательности шагов на внутреннем языке программирования Power Query, который лаконично называется «М». Шаги можно всегда отредактировать и воспроизвести повторно любое количество раз (обновить запрос).
Основное окно Power Query обычно выглядит примерно так:
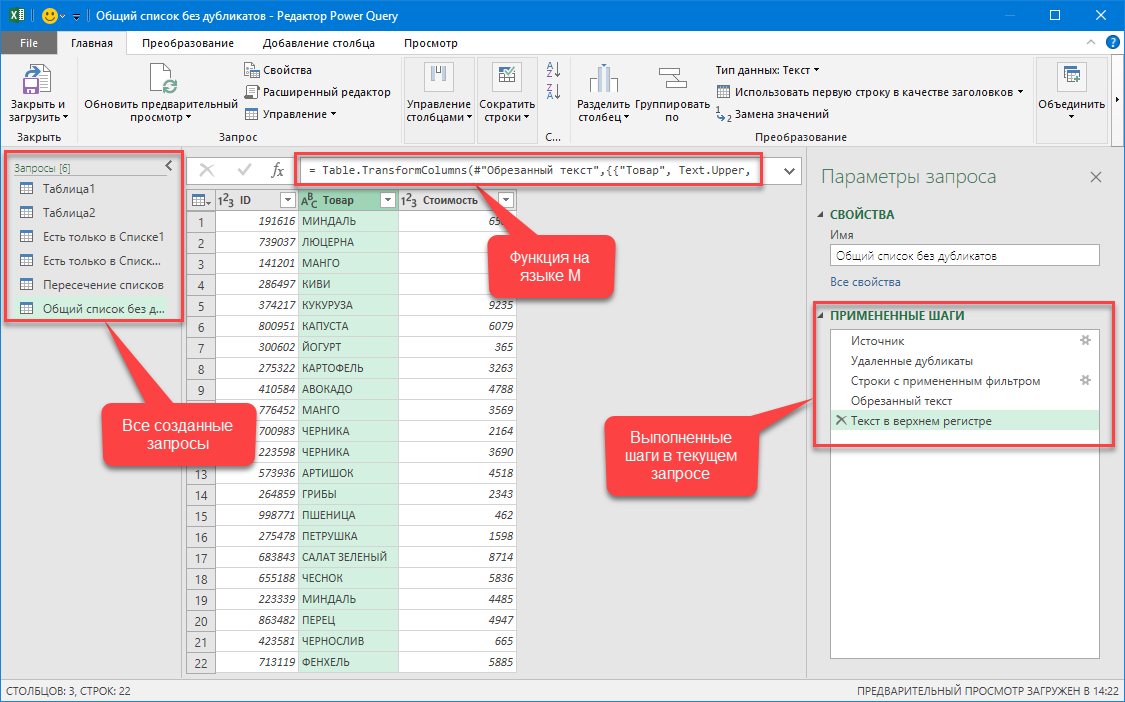
По моему мнению, это самая полезная для широкого круга пользователей надстройка из всех перечисленных в этой статье. Очень много задач, для которых раньше приходилось либо жутко извращаться с формулами, либо писать макросы — теперь легко и красиво делаются в Power Query. Да еще и с последующим автоматическим обновлением результатов. А учитывая бесплатность, по соотношению «цена-качество» Power Query просто вне конкуренции и абсолютный must have для любого средне-продвинутого пользователя Excel в наши дни.
Power Pivot
Power Pivot — это тоже надстройка для Microsoft Excel, но предназначенная немного для других задач. Если Power Query сосредоточена на импорте и обработке, то Power Pivot нужен, в основном, для сложного анализа больших объемов данных. В первом приближении, можно думать о Power Pivot как о прокачанных сводных таблицах.

Общие принципы работы в Power Pivot следующие:
- Сначала мы загружаем данные в Power Pivot — поддерживается 15 различных источников: распространенные БД (SQL, Oracle, Access…), файлы Excel, текстовые файлы, веб-каналы данных. Кроме того, можно использовать Power Query как источник данных, что делает анализ почти всеядным.
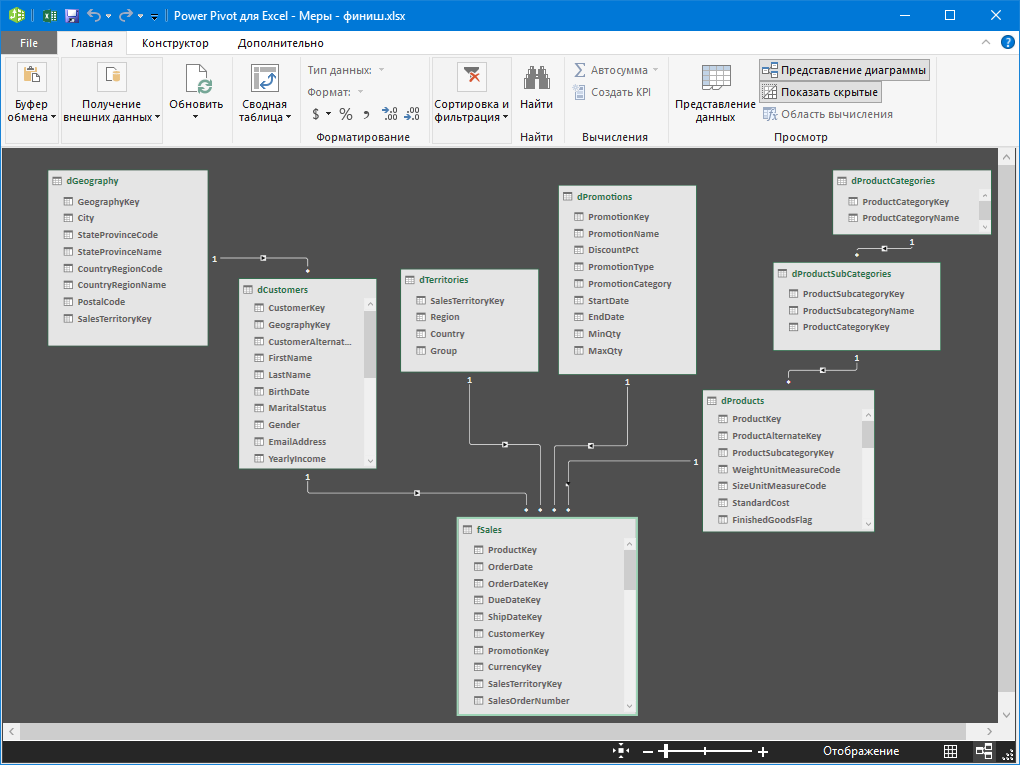
- Затем между загруженными таблицами настраиваются связи или, как еще говорят, создается Модель Данных. Это позволит в будущем строить отчеты по любым полям из имеющихся таблиц так, будто это одна таблица. И никаких ВПР опять же.
- При необходимости, в Модель Данных добавляют дополнительные вычисления с помощью вычисляемых столбцов (аналог столбца с формулами в «умной таблице») и мер (аналог вычисляемого поля в сводной). Всё это пишется на специальном внутреннем языке Power Pivot, который называется DAX (Data Analysis eXpressions).
- На листе Excel по Модели Данных строятся интересующие нас отчеты в виде сводных таблиц и диаграмм.
Главное окно Power Pivot выглядит примерно так:
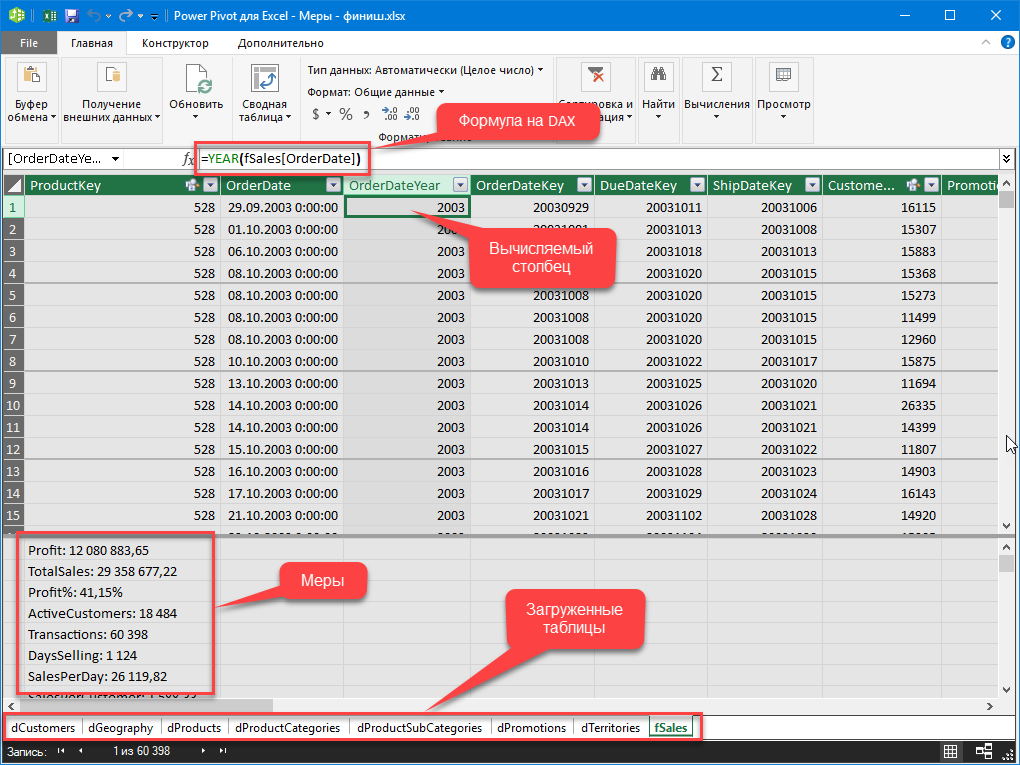
А так выглядит Модель Данных, т.е. все загруженные таблицы с созданными связями:
У Power Pivot есть ряд особенностей, делающих её уникальным инструментом для некоторых задач:
- В Power Pivot нет предела по количеству строк (как в Excel). Можно грузить таблицы любого размера и спокойно работать с ними.
- Power Pivot очень хорошо умеет сжимать данные при загрузке их в Модель. 50 Мб исходный текстовый файл может легко превратиться в 3-5 Мб после загрузки.
- Поскольку «под капотом» у Power Pivot, по сути, полноценный движок базы данных, то с большими объемами информации он справляется очень быстро. Нужно проанализировать 10-15 млн. записей и построить сводную? И все это на стареньком ноутбуке? Без проблем!
К сожалению, пока что Power Pivot входит не во все версии Excel. Если у вас Excel 2010, то скачать её можно бесплатно с сайта Microsoft. А вот если у вас Excel 2013-2016, то всё зависит от вашей лицензии, т.к. в некоторых вариантах она включена (Office Pro Plus, например), а в некоторых нет (Office 365 Home, Office 365 Personal и т.д.) Подробнее об этом можно почитать тут.
Power Maps
Эта надстройка впервые появилась в 2013 году и первоначально называлась GeoFlow. Она предназначена для визуализации гео-данных, т.е. числовой информации на географических картах. Исходные данные для отображения берутся все из той же Модели Данных Power Pivot (см. предыдущий пункт).
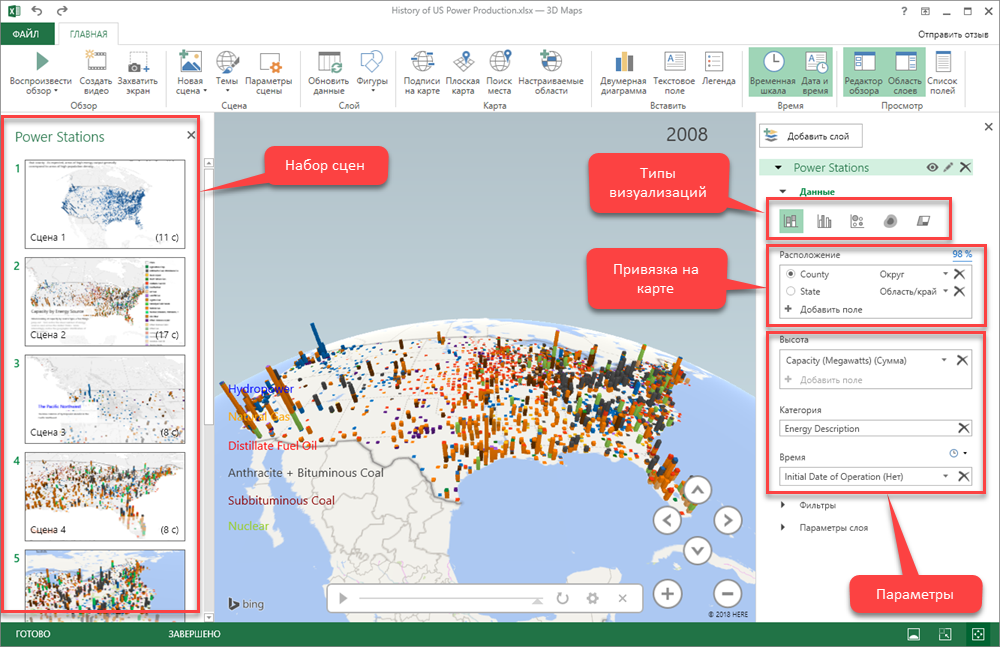
Демо-версию Power Map (почти не отличающуюся от полной по возможностям, кстати) можно совершенно бесплатно загрузить опять же с сайта Microsoft. Полная же версия включена в некоторые пакеты Microsoft Office 2013-2016 вместе с Power Pivot — в виде кнопки 3D-карта на вкладке Вставка (Insert — 3D-map):
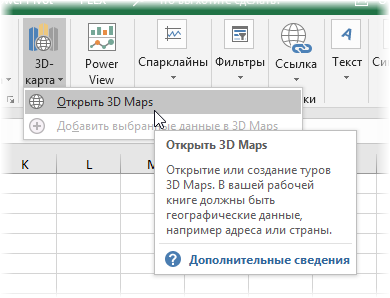
Ключевые особенности Power Map:
- Карты могут быть как плоскими, так и объемными (земной шар).
- Можно использовать несколько разных типов визуализации (гистограммы, пузырьковые диаграммы, тепловые карты, заливку областями).
- Можно добавлять измерение времени, т.е. анимировать процесс и смотреть на него в развитии.
- Карты подгружаются из сервиса Bing Maps, т.е. для просмотра нужен весьма шустрый доступ в интернет. Иногда возникают сложности с правильным распознаванием адресов, т.к. названия в данных не всегда совпадают с Bing Maps.
- В полной (не демо) версии Power Map можно использовать собственные загружаемые карты, например визуализировать посетителей торгового центра или цены на квартиры в жилом доме прямо на строительном плане.
- На основе созданных гео-визуализаций можно прямо в Power Map создавать видеоролики (пример), чтобы поделиться ими потом с теми, у кого надстройка не установлена или включить в презентацию Power Point.
Power View
Эта надстройка появилась впервые в составе Excel 2013 и предназначена для «оживления» ваших данных — построения интерактивных графиков, диаграмм, карт и таблиц. Иногда для этого используют термины дашборд (dashboard) или панель показателей (scorecard). Суть в том, что вы можете вставить в ваш файл Excel специальный лист без ячеек — слайд Power View, куда добавить текст, картинки и массу различного типа визуализаций по вашим данным из Модели Данных Power Pivot.
Выглядеть это будет примерно так:
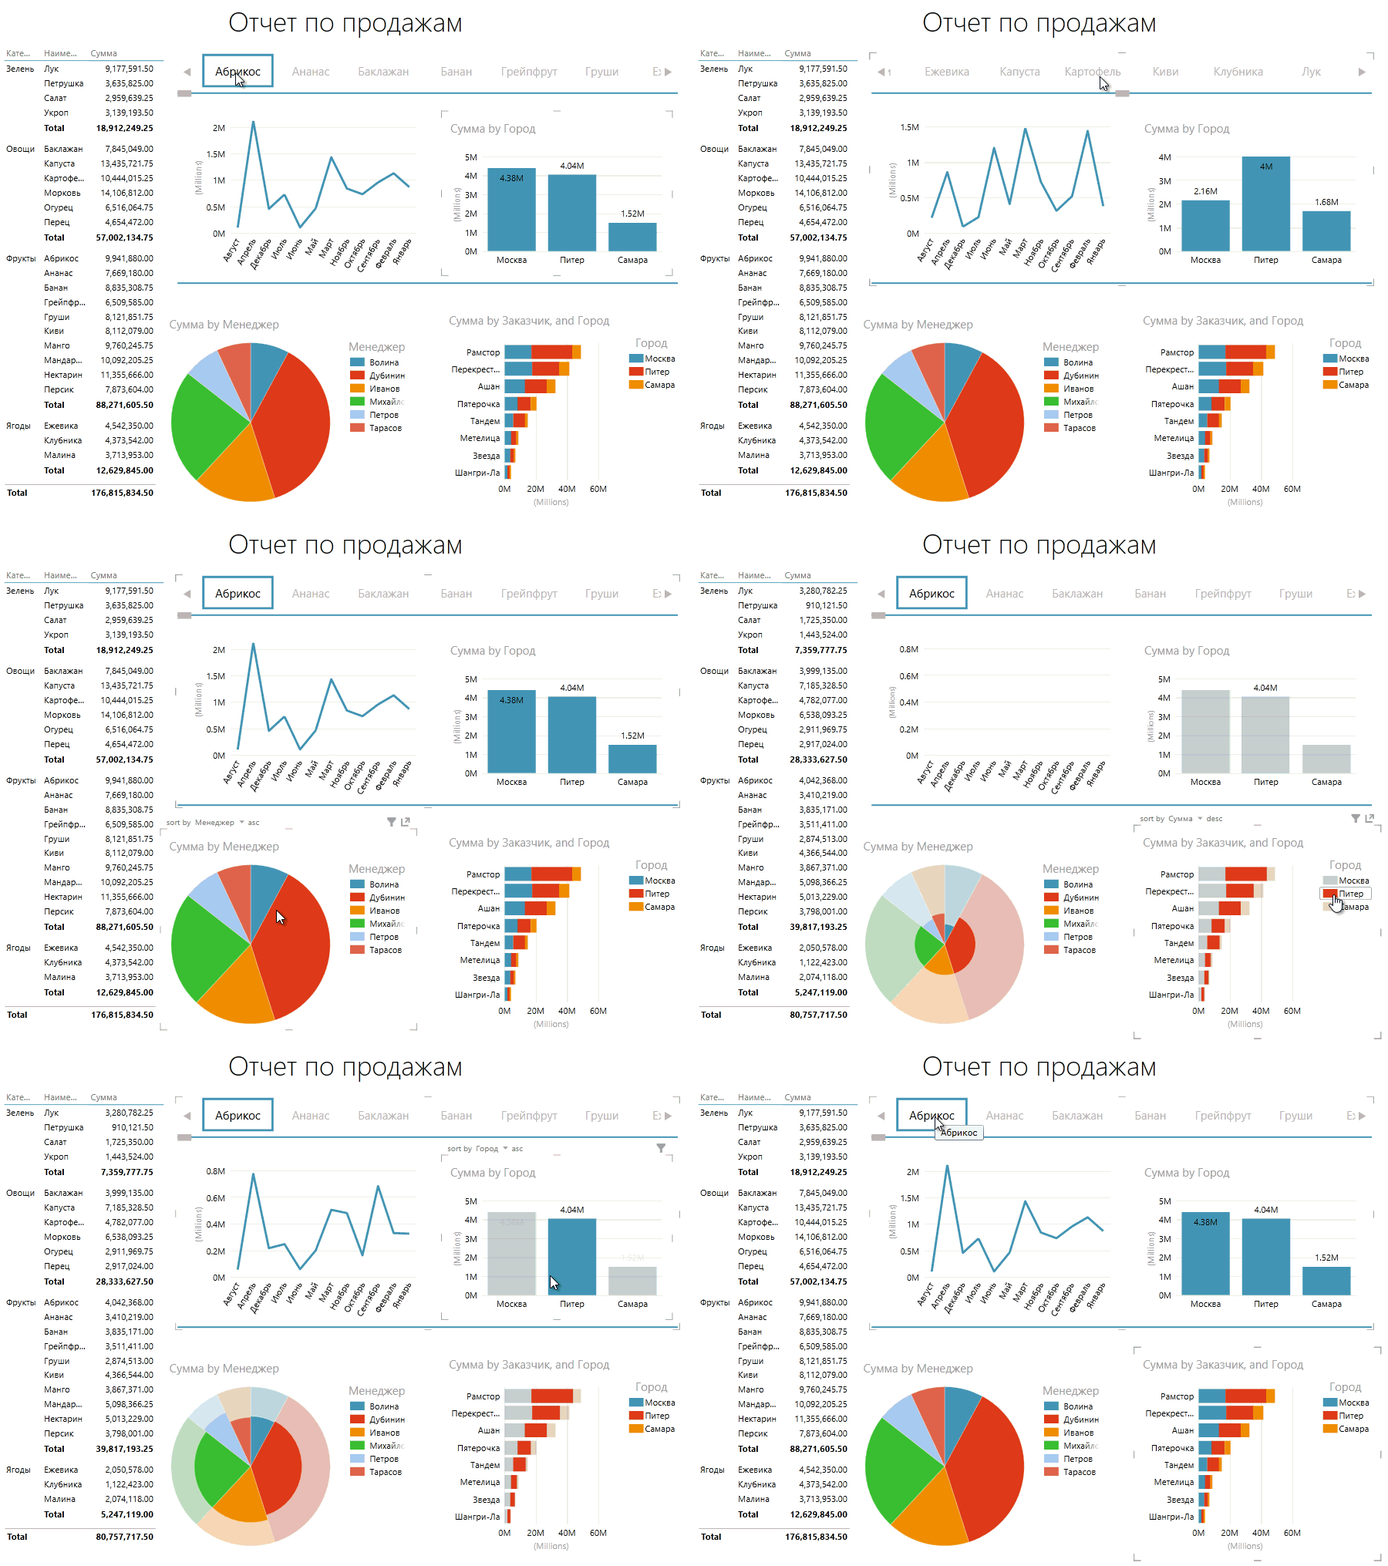
Нюансы тут такие:
- Исходные данные берутся всё оттуда же — из Модели Данных Power Pivot.
- Для работы с Power View необходимо установить на вашем компьютере Silverlight — майкрософтовский аналог Flash (бесплатный).
На сайте Microsoft, кстати, есть весьма приличный обучающий курс по Power View на русском языке.
Power BI
В отличие от предыдущих, Power BI — это не надстройка для Excel, а отдельный продукт, представляющий собой целый комплекс средств для бизнес- анализа и визуализации. Он состоит из трех ключевых элементов:
1. Power BI Desktop — программа для анализа и визуализации данных, включающая в себя, помимо прочего, весь функционал надстроек Power Query и Power Pivot + улучшенные механизмы визуализации из Power View и Power Map. Скачать и установить её можно совершенно бесплатно с сайта Microsoft.
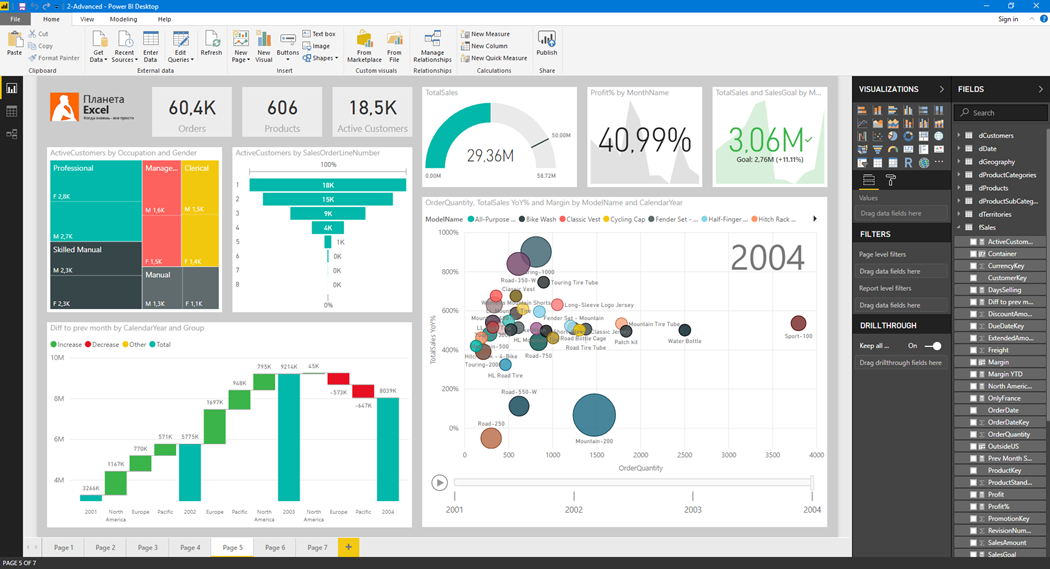
В Power BI Desktop можно:
- Загружать данные из более чем 70 различных источников (как в Power Query + дополнительные коннекторы).
- Связывать таблицы в модель (как в Power Pivot)
- Добавлять к данным дополнительные вычисления с помощью мер и вычисляемых столбцов на DAX (как в Power Pivot)
- Создавать на основе данных красивейшие интерактивные отчеты с разного типа визуализациями (очень похоже на Power View, но еще лучше и мощнее).
- Публиковать созданные отчеты на сайте Power BI Service (см. следующий пункт) и делиться ими с коллегами. Причем есть возможность давать разные права (чтение, редактирование) разным людям.
2. Онлайн-сервис Power BI — упрощенно говоря, это сайт, где у вас и у каждого пользователя в вашей компании будет своя «песочница» (workspace) куда можно загружать созданные в Power BI Desktop отчеты. Помимо просмотра, позволяет их даже редактировать, воспроизводя онлайн почти весь функционал Power BI Desktop. Также сюда можно заимствовать отдельные визуализации из чужих отчетов, собирая из них свои авторские дашборды.
Выглядит это примерно так:
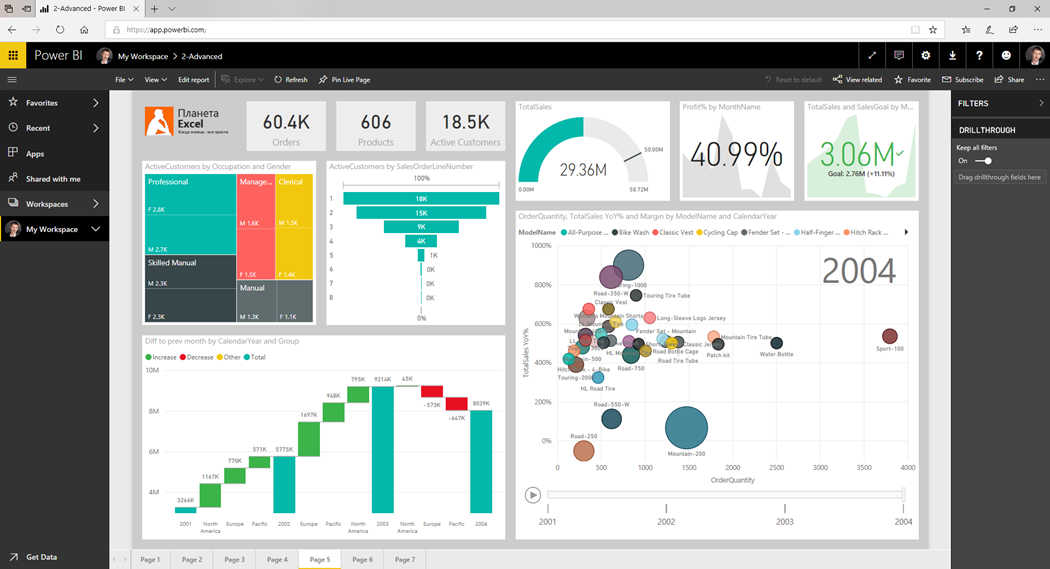
3. Power BI Mobile — приложение для iOS / Android / Windows для подключения к Power BI Service и удобного просмотра (не редактирования) созданных отчетов и дашбордов прямо на экране телефона или планшета. Скачать его (совершенно бесплатно) можно тут.
На iPhone, например, созданный выше отчет выглядит так:
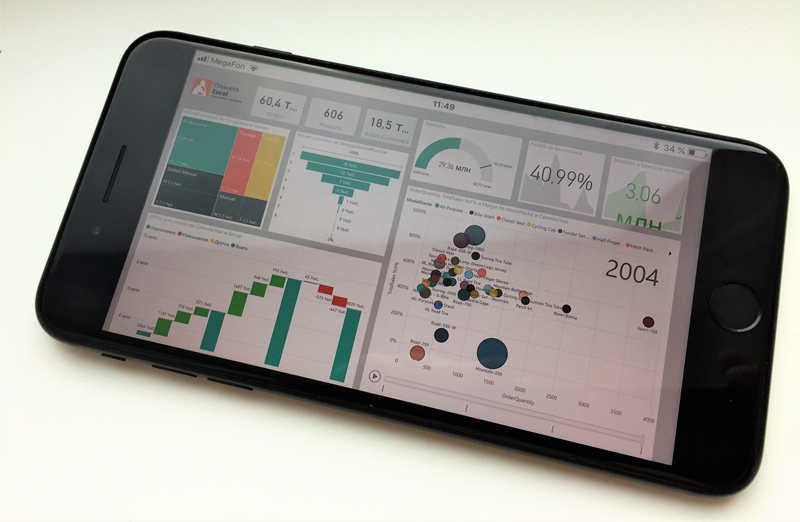
Причем всё это с сохранением интерактивностии и анимации + заточенность под тач и рисование по экрану пером. Очень удобно. Таким образом, бизнес-аналитика становится доступной всем ключевым лицам компании в любой момент и в любом месте — нужен только доступ в интернет.
Тарифные планы Power BI. Power BI Desktop и Mobile бесплатны изначально, большинство функций Power BI Service — тоже. Так что для персонального использования или применения в пределах небольшой компании за всё вышеперечисленное не нужно платить ни копейки и можно смело оставаться на плане Free. Если вы хотите делиться отчетами с коллегами и администрировать их права доступа, то придется перейти на Pro (10$ в месяц за пользователя). Есть еще Premium — для больших компаний (>500 пользователей), которым требуются для данных отдельные хранилища и серверные мощности.
Ссылки по теме
- Проектная диаграмма Ганта в Excel с помощью Power Query
- Как создать в Excel базу данных с помощью Power Pivot
- Визуализация движения по маршруту на карте в Power Map
Excel Power Pivot — Overview
Excel Power Pivot is an efficient, powerful tool that comes with Excel as an Add-in. With Power Pivot, you can load hundreds of millions of rows of data from external sources and manage the data effectively with its powerful xVelocity engine in a highly compressed form. This makes it possible to perform the calculations, analyze the data, and arrive at a report to draw conclusions and decisions. Thus, it would be possible for a person with hands-on experience with Excel, to perform the high-end data analysis and decision making in a matter of few minutes.
This tutorial will cover the following −
Power Pivot Features
What makes Power Pivot a strong tool is the set of its features. You will learn the various Power Pivot features in the chapter − Power Pivot Features.
Power Pivot Data from Various Sources
Power Pivot can collate data from various data sources to perform the required calculations. You will learn how to get data into Power Pivot, in the chapter − Loading Data into Power Pivot.
Power Pivot Data Model
The power of Power Pivot lies in its database- Data Model. The data is stored in the form of data tables in the Data Model. You can create relationships between the data tables to combine the data from different data tables for analysis and reporting. The chapter − Understanding Data Model (Power Pivot Database) gives you the details about the Data Model.
Managing Data Model and Relationships
You need to know how you can manage the data tables in the Data Model and the relationships between them. You will get the details of these in the chapter − Managing Power Pivot Data Model.
Creating Power Pivot Tables and Power Pivot Charts
Power PivotTables and Power Pivot Charts provide you a way to analyze the data for arriving at conclusions and/or decisions.
You will learn how to create Power PivotTables in the chapters − Creating a Power PivotTable and Flattened PivotTables.
You will learn how to create Power PivotCharts in the chapter − Power PivotCharts.
DAX Basics
DAX is the language used in Power Pivot to perform calculations. The formulas in DAX are similar to Excel formulas, with one difference − while the Excel formulas are based on individual cells, DAX formulas are based on columns (fields).
You will understand the basics of DAX in the chapter − Basics of DAX.
Exploring and Reporting Power Pivot Data
You can explore the Power Pivot Data that is in the Data Model with Power PivotTables and Power Pivot Charts. You will get to learn how you can explore and report data throughout this tutorial.
Hierarchies
You can define data hierarchies in a data table so that it would be easy to handle related data fields together in Power PivotTables. You will learn the details of the creation and usage of Hierarchies in the chapter − Hierarchies in Power Pivot.
Aesthetic Reports
You can create aesthetic reports of your data analysis with Power Pivot Charts and/or Power Pivot Charts. You have several formatting options available to highlight the significant data in the reports. The reports are interactive in nature, enabling the person looking at the compact report to view any of the required details quickly and easily.
You will learn these details in the chapter − Aesthetic Reports with Power Pivot Data.
Excel Power Pivot — Installing
Power Pivot in Excel provides a Data Model connecting various different data sources based on which the data can be analyzed, visualized, and explored. The easy-to-use interface provided by Power Pivot enables a person with hands-on experience in Excel to effortlessly load data, manage the data as data tables, create relationships among the data tables, and perform the required calculations to arrive at a report.
In this chapter, you will learn, what makes Power Pivot a strong and sought after tool for analysts and decision makers.
Power Pivot on the Ribbon
The first step to proceed with Power Pivot is to ensure that the POWERPIVOT tab is available on the Ribbon. If you have Excel 2013 or later versions, the POWERPIVOT tab appears on the Ribbon.
If you have Excel 2010, POWERPIVOT tab might not appear on the Ribbon if you have not already enabled the Power Pivot add-in.
Power Pivot Add-in
Power Pivot Add-in is a COM Add-in that needs to be enabled to get the complete features of Power Pivot in Excel. Even when POWERPIVOT tab appears on the ribbon, you need to ensure that the add-in is enabled to access all the features of Power Pivot.
Step 1 − Click the FILE tab on the Ribbon.
Step 2 − Click Options in the dropdown list. The Excel Options dialog box appears.
Step 3 − Follow the instructions as follows.
-
Click Add-Ins.
-
In the Manage box, select COM Add-ins from the dropdown list.
-
Click the Go button. The COM Add-Ins dialog box appears.
-
Check Power Pivot and click OK.
What is Power Pivot?
Excel Power Pivot is a tool for integrating and manipulating large volumes of data. With Power Pivot, you can easily load, sort and filter data sets that contain millions of rows and perform the required calculations. You can utilize Power Pivot as an ad hoc reporting and analytics solution.
The Power Pivot Ribbon as shown below has various commands, ranging from managing Data Model to creating reports.
The Power Pivot window will have the Ribbon as shown below −
Why is Power Pivot a Strong Tool?
When you invoke Power Pivot, Power Pivot creates data definitions and connections that get stored with your Excel file in a compressed form. When the data at the source is updated, it is refreshed automatically in your Excel file. This facilitates the usage of the data maintained elsewhere but is required for study time-to-time study and arriving at decisions. The source data can be in any form − ranging from a text file or a web page to the different relational databases.
The user-friendly interface of Power Pivot in the PowerPivot window enables you to perform data operations without the knowledge of any database query language. You can then create a report of your analysis within few seconds. The reports are versatile, dynamic and interactive and enable you to further probe into the data to get the insights and arrive at the conclusions / decisions.
The data that you work on in Excel and in the Power Pivot window is stored in an analytical database inside the Excel workbook, and a powerful local engine loads, queries, and updates the data in that database. Since the data is in Excel, it is immediately available to PivotTables, PivotCharts, Power View, and other features in Excel that you use to aggregate and interact with the data. The data presentation and interactivity is provided by Excel and the data and Excel presentation objects are contained within the same workbook file. Power Pivot supports files up to 2GB in size and enables you to work with up to 4GB of data in memory.
Power Features to Excel with Power Pivot
Power Pivot features are free with Excel. Power Pivot has enhanced the Excel performance with power features that include the following −
-
Ability to handle large data volumes, compressed into small files, with amazing speed.
-
Filter data and rename columns and tables while importing.
-
Organize tables into individual tabbed pages in the Power Pivot window as against the Excel tables distributed all over the workbook or multiple tables in the same worksheet.
-
Create relationships among the tables, so as to analyze the data in the tables collectively. Before Power Pivot, one had to rely on heavy usage of VLOOKUP function to combine the data into a single table before such analysis. This used to be laborious and error-prone.
-
Add power to the simple PivotTable with many added features.
-
Provide Data Analysis Expressions (DAX) language to write advanced formulas.
-
Add calculated fields and calculated columns to the data tables.
-
Create KPIs to use in PivotTables and Power View reports.
You will understand the Power Pivot features in detail in the next chapter.
Uses of Power Pivot
You can use Power Pivot for the following −
-
To perform powerful data analysis and create sophisticated Data Models.
-
To mash-up large volumes of data from several different sources quickly.
-
To perform information analysis and share the insights interactively.
-
To write advanced formulas with the Data Analysis Expressions (DAX) language.
-
To create Key Performance Indicators (KPIs).
Data Modelling with Power Pivot
Power Pivot provides advanced data modeling features in Excel. The data in the Power Pivot is managed in the Data Model that is also referenced as Power Pivot database. You can use Power Pivot to help you gain new insights into your data.
You can create relationships between data tables so that you can perform data analysis on the tables collectively. With DAX, you can write advanced formulas. You can create calculated fields and calculated columns in the data tables in the Data Model.
You can define Hierarchies in the data to use everywhere in the workbook, including Power View. You can create KPIs to use in PivotTables and Power View reports to show at a glance whether performance is on or off target for one or more metrics.
Business Intelligence with Power Pivot
Business intelligence (BI) is essentially the set of tools and processes that people use to gather data, turn it into meaningful information, and then make better decisions. The BI capabilities of Power Pivot in Excel enable you to gather data, visualize data, and share information with people in your organization across multiple devices.
You can share your workbook to a SharePoint environment that has Excel Services enabled. On the SharePoint server, Excel Services processes and renders the data in a browser window where others can analyze the data.
Excel Power Pivot — Features
The most important and powerful feature of Power Pivot is its database − Data Model. The next significant feature is the xVelocity in-memory analytics engine that makes it possible to work on large multiple databases in a matter of few minutes. There are some more important features that come with the PowerPivot Add-in.
In this chapter, you will get a brief overview of the features of Power Pivot, which are illustrated in detail later.
Loading Data from External Sources
You can load data into Data Model from external sources in two ways −
-
Load data into Excel and then create a Power Pivot Data Model.
-
Load data directly into Power Pivot Data Model.
The second way is more efficient because of the efficient way Power Pivot handles the data in memory.
For more details, refer to chapter − Loading Data into Power Pivot.
Excel Window and Power Pivot Window
When you start working with Power Pivot, two windows will open simultaneously − Excel window and Power Pivot window. It is through PowerPivot window that you can load data into Data Model directly, view the data in Data View and Diagram View, Create relationships between tables, manage the relationships, and create the Power PivotTable and/or PowerPivot Chart reports.
You need not have the data in Excel tables when you are importing data from external sources. If you have data as Excel tables in the workbook, you can add them to Data Model, creating data tables in Data Model that are linked to the Excel tables.
When you create a PivotTable or PivotChart from Power Pivot window, they are created in the Excel window. However, the data is still managed from Data Model.
You can always switch between the Excel window and Power Pivot window anytime, easily.
Data Model
The Data Model is the most powerful feature of Power Pivot. The data that is obtained from various data sources is maintained in Data Model as data tables. You can create relationships between the data tables so that you can combine the data in the tables for analysis and reporting.
You will learn in detail about the Data Model in the chapter − Understanding Data Model (Power Pivot Database).
Memory Optimization
Power Pivot Data Model uses xVelocity storage, which is highly compressed when data is loaded into memory that makes it possible to store hundreds of millions of rows in memory.
Thus, if you load data directly into Data Model, you will be doing it in the efficient highly compressed form.
Compact File Size
If the data is loaded directly into Data Model, when you save the Excel file, it occupies very less space on the hard disk. You can compare the Excel file sizes, the first one with loading data into Excel and then creating the Data Model and the second with loading data directly into the Data Model skipping the first step. The second one will be up to 10 times smaller than the first one.
Power PivotTables
You can create the Power PivotTables from Power Pivot window. The PivotTables so created are based on the data tables in the Data Model, making it possible to combine data from the related tables for analysis and reporting.
Power PivotCharts
You can create the Power PivotCharts from Power Pivot window. The PivotCharts so created are based on the data tables in the Data Model, making it possible to combine data from the related tables for analysis and reporting. The Power PivotCharts have all the features of Excel PivotCharts and many more such as field buttons.
You can also have combinations of Power PivotTable and Power PivotChart.
DAX Language
The strength of Power Pivot comes from the DAX Language that can be used effectively on the Data Model to perform calculations on the data in the data tables. You can have Calculated Columns and Calculated Fields defined by DAX that can be used in the Power PivotTables and Power PivotCharts.
Excel Power Pivot — Loading Data
In this chapter, we will learn to load data into Power Pivot.
You can load data into Power Pivot in two ways −
-
Load data into Excel and add it to the Data Model
-
Load data into PowerPivot directly, populating the Data Model, which is the PowerPivot database.
If you want the data for Power Pivot, do it the second way, without Excel even knowing about it. This is because you will be loading the data only once, in highly compressed format. To understand the magnitude of difference, suppose you load data into Excel by first adding it to the Data Model, the file size is say 10 MB.
If you load data into PowerPivot, and hence into Data Model skipping the extra step of Excel, your file size could be as less as 1 MB only.
Data Sources Supported by Power Pivot
You can either import data into the Power Pivot Data Model from various data sources or establish connections and/or use the existing connections. Power Pivot supports the following data sources −
-
SQL Server relational database
-
Microsoft Access database
-
SQL Server Analysis Services
-
SQL Server Reporting Services (SQL 2008 R2)
-
ATOM data feeds
-
Text files
-
Microsoft SQL Azure
-
Oracle
-
Teradata
-
Sybase
-
Informix
-
IBM DB2
-
Object Linking and Embedding Database/Open Database Connectivity
- (OLEDB/ODBC) sources
-
Microsoft Excel File
-
Text File
Loading Data Directly into PowerPivot
To load data directly into Power Pivot, perform the following −
-
Open a new workbook.
-
Click on the POWERPIVOT tab on the ribbon.
-
Click on Manage in the Data Model group.
The PowerPivot window opens. Now you have two windows − the Excel workbook window and the PowerPivot for Excel window that is connected to your workbook.
-
Click the Home tab in the PowerPivot window.
-
Click From Database in the Get External Data group.
-
Select From Access.
The Table Import Wizard appears.
-
Browse to the Access database file.
-
Provide Friendly connection name.
-
If the database is password protected, fill in those details also.
Click the Next → button. The Table Import Wizard displays the options for choosing how to import data.
Click Select from a list of tables and views to choose the data to import.
Click the Next → button. The Table Import Wizard displays the tables and views in the Access database that you have selected.
Check the box Medals.
As you can observe, you can select the tables by checking the boxes, preview and filter the tables before adding to Pivot Table and/or select the related tables.
Click the Preview & Filter button.
As you can see, you can select specific columns by checking the boxes in the column labels, filter the columns by clicking the dropdown arrow in the column label to select the values to be included.
-
Click OK.
-
Click the Select Related Tables button.
-
Power Pivot checks what other tables are related to the selected Medals table, if a relation exists.
You can see that Power Pivot found that the table Disciplines are related to the table Medals and selected it. Click Finish.
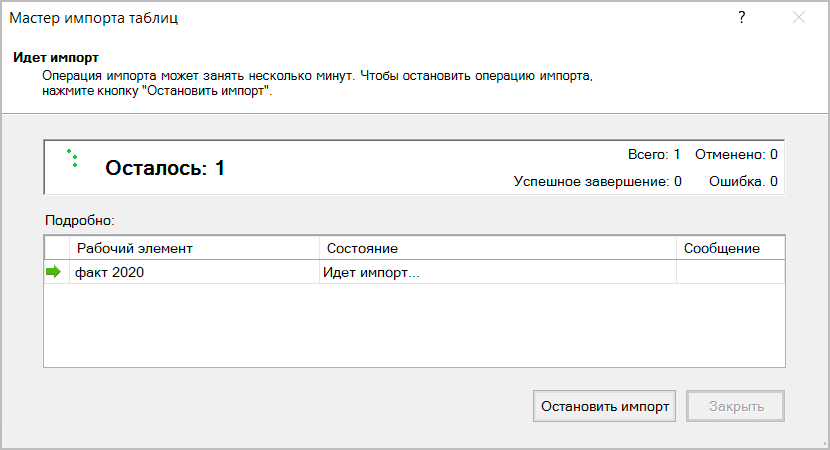
Table Import Wizard displays − Importing and shows the status of the import. This will take a few minutes and you can stop the import by clicking the Stop Import button.
Once the data is imported, the Table Import Wizard displays – Success and shows the results of the import as shown in the screenshot below. Click Close.
Power Pivot displays the two imported tables in two tabs.
You can scroll through the records (rows of the table) using the Record arrows below the tabs.
Table Import Wizard
In the previous section, you have learnt how to import data from Access through the Table Import Wizard.
Note that the Table Import Wizard options change as per the data source that is selected to connect to. You might want to know what data sources you can choose from.
Click From Other Sources in the Power Pivot window.
The Table Import Wizard – Connect to a Data Source appears. You can either create a connection to a data source or you can use one that already exists.
You can scroll through the list of connections in the Import Table Wizard to know the compatible data connections to Power Pivot.
-
Scroll down to the Text Files.
-
Select Excel File.
-
Click the Next → button. The Table Import Wizard displays – Connect to a Microsoft Excel File.
-
Browse to the Excel file in the Excel File Path box.
-
Check the box – Use first row as column headers.
-
Click the Next → button. The Table Import Wizard displays − Select Tables and Views.
-
Check the box Product Catalog$. Click the Finish button.
You will see the following Success message. Click Close.
You have imported one table, and you have also, created a connection to the Excel file that contains several other tables.
Opening Existing Connections
Once you have established a connection to a data source, you can open it later.
Click Existing Connections in the PowerPivot window.
The Existing Connections dialog box appears. Select Excel Sales Data from the list.
Click the Open button. The Table Import Wizard appears displaying the tables and views.
Select the tables that you want to import and click Finish.
The selected five tables will be imported. Click Close.
You can see that the five tables are added to the Power Pivot, each in a new tab.
Creating Linked Tables
Linked tables are a live link between the table in Excel and the table in the Data Model. Updates to the table in Excel automatically update the data in the data table in the model.
You can link the Excel table into Power Pivot in a few steps as follows −
-
Create an Excel table with the data.
-
Click the POWERPIVOT tab on the Ribbon.
-
Click Add to Data Model in the Tables group.
The Excel table is linked to the corresponding Data Table in PowerPivot.
You can see that the Table Tools with the tab — Linked Table is added to the Power Pivot window. If you click Go to Excel Table, you will switch to the Excel worksheet. If you click Manage, you will switch back to the linked table in the Power Pivot window.
You can update the linked table either automatically or manually.
Note that you can link an Excel table only if it is present in the workbook with the Power Pivot. If you have Excel tables in a separate workbook, then you have to load them as explained in the next section.
Loading from Excel Files
If you want to load the data from Excel workbooks, keep the following in mind −
-
Power Pivot considers the other Excel workbook as a database and only worksheets are imported.
-
Power Pivot loads each worksheet as a table.
-
Power Pivot cannot recognize single tables. Hence, Power Pivot cannot recognize if there are multiple tables on a worksheet.
-
Power Pivot cannot recognize any additional information other than the table on a worksheet.
Hence, keep each table in a separate worksheet.
Once your data in the workbook is ready, you can import the data as follows −
-
Click From Other Sources in the Get External Data group in the Power Pivot window.
-
Proceed as given in the section − Table Import Wizard.
The following are the differences between linked Excel tables and imported Excel tables −
-
Linked tables need to be in the same Excel workbook in which the Power Pivot database is stored. If the data already exists in other Excel workbooks, there is no point in using this feature.
-
The Excel import feature allows you to load data from different Excel workbooks.
-
Loading data from an Excel workbook does not create a link between the two files. Power Pivot creates only a copy of the data, while importing.
-
When the original Excel file is updated, data in the Power Pivot will not be refreshed. You need to either set the update mode to automatic or update the data manually, in the Linked Table tab of the Power Pivot window.
Loading from Text Files
One of the popular data representation styles is with the format known as comma separated values (csv). Each data row /record is represented by a text line, wherein the columns /fields are separated by commas. Many databases provide the option of saving to a csv format file.
If you want to load a csv file into Power Pivot, you have to use the Text File option. Suppose you have the following text file with csv format −
-
Click the PowerPivot tab.
-
Click the Home tab in the PowerPivot window.
-
Click From Other Sources in the Get External Data group. The Table Import Wizard appears.
-
Scroll down to Text Files.
-
Click Text File.
-
Click the Next → button. Table Import Wizard appears with the display − Connect to Flat File.
-
Browse to the text file in the File Path box. The csv files usually have the first line representing column headers.
-
Check the box Use first row as column headers, if the first line has headers.
-
In the Column Separator box, default is Comma (,), but in case your text file has any other operator such as Tab, Semicolon, Space, Colon or Vertical Bar, then choose that operator.
As you can observe, there is a preview of your data table. Click Finish.
Power Pivot creates the data table in the Data Model.
Loading from the Clipboard
Suppose, you have data in an application that is not recognized by Power Pivot as a data source. To load this data into Power Pivot, you have two options −
-
Copy the data to an Excel file and use the Excel file as data source for Power Pivot.
-
Copy the data, so that it will be on the clipboard, and paste it into Power Pivot.
You have already learnt the first option in an earlier section. And this is preferable to the second option, as you will find at the end of this section. However, you should know how to copy data from clipboard into Power Pivot.
Suppose you have data in a word document as follows −
Word is not a data source for Power Pivot. Therefore, perform the following −
-
Select the table in the Word document.
-
Copy and Paste it in the PowerPivot window.
The Paste Preview dialog box appears.
-
Give the name as Word-Employee table.
-
Check the box Use first row as column headers and click OK.
The data copied into the clipboard will be pasted into a new data table in Power Pivot, with the tab − Word-Employee table.
Suppose, you want to replace this table with new content.
-
Copy the table from Word.
-
Click Paste Replace.
The Paste Preview dialog box appears. Verify the contents that you are using for replace.
Click OK.
As you can observe, the contents of the data table in Power Pivot are replaced by the contents in the clipboard.
Suppose you want to add two new rows of data to a data table. In the table in the Word document, you have the two news rows.
-
Select the two new rows.
-
Click Copy.
-
Click Paste Append in the Power Pivot window. The Paste Preview dialog box appears.
-
Verify the contents that you are using to append.
Click OK to proceed.
As you can observe, the contents of the data table in Power Pivot are appended with the contents in the clipboard.
In the beginning of this section, we have said that copying data to an excel file and using linked table is better than copying from clipboard.
This is because of the following reasons −
-
If you use linked table, you know the source of the data. On the other hand, you will not know the source of the data later or if it is used by a different person.
-
You have tracking information in the Word file, such as when the data is replaced and when the data is appended. However, there is no way of copying that information to Power Pivot. If you copy the data first to an excel file, you can preserve that information for later use.
-
While copying from clipboard, if you want to add some comments, you cannot do so. If you copy to Excel file first, you can insert comments in your Excel table that will be linked to the Power Pivot.
-
There is no way to refresh the data copied from clipboard. If the data is from a linked table, you can always ensure that the data is updated.
Refreshing Data in Power Pivot
You can refresh the data imported from the external data sources at any point of time.
If you want to refresh only one data table in the Power Pivot, do the following −
-
Click the tab of the data table.
-
Click Refresh.
-
Select Refresh from the dropdown list.
If you want to refresh all the data tables in the Power Pivot, do the following −
-
Click the Refresh button.
-
Select Refresh All from the dropdown list.
Excel Power Pivot — Data Model
A Data Model is a new approach introduced in Excel 2013 for integrating data from multiple tables, effectively building a relational data source inside an Excel workbook. Within Excel, Data Model is used transparently, providing tabular data used in PivotTables and PivotCharts. In Excel, you can access the tables and their corresponding values through the PivotTable / PivotChart Field lists that contain the table names and corresponding fields.
The main use of Data Model in Excel is its usage by Power Pivot. Data Model can be considered as the Power Pivot database, and all the power features of Power Pivot are managed with the Data Model. All data operations with Power Pivot are explicit in nature and can be visualized in the Data Model.
In this chapter, you will understand the Data Model in detail.
Excel and Data Model
There will be only one Data Model in an Excel workbook. When you work with Excel, Data Model usage is implicit. You cannot directly access the Data Model. You can only see the multiple tables in the Data Model in the Fields list of PivotTable or PivotChart and use them. Creating the Data Model and adding data is also done implicitly in Excel, while you are getting external data into Excel.
If you want to look at the Data Model, you can do so as follows −
-
Click the POWERPIVOT tab on the Ribbon.
-
Click Manage.
Data Model, if exists in the workbook, will be displayed as tables, each one with a tab.
Note − If you add an Excel table to Data Model, you will not transform the Excel table into a data table. A copy of the Excel table is added as a data table in the Data Model and a link is created between the two. Hence, if changes are done in the Excel table, the data table also is updated. However, from the storage point of view, there are two tables.
Power Pivot and Data Model
Data Model is inherently the database for Power Pivot. Even when you create the Data Model from Excel, it builds the Power Pivot database only. Creating the Data Model and/or adding data is done explicitly in Power Pivot.
In fact, you can manage the Data Model from Power Pivot window. You can add data to Data Model, import data from different data sources, view the Data Model, create relationships between the tables, create calculated fields and calculated columns, etc.
Creating a Data Model
You can either add tables to the Data Model from Excel or you can directly import data into Power Pivot, thus creating the Power Pivot Data Model tables. You can view the Data Model by clicking Manage in the Power Pivot window.
You will understand how to add tables from Excel to the Data Model in the chapter – Loading Data through Excel. You will understand how to load data into Data Model in the chapter – Loading Data into Power Pivot.
Tables in Data Model
Tables in Data Model can be defined as a set of tables holding relationships across them. The relationships enable combining related data from different tables for analysis and reporting purposes.
The tables in the Data Model are called Data Tables.
A table in the Data Model is considered as a set of records (a record is a row) made up of fields (a field is a column). You cannot edit individual items in a data table. However, you can append rows or add calculated columns to the data table.
Excel Tables and Data Tables
Excel tables are just a collection of separate tables. There can be multiple tables on a worksheet. Each table can be accessed separately, but it is not possible to access data from more than one Excel table at the same time. This is the reason that when you create a PivotTable, it is based on only one table. If you need to use the data from two Excel tables collectively, you need to first merge them into a single Excel table.
A data table on the other hand coexists with other data tables with relationships, facilitating the combination of data from multiple tables. Data tables get created when you import data into Power Pivot. You can also add Excel tables to the Data Model while you are creating a Pivot Table getting external data or from multiple tables.
The data tables in the Data Model can be viewed in two ways −
-
Data View.
-
Diagram View.
Data View of Data Model
In the data view of the Data Model, each data table exists on a separate tab. The data table rows are the records and columns represent the fields. The tabs contain the table names and the column headers are the fields in that table. You can do calculations in the data view using the Data Analysis Expressions (DAX) language.
Diagram View of Data Model
In the diagram view of the Data Model, all the data tables are represented by boxes with the table names and contain the fields in the table. You can arrange the tables in the diagram view by just dragging them. You can adjust the size of a data table so that all the fields in the table are displayed.
Relationships in Data Model
You can view the relationships in the diagram view. If two tables have a relationship defined between them, an arrow connecting the source table to the target table appears. If you want to know which fields are used in the relationship, just double click the arrow. The arrow and the two fields in the two tables are highlighted.
Table relationships will be created automatically if you import related tables that have primary and foreign key relationships. Excel can use the imported relationship information as the basis for table relationships in the Data Model.
You can also explicitly create relationships in either of the two views −
-
Data View − Using Create Relationship dialog box.
-
Diagram View − By clicking and dragging to connect the two tables.
Create Relationship Dialog Box
In a relationship, four entities are involved −
-
Table − The data table from which the relationship starts.
-
Column − The field in the Table that is also present in the related table.
-
Related Table − The data table where the relationship ends.
-
Related Column − The field in the related table that is same as the field represented by Column in Table. Note that the values of Related Column should be unique.
In the diagram view, you can create the relationship by clicking on the field in the table and dragging to the related table.
You will learn more about relationships in the chapter — Managing Data Tables and Relationships with Power Pivot.
Excel Power Pivot — Managing Data Model
The major use of Power Pivot is its ability to manage the data tables and the relationships among them, to facilitate analysis of the data from several tables. You can add an excel table to the Data Model while you are creating a PivotTable or directly from the PowerPivot Ribbon.
You can analyze data from across multiple tables only when relationships exist among them. With Power Pivot, you can create relationships from the Data View or Diagram View. Moreover, if you had chosen to add a table to the Power Pivot, you need to add a relationship as well.
Adding Excel Tables to Data Model with PivotTable
When you create a PivotTable in Excel, it is based only on a single table / range. In case you want to add more tables to the PivotTable, you can do so with the Data Model.
Suppose you have two worksheets in your workbook −
-
One containing the data of salespersons and the regions they represent, in a table- Salesperson.
-
Another containing the data of sales, region and month wise, in a table – Sales.
You can summarize the sales – salesperson-wise as given below.
-
Click the table – Sales.
-
Click the INSERT tab on the Ribbon.
-
Select PivotTable in the Tables group.
An empty PivotTable with the fields from the Sales table – Region, Month and Order Amount will be created. As you can observe, there is a MORE TABLES command below the PivotTable Fields list.
-
Click on MORE TABLES.
The Create a New PivotTable message box appears. The message displayed is- To use multiple tables in your analysis, a new PivotTable needs to be created using the Data Model. Click Yes
A New PivotTable will be created as shown below −
Under PivotTable Fields, you can observe that there are two tabs – ACTIVE and ALL.
-
Click the ALL tab.
-
Two tables- Sales and Salesperson, with the corresponding fields appear in the PivotTable Fields list.
-
Click the field Salesperson in the Salesperson table and drag it to ROWS area.
-
Click the field Month in the Sales table and drag it to ROWS area.
-
Click the field Order Amount in the Sales table and drag it to ∑ VALUES area.
The PivotTable is created. A message appears in the PivotTable Fields – Relationships between tables may be needed.
Click the CREATE button next to the message. The Create Relationship dialog box appears.
-
Under Table, select Sales.
-
Under Column (Foreign) box, select Region.
-
Under Related Table, select Salesperson.
-
Under Related Column (Primary) box, select Region.
-
Click OK.
Your PivotTable from the two tables on two worksheets is ready.
Further, as Excel stated while adding the second table to the PivotTable, the PivotTable got created with Data Model. To verify, do the following −
-
Click the POWERPIVOT tab on the Ribbon.
-
Click Manage in the Data Model group. The Data View of the Power Pivot appears.
You can observe that the two Excel tables that you used in creating the PivotTable are converted to data tables in the Data Model.
Adding Excel Tables from a Different Workbook to Data Model
Suppose the two tables – Salesperson and Sales are in two different workbooks.
You can add the Excel table from a different workbook to the Data Model as follows −
-
Click the Sales table.
-
Click the INSERT tab.
-
Click PivotTable in the Tables group. The Create PivotTable dialog box appears.
-
In the Table/Range box, type Sales.
-
Click on New Worksheet.
-
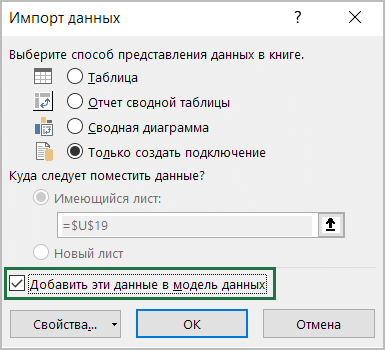
Check the box Add this data to the Data Model.
-
Click OK.
You will get an empty PivotTable on a new worksheet with only the fields corresponding to the Sales table.
You have added the Sales table data to the Data Model. Next, you have to get the Salesperson table data also into Data Model as follows −
-
Click on the worksheet containing Sales table.
-
Click the DATA tab on the Ribbon.
-
Click Existing Connections in the Get External Data group. The Existing Connections dialog box appears.
-
Click on the Tables tab.
Under This Workbook Data Model, 1 table is displayed (This is the Sales table that you added earlier). You also find the two workbooks displaying the tables in them.
-
Click Salesperson under Salesperson.xlsx.
-
Click Open. The Import Data dialog box appears.
-
Click on PivotTable Report.
-
Click on New worksheet.
You can see that the box – Add this data to the Data Model is checked and inactive. Click OK.
The PivotTable will be created.
As you can observe the two tables are in the Data Model. You might have to create a relationship between the two tables as in the previous section.
Adding Excel Tables to Data Model from the PowerPivot Ribbon
Another way of adding Excel tables to Data Model is doing so from the PowerPivot Ribbon.
Suppose you have two worksheets in your workbook −
-
One containing the data of salespersons and the regions they represent, in a table – Salesperson.
-
Another containing the data of sales, region and month wise, in a table – Sales.
You can add these Excel tables to the Data Model first, before doing any analysis.
-
Click on the Excel table — Sales.
-
Click the POWERPIVOT tab on the Ribbon.
-
Click Add to Data Model in the Tables group.
Power Pivot window appears, with the data table Salesperson added to it. Further a tab – Linked Table appears on the Ribbon in the Power Pivot window.
-
Click on the Linked Table tab on the Ribbon.
-
Click on Excel Table: Salesperson.
You can find that the names of the two tables present in your workbook are displayed and the name Salesperson is ticked. This means the data table Salesperson is linked to the Excel table Salesperson.
Click Go to Excel Table.
Excel window with worksheet containing Salesperson table appears.
-
Click the Sales worksheet tab.
-
Click the Sales table.
-
Click Add to Data Model in the Tables group on the Ribbon.
The Excel table Sales is also added to the Data Model.
If you want to do analysis based on these two tables, as you are aware, you need to create a relationship between the two data tables. In Power Pivot, you can do this in two ways −
-
From Data View
-
From Diagram View
Creating Relationships from Data View
As you know that in Data View, you can view the data tables with records as rows and fields as columns.
-
Click on the Design tab in the Power Pivot window.
-
Click on Create Relationship in the Relationships group. The Create Relationship dialog box appears.
-
Click on Sales in the Table box. This is the table from where the relationship starts. As you are aware, Column should be the field that is present in the related table Salesperson that contains unique values.
-
Click on Region in the Column box.
-
Click on Salesperson in the Related Linked Table box.
The Related Linked Column gets automatically populated with Region.
Click the Create button. The relationship is created.
Creating Relationships from Diagram View
Creating Relationships from Diagram View is relatively easier. Follow the given steps.
-
Click the Home tab in the Power Pivot window.
-
Click Diagram View in the View group.
The Diagram View of the Data Model appears in the Power Pivot window.
-
Click on Region in Sales table. Region in Sales table is highlighted.
-
Drag to Region in Salesperson table. Region in Salesperson table is also highlighted. A line appears in the direction you dragged.
-
A line appears from the table Sales to the table Salesperson indicating the relationship.
As you can see, a line appears from the Sales table to the Salesperson table, indicating the relationship and the direction.
If you want to know the field that is a part of a relationship, click on the relationship line. The line and the field in both the tables are highlighted.
Managing Relationships
You can edit or delete an existing relationship in Data Model.
-
Click the Design tab in the Power Pivot window.
-
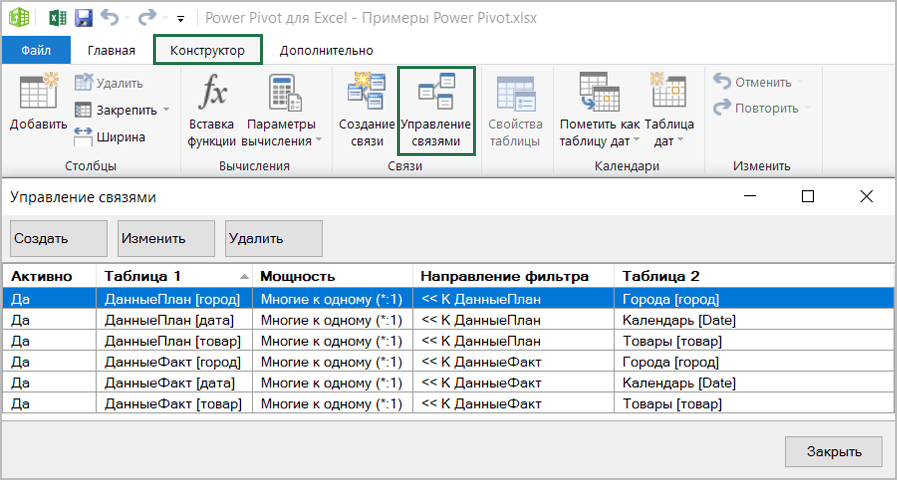
Click Manage Relationships in the Relationships group. The Manage Relationships dialog box appears.
All the relationships that exist in the Data Model are displayed.
To edit a relationship
-
Click on a Relationship.
-
Click the Edit button. The Edit Relationship dialog box appears.
-
Make the required changes in the relationship.
-
Click OK. The changes get reflected in the relationship.
To delete a relationship
-
Click on a Relationship.
-
Click on the Delete button. A warning message appears showing how the tables that are affected by deleting the relationship would affect the reports.
-
Click OK if you are sure you want to delete. The selected relationship is deleted.
Refreshing Power Pivot Data
Suppose you modify the data in the Excel table. You can add / change / delete the data in the Excel table.
To refresh the PowerPivot data, do the following −
-
Click the Linked Table tab in the Power Pivot window.
-
Click Update All.
The data table is updated with the modifications made in the Excel table.
As you can observe, you cannot modify data in the data tables directly. Hence, it is better to maintain your data in Excel tables that are linked to the data tables when you add them to the Data Model. This facilitates updating the data in data tables as and when you update the data in Excel tables.
Excel Power PivotTable — Creation
Power PivotTable is based on the Power Pivot database, which is called the Data Model. You have already learnt the powerful features of the Data Model. The power of Power Pivot is in its ability to summarize data from the Data Model in the Power PivotTable. As you are aware, the Data Model can handle huge data spanning millions of rows and coming from diverse inputs. This enables Power PivotTable to summarize the data from anywhere in a matter of few minutes.
Power PivotTable resembles PivotTable in its layout, with the following differences −
-
PivotTable is based on Excel tables, whereas Power PivotTable is based on data tables that are part of Data Model.
-
PivotTable is based on a single Excel table or data range, whereas Power PivotTable can be based on multiple data tables, provided they are added to Data Model.
-
PivotTable is created from Excel window, whereas Power PivotTable is created from PowerPivot window.
Creating a Power PivotTable
Suppose you have two data tables − Salesperson and Sales in the Data Model. To create a PowerPivot Table from these two data tables, proceed as follows −
-
Click the Home tab on the Ribbon in PowerPivot window.
-
Click PivotTable on the Ribbon.
-
Select PivotTable from the dropdown list.
Create PivotTable dialog box appears. As you can observe, this is a simple dialog box, without any queries on data. This is because, Power PivotTable is always based on Data Model, i.e. the data tables with the relationships defined among them.
Select New Worksheet and click OK.
A new worksheet is created in Excel window and an empty PivotTable appears.
As you can observe, the layout of the Power PivotTable is similar to that of PivotTable. The PIVOTTABLE TOOLS appear on the Ribbon, with ANALYZE and DESIGN tabs, identical to PivotTable.
The PivotTable Fields List appears on the right side of the worksheet. Here, you will find some differences from PivotTable.
Power PivotTable Fields
The PivotTable Fields list has two tabs − ACTIVE and ALL that appear below the title and above the fields list. The ALL tab is highlighted.
Note that the ALL tab displays all the data tables in the Data Model and ACTIVE tab displays all the data tables that are chosen for the Power PivotTable at hand. As the Power PivotTable is empty, it means that no data table is selected yet; hence by default, ALL tab is selected and the two tables that are currently in the Data Model are displayed. At this point, if you click the ACTIVE tab, the Fields list would be empty.
-
Click on the table names in the PivotTable Fields list under ALL. The corresponding fields with check boxes will appear.
-
Each table name will have the symbol
on the left side.
-
If you place the cursor on this symbol, the Data Source and the Model Table Name of that data table will be displayed.
-
Drag Salesperson from Salesperson table to the ROWS area.
-
Click the ACTIVE tab.
As you can observe, the field Salesperson appears in the PivotTable and the table Salesperson appears under the ACTIVE tab as expected.
-
Click the ALL tab.
-
Click on Month and Order Amount in the Sales table.
Again, click the ACTIVE tab. Both the tables − Sales and Salesperson appear under the ACTIVE tab.
-
Drag Month to COLUMNS area.
-
Drag Region to FILTERS area.
-
Click the arrow next to ALL in the Region filter box.
-
Click Select Multiple Items.
-
Select North and South and click OK.
Sort the column labels in the ascending order.
Power PivotTable can be modified dynamically explore and report data.
Excel Power Pivot — Basics of DAX
DAX (Data Analysis eXpression) language is the language of Power Pivot. DAX is used by Power Pivot for data modeling and it is convenient for you to use for self-service BI. DAX is based on data tables and columns in data tables. Note that it is not based on individual cells in the table as is the case with the formulas and functions in Excel.
You will learn the two simple calculations that exist in Data Model − Calculated Column and Calculated Field in this chapter.
Calculated Column
Calculated column is a column in the Data Model that is defined by a calculation and that extends the content of a data table. It can be visualized as a new column in an Excel table defined by a formula.
Extending the Data Model using Calculated Columns
Suppose you have sales data of products region-wise in data tables and also a Product Catalog in the Data Model.
Create a Power PivotTable with this data.
As you can observe, the Power PivotTable has summarized the sales data from all the regions. Suppose you want to know the gross profit made on each of the products. You know the price of each product, the cost at which it is sold and the number of units sold.
However, if you need to calculate the gross profit, you need to have two more columns in each of the data tables of the regions − Total Product Price and Gross Profit. This is because, PivotTable requires columns in data tables to summarize the results.
As you know, Total Product Price is Product Price * No. of Units and Gross Profit is Total Amount − Total Product Price.
You need to use DAX Expressions to add the Calculated Columns as follows −
-
Click the East_Sales tab in Data View of the Power Pivot window to view the East_Sales Data Table.
-
Click the Design tab on the Ribbon.
-
Click Add.
The column on the right side with the header − Add Column is highlighted.
Type = [Product Price] * [No. of Units] in the formula bar and press Enter.
A new column with header CalculatedColumn1 is inserted with the values calculated by the formula you entered.
-
Double click the header of the new calculated column.
-
Rename the header as TotalProductPrice.
Add one more calculated column for Gross Profit as follows −
-
Click the Design tab on the Ribbon.
-
Click Add.
-
The column on the right side with the header − Add Column is highlighted.
-
Type = [TotalSalesAmount] − [TotaProductPrice] in the formula bar.
-
Press Enter.
A new column with header CalculatedColumn1 is inserted with the values calculated by the formula you entered.
-
Double click the header of the new calculated column.
-
Rename the header as Gross Profit.
Add the Calculated Columns in the North_Sales data table in a similar way. Consolidating all the steps, proceed as follows −
-
Click the Design tab on the Ribbon.
-
Click Add. The column on the right side with the header − Add Column is highlighted.
-
Type = [Product Price] * [No. of Units] in the formula bar and press Enter.
-
A new column with header CalculatedColumn1 gets inserted with the values calculated by the formula you entered.
-
Double click the header of the new calculated column.
-
Rename the header as TotalProductPrice.
-
Click the Design tab on the Ribbon.
-
Click Add. The column on the right side with the header — Add Column is highlighted.
-
Type = [TotalSalesAmount] − [TotaProductPrice] in the formula bar and press Enter. A new column with header CalculatedColumn1 gets inserted with the values calculated by the formula you entered.
-
Double click the header of the new calculated column.
-
Rename the header as Gross Profit.
Repeat the above given steps for the South Sales data table and West Sales data table.
You have the necessary columns to summarize the Gross Profit. Now, create the Power PivotTable.
You are able to summarize the Gross Profit that became possible with the calculated columns in the Power Pivot and it all can be done just in a few steps that are error-free.
You can summarize it region wise for the products as given below also −
Calculated Field
Suppose you want to calculate the percentage of profit made by each region product-wise. You can do so by adding a calculated field to the Data Table.
-
Click below the column Gross Profit in the East_Sales table in Power Pivot window.
-
Type EastProfit: = SUM ([Gross Profit]) / sum ([TotalSalesAmount]) in the formula bar.
-
Press Enter.
The calculated field EastProfit is inserted below the Gross Profit column.
-
Right click the calculated field − EastProfit.
-
Select Format from the dropdown list.
The Formatting dialog box appears.
-
Select Number under Category.
-
In the Format box, select Percentage and click OK.
The calculated field EastProfit is formatted to percentage.
Repeat the steps to insert the following calculated fields −
-
NorthProfit in North_Sales data table.
-
SouthProfit in South_Sales data table.
-
WestProfit in West_Sales data table.
Note − You cannot define more than one calculated field with a given name.
Click on the Power PivotTable. You can see that the calculated fields appear in the tables.
-
Select the fields − EastProfit, NorthProfit, SouthProfit and WestProfit from the tables in the PivotTable Fields list.
-
Arrange the fields such that the Gross Profit and Percentage Profit appear together. The Power PivotTable looks as follows −
Note − The Calculate Fields were called Measures in earlier versions of Excel.
Excel Power Pivot — Exploring Data
In the previous chapter, you have learnt how to create a Power PivotTable from a normal set of data tables. In this chapter, you will learn how you can explore data with Power PivotTable, when the data tables contain thousands of rows.
For a better understanding, we will import the data from an access database, which you know is a relational database.
Loading Data from Access Database
To load data from the Access database, follow the given steps −
-
Open a new blank workbook in Excel.
-
Click Manage in the Data Model group.
-
Click the POWERPIVOT tab on the Ribbon.
The Power Pivot window appears.
-
Click the Home tab in the Power Pivot window.
-
Click From Database in the Get External Data group.
-
Select From Access from the dropdown list.
The Table Import Wizard appears.
-
Provide Friendly connection name.
-
Browse to the Access database file, Events.accdb, the Events database file.
-
Click on the Next > button.
The Table Import wizard displays options for choosing how to import data.
Click Select from a list of tables and views to choose the data to import and click Next.
The Table Import Wizard displays all the tables in the Access database that you have selected. Check all the boxes to select all the tables and click Finish.
The Table Import Wizard displays – Importing and shows the status of the import. This may take a few minutes and you can stop the import by clicking the Stop Import button.
Once the data import is complete, Table Import Wizard displays – Success and shows the results of the import. Click Close.
Power Pivot displays all the imported tables in different tabs in Data View.
Click on the Diagram View.
You can observe that a relationship exists between the tables – Disciplines and Medals. This is because, when you import data from a relational database such as Access, the relationships that exist in the database also are imported to the Data Model in Power Pivot.
Creating a PivotTable from the Data Model
Create a PivotTable with the tables that you have imported in the previous section as follows −
-
Click PivotTable on the Ribbon.
-
Select PivotTable from the drop down list.
-
Select New Worksheet in the Create PivotTable dialog box that appears and click OK.
An empty PivotTable is created in a new worksheet in the Excel window.
All the imported tables that are a part of Power Pivot Data Model appear in the PivotTable Fields list.
-
Drag the NOC_CountryRegion field in the Medals table to the COLUMNS area.
-
Drag Discipline from the Disciplines table to the ROWS area.
-
Filter Discipline to display only five sports: Archery, Diving, Fencing, Figure Skating, and Speed Skating. This can be done either in PivotTable Fields area, or from the Row Labels filter in the PivotTable itself.
-
Drag Medal from the Medals table to the VALUES area.
-
Select Medal from the Medals table again and drag it into the FILTERS area.
The PivotTable is populated with the added fields and in the chosen layout from the areas.
Exploring Data with PivotTable
You might want to display only those values with Medal Count > 80. To perform this, follow the given steps −
-
Click the arrow to the right of Column Labels.
-
Select Value Filters from the dropdown list.
-
Select Greater Than…. from the second dropdown list.
-
Click OK.
The Value Filter dialog box appears. Type 80 in the right-most box and click OK.
The PivotTable displays only those regions with total number of medals more than 80.
You could arrive at the specific report that you wanted from the different tables in just few steps. This became possible because of the pre-existing relationships among the tables in the Access database. As you imported all the tables from the database together at the same time, Power Pivot recreated the relationships in its Data Model.
Summarizing Data from Different Sources in Power Pivot
If you get the data tables from different sources or if you do not import the tables from a database at the same time, or if you create new Excel tables in your workbook and add them to the Data Model, you have to create the relationships among the tables that you want to use for your analysis and summarization in the PivotTable.
-
Create a new worksheet in the workbook.
-
Create an Excel table – Sports.
Add Sports table to Data Model.
Create a relationship between the tables Disciplines and Sports with the field SportID.
Add the field Sport to the PivotTable.
Shuffle the fields — Discipline and Sport in the ROWS area.
Extending Data Exploration
You can get the table Events also into further data exploration.
Create a relationship between the tables- Events and Medals with the field DisciplineEvent.
Add a table Hosts to the workbook and Data Model.
Extending the Data Model using Calculated Columns
To connect Hosts table to any of the other tables, it should have a field with values that uniquely identify each row in the Hosts table. As no such field exists in the Host table, you can create a calculated column in the Hosts table so that it contains unique values.
-
Go to the Hosts table in Data View of the PowerPivot window.
-
Click the Design tab on the Ribbon.
-
Click Add.
The right-most column with the header Add Column is highlighted.
-
Type the following DAX formula in the formula bar = CONCATENATE ([Edition], [Season])
-
Press Enter.
A new column is created with the header CalculatedColumn1 and the column is filled by the values resulting from the above DAX formula.
Right-click on the new column and select Rename Column from the dropdown list.
Type EditionID in the header of the new column.
As you can see, the column EditionID has unique values in the Hosts table.
Creating a Relationship Using Calculated Columns
If you have to create a relationship between the Hosts table and the Medals table, the column EditionID should exist in the Medals table also. Create a calculated column in Medals table as follows −
-
Click on the Medals table in the Data View of Power Pivot.
-
Click the Design tab on the Ribbon.
-
Click Add.
Type the DAX formula in the formula bar = YEAR ([EDITION]) and press Enter.
Rename the new column that is created as Year and click Add.
-
Type the following DAX formula in the formula bar = CONCATENATE ([Year], [Season])
-
Rename the new column that is created as EditionID.
As you can observe, the EditionID column in the Medals table has identical values as the EditionID column in the Hosts table. Therefore, you can create a relationship between the tables – Medals and Sports with the EditionID field.
-
Switch to the diagram view in PowerPivot window.
-
Create a relationship between the tables- Medals and Hosts with the field that is obtained from the calculated column i.e. EditionID.
Now you can add fields from Hosts table to Power PivotTable.
Excel Power Pivot — Flattened
When the data has many levels, sometimes it becomes cumbersome to read the PivotTable report.
For example, consider the following Data Model.
We will create a Power PivotTable and a Power Flattened PivotTable to get an understanding of the layouts.
Creating a PivotTable
You can create a Power PivotTable as follows −
-
Click the Home tab on the Ribbon in the PowerPivot window.
-
Click PivotTable.
-
Select PivotTable from the dropdown list.
An empty PivotTable will be created.
-
Drag the fields − Salesperson, Region and Product from the PivotTable Fields list to the ROWS area.
-
Drag the field − TotalSalesAmount from the Tables − East, North, South and West to the ∑ VALUES area.
As you can see, it is a bit cumbersome read such a report. If the number of entries becomes more, the more difficult it will be.
Power Pivot provides a solution for a better representation of data with Flattened PivotTable.
Creating a Flattened PivotTable
You can create a Power Flattened PivotTable as follows −
-
Click the Home tab on the Ribbon in the PowerPivot window.
-
Click PivotTable.
-
Select Flattened PivotTable from the dropdown list.
Create Flattened PivotTable dialog box appears. Select New Worksheet and click OK.
As you can observe the data is flattened out in this PivotTable.
Note − In this case Salesperson, Region and Product are in ROWS area only as in the previous case. However, in the PivotTable layout, these three fields are appearing as three columns.
Exploring Data in Flattened PivotTable
Suppose you want to summarize the sales data for the product − Air Conditioner. You can do it in a simple way with the Flattened PivotTable as follows −
-
Click the arrow next to the column header − Product.
-
Check the box Air Conditioner and uncheck the other boxes. Click OK.
The Flattened PivotTable is filtered to the Air Conditioner sales data.
You can make it look more flattened by dragging ∑ VALUES to ROWS area from the COLUMNS area.
Rename the custom names of the summation values in the ∑ VALUES area to make them more meaningful as follows −
-
Click on a summation value, say, Sum of TotalSalesAmount for East.
-
Select Value Field Settings from the dropdown list.
-
Change the Custom Name to East TotalSalesAmount.
-
Repeat the steps for the other three summation values.
You can also summarize the number of units sold.
-
Drag No. of Units to the ∑ VALUES area from each of the tables − East_Sales, North_Sales, South_Sales and West_Sales.
-
Rename the values to East Total No. of Units, North Total No. of Units, South Total No. of Units and West Total No. of Units respectively.
As you can observe, in both of the above tables, there are rows with empty values, as each salesperson represents a single region and each region is represented only by a single salesperson.
-
Select the rows with empty values.
-
Right click and click on Hide in the dropdown list.
All the rows with empty values will be hidden.
As you can observe, though the rows with empty values are not displayed, the information on the Salesperson also got hidden.
-
Click on the column header − Salesperson.
-
Click the ANALYZE tab on the Ribbon.
-
Click Field Settings. The Field Settings dialog box appears.
-
Click the Layout & Print tab.
-
Check the box — Repeat Item Labels.
-
Click OK.
As you can observe, the Salesperson information is displayed and the rows with empty values are hidden. Further, the column Region in the report is redundant, as the values in the Values column are self-explanatory.
Drag the field Regions out of Area.
Reverse the order of the fields − Salesperson and Product in the ROWS area.
You have arrived at a concise report combining data from six tables in the Power Pivot.
Excel Power Pivot Charts — Creation
A PivotChart based on Data Model and created from the Power Pivot window is a Power PivotChart. Though it has some features similar to Excel PivotChart, there are other features that make it more powerful.
In this chapter, you will learn about Power PivotCharts. Henceforth we refer to them as PivotCharts, for simplicity.
Creating a PivotChart
Suppose you want to create a PivotChart based on the following Data Model.
-
Click the Home tab on the Ribbon in Power Pivot window.
-
Click PivotTable.
-
Select PivotChart from the dropdown list.
The Create PivotChart dialog box appears. Select New Worksheet and click OK.
An empty PivotChart is created on a new worksheet in the Excel window.
As you can observe, all the tables in the data model are displayed in the PivotChart Fields list.
-
Click on the Salesperson table in the PivotChart Fields list.
-
Drag the fields − Salesperson and Region to AXIS area.
Two field buttons for the two selected fields appear on the PivotChart. These are the Axis field buttons. The use of field buttons is to filter data that is displayed on the PivotChart.
Drag TotalSalesAmount from each of the four tables– East_Sales, North_Sales, South_Sales and West_Sales to ∑ VALUES area.
The following appear on the worksheet −
-
In the PivotChart, column chart is displayed by default.
-
In the LEGEND area, ∑ VALUES are added.
-
The Values appear in the Legend in the PivotChart, with title Values.
-
The Value Field Buttons appear on the PivotChart. You can remove the legend and the value field buttons for a tidier look of the PivotChart.
-
Click on the
button at the top right corner of the PivotChart. The Chart Elements dropdown list appears.
Uncheck the box Legend in the Chart Elements list. The Legend is removed from the PivotChart.
-
Right click on the value field buttons.
-
Select Hide Value Field Buttons on Chart from the dropdown list.
The value field buttons on the chart are removed.
Note − The display of field buttons and/or legend depends on the context of the PivotChart. You need to decide what is required to be displayed.
PivotChart Fields List
As in the case of Power PivotTable, Power PivotChart Fields list also contains two tabs – ACTIVE and ALL. Under the ALL tab, all the data tables in the Power Pivot Data Model are displayed. Under the ACTIVE tab, the tables from which the fields are added to PivotChart are displayed.
Likewise, the areas are as in the case of Excel PivotChart. There four areas are −
-
AXIS (Categories)
-
LEGEND (Series)
-
∑ VALUES
-
FILTERS
As you have seen in the previous section, Legend is populated with ∑ Values. Further, field buttons are added to the PivotChart for the ease of filtering the data that is being displayed.
Filters in PivotChart
You can use the Axis field buttons on the chart to filter the data being displayed. Click on the arrow on the Axis field button – Region.
The dropdown list that appears looks as follows −
You can select the values that you want to display. Alternatively, you can place the field in FILTERS area for filtering the values.
Drag the field Region to FILTERS area. The Report Filter button — Region appears on the PivotChart.
Click on the arrow on the Report Filter button − Region. The dropdown list that appears looks as follows −
You can select the values that you want to display.
Slicers in PivotChart
Using Slicers is another option to filter data in the Power PivotChart.
-
Click the ANALYZE tab under PIVOTCHART tools on the Ribbon.
-
Click Insert Slicer in the Filter group. The Insert Slicer dialog box appears.
All the tables and the corresponding fields appear in the Insert Slicer dialog box.
Click the field Region in Salesperson table in the Insert Slicer dialog box.
Slicer for the field Region appears on the worksheet.
As you can observe, the Region field still exists as an Axis field. You can select the values that you want to display by clicking on the Slicer buttons.
Remember that you are able to do all these in a few minutes and also dynamically because of the Power Pivot Data Model and defined relationships.
PivotChart Tools
In Power PivotChart, the PIVOTCHART TOOLS has three tabs on the Ribbon as against two tabs in Excel PivotChart −
-
ANALYZE
-
DESIGN
-
FORMAT
The third tab − FORMAT is the additional tab in Power PivotChart.
Click the FORMAT tab on the Ribbon.
The options on the Ribbon under FORMAT tab are all for adding splendor to your PivotChart. You can use these options judiciously, without getting over bored.
Table and Chart Combinations
Power Pivot provides you with different combinations of Power PivotTable and Power PivotChart for data exploration, visualization, and reporting. You have learnt the PivotTables and PivotCharts in the previous chapters.
In this chapter, you will learn how to create the Table and Chart combinations from within the Power Pivot window.
Consider the following Data Model in Power Pivot that we will use for illustrations −
Chart and Table (Horizontal)
With this option, you can create a Power PivotChart and a Power PivotTable, one next another horizontally in the same worksheet.
-
Click the Home tab in Power Pivot window.
-
Click PivotTable.
-
Select Chart and Table (Horizontal) from the dropdown list.
Create PivotChart and PivotTable (Horizontal) dialog box appears. Select New Worksheet and click OK.
An empty PivotChart and an empty PivotTable appear on a new worksheet.
-
Click on the PivotChart.
-
Drag NOC_CountryRegion from Medals table to the AXIS area.
-
Drag Medal from Medals table to the ∑ VALUES area.
-
Right click on the Chart and select Change Chart Type from the dropdown list.
-
Select Area Chart.
-
Change the Chart Title to Total No. of Medals − Country Wise.
As you can see, USA has the highest number of Medals (> 4500).
-
Click on the PivotTable.
-
Drag Sport from the Sports table to the ROWS area.
-
Drag Medal from the Medals table to the ∑ VALUES area.
-
Drag NOC_CountryRegion from Medals table to FILTERS area.
-
Filter the NOC_CountryRegion field to the value USA.
Change the PivotTable Report Layout to Outline Form.
-
Deselect Sport from the Sports table.
-
Drag Gender from the Medals table to the ROWS area.
Chart and Table (Vertical)
With this option, you can create a Power PivotChart and a Power PivotTable, one below another vertically in the same worksheet.
-
Click the Home tab in Power Pivot window.
-
Click PivotTable.
-
Select Chart and Table (Vertical) from the dropdown list.
The Create PivotChart and PivotTable (Vertical) dialog box appears. Select New Worksheet and click OK.
An empty PivotChart and an empty PivotTable appear vertically on a new worksheet.
-
Click on the PivotChart.
-
Drag Year from the Medals table to AXIS area.
-
Drag Medal from the Medals table to ∑ VALUES area.
-
Right click on the Chart and select Change Chart Type from the dropdown list.
-
Select Line Chart.
-
Check the box Data Labels in the Chart Elements.
-
Change the Chart Title to Total No. of Medals – Year Wise.
As you can observe, year 2008 has the highest number of Medals (2450).
-
Click on the PivotTable.
-
Drag Sport from the Sports table to the ROWS area.
-
Drag Gender from the Medals table to the ROWS area.
-
Drag Medal from the Medals table to the ∑ VALUES area.
-
Drag Year from the Medals table to the FILTERS area.
-
Filter the Year field to the value 2008.
-
Change the Report Layout of PivotTable to Outline Form.
-
Filter the field Sport with Value Filters to Greater than or equal to 80.
Excel Power Pivot — Hierarchies
A hierarchy in Data Model is a list of nested columns in a data table that are considered as a single item when used in a Power PivotTable. For example, if you have the columns − Country, State, City in a data table, a hierarchy can be defined to combine the three columns into one field.
In the Power PivotTable Fields list, the hierarchy appears as one field. So, you can add just one field to the PivotTable, instead of the three fields in the hierarchy. Further, it enables you to move up or down the nested levels in a meaningful way.
Consider the following Data Model for illustrations in this chapter.
Creating a Hierarchy
You can create Hierarchies in the diagram view of the Data Model. Note that you can create a hierarchy based on a single data table only.
-
Click on the columns − Sport, DisciplineID and Event in the data table Medal in that order. Remember that the order is important to create a meaningful hierarchy.
-
Right-click on the selection.
-
Select Create Hierarchy from the dropdown list.
The hierarchy field with the three selected fields as the child levels gets created.
Renaming a Hierarchy
To rename the hierarchy field, do the following −
-
Right click on Hierarchy1.
-
Select Rename from the dropdown list.
Type EventHierarchy.
Creating a PivotTable with a Hierarchy in Data Model
You can create a Power PivotTable using the hierarchy that you created in the Data Model.
-
Click the PivotTable tab on the Ribbon in the Power Pivot window.
-
Click PivotTable on the Ribbon.
The Create PivotTable dialog box appears. Select New Worksheet and click OK.
An empty PivotTable is created in a new worksheet.
In the PivotTable Fields list, EventHierarchy appears as a field in Medals table. The other fields in the Medals table are collapsed and shown as More Fields.
-
Click on the arrow
in front of EventHierarchy.
-
Click on the arrow
in front of More Fields.
The fields under EventHierarchy will be displayed. All the fields in the Medals table will be displayed under More Fields.
As you can observe, the three fields that you added to the hierarchy also appear under More Fields with check boxes. If you do not want them to appear in the PivotTable Fields list under More Fields, you have to hide the columns in the data table – Medals in data view in Power Pivot Window. You can always unhide them whenever you want.
Add fields to the PivotTable as follows −
-
Drag EventHierarchy to ROWS area.
-
Drag Medal to ∑ VALUES area.
The values of Sport field appear in the PivotTable with a + sign in front of them. The medal count for each sport is displayed.
-
Click on the + sign before Aquatics. The DisciplineID field values under Aquatics will be displayed.
-
Click on the child D22 that appears. The Event field values under D22 will be displayed.
As you can observe, medal count is given for the Events, that get summed up at the parent level − DisciplineID, that get further summed up at the parent level − Sport.
Creating a Hierarchy based on Multiple Tables
Suppose you want to display the Disciplines in the PivotTable rather than DisciplineIDs to make it a more readable and understandable summarization. In order to do this, you need to have the field Discipline in Medals table that as you know is not. Discipline field is in Disciplines data table, but you cannot create a hierarchy with fields from more than one table. But, there is a way to obtain the required field from the other table.
As you are aware, the tables − Medals and Disciplines are related. You can add the field Discipline from Disciplines table to the Medals table, by creating a column using the relationship with DAX.
-
Click data view in Power Pivot window.
-
Click the Design tab on the Ribbon.
-
Click Add.
The column − Add Column on the right side of the table is highlighted.
Type = RELATED (Disciplines [Discipline]) in the formula bar. A new column − CalculatedColumn1 is created with the values as Discipline field values in the Disciplines table.
Rename the new column thus obtained in the Medals table as Discipline. Next, you have to remove DisciplineID from the Hierarchy and add Discipline, which you will learn in the following sections.
Removing a Child Level from a Hierarchy
As you can observe, the hierarchy is visible in the diagram view only, and not in the data view. Hence, you can edit a hierarchy in the diagram view only.
-
Click on the diagram view in the Power Pivot window.
-
Right click DisciplineID in EventHierarchy.
-
Select Remove from Hierarchy from the dropdown list.
The Confirm dialog box appears. Click Remove from Hierarchy.
The field DisciplineID gets deleted from the hierarchy. Remember that you have removed the field from hierarchy, but the source field still exists in the data table.
Next, you need to add Discipline field to EventHierarchy.
Adding a Child Level to a Hierarchy
You can add the field Discipline to the existing hierarchy — EventHierarchy as follows −
-
Click on the field in Medals table.
-
Drag it to the Events field below in the EventHierarchy.
The Discipline field gets added to EventHierarchy.
As you can observe, the order of the fields in EventHierarchy is Sport–Event–Discipline. But, as you are aware it has to be Sport–Discipline-Event. Hence, you need to change the order of the fields.
Changing the Order of a Child Level in a Hierarchy
To move the field Discipline to the position after the field Sport, do the following −
-
Right click on the field Discipline in EventHierarchy.
-
Select Move Up from the dropdown list.
The order of the fields changes to Sport-Discipline-Event.
PivotTable with Changes in Hierarchy
To view the changes that you made in EventHierarchy in the PivotTable, you need not create a new PivotTable. You can view them in the existing PivotTable itself.
Click on the worksheet with the PivotTable in Excel window.
As you can observe, in the PivotTable Fields list, the child levels in the EventHierarchy reflect the changes you made in the Hierarchy in Data Model. The same changes also get reflected in the PivotTable accordingly.
Click the + sign in front of Aquatics in the PivotTable. The child levels appear as values of the field Discipline.
Hiding and Showing Hierarchies
You can choose to hide the Hierarchies and show them whenever you want.
-
Uncheck the box Hierarchies in the top menu of diagram view to hide the hierarchies.
-
Check the box Hierarchies to show the hierarchies.
Creating a Hierarchy in Other Ways
In addition to the way you created hierarchy in the previous sections, you can create a hierarchy in another two ways.
1. Click the Create Hierarchy button on the top right corner of the Medals data table in diagram view.
A new hierarchy gets created in the table without any fields in it.
Drag the fields Year and Season, in that order to the new hierarchy. The hierarchy shows the child levels.
2. Another way of creating the same hierarchy is as follows −
-
Right click on the field Year in the Medals data table in diagram view.
-
Select Create Hierarchy from the dropdown list.
A new hierarchy is created in table with Year as a child field.
Drag the field season to the hierarchy. The hierarchy shows the child levels.
Deleting a Hierarchy
You can delete a hierarchy from the Data Model as follows −
-
Right click on the hierarchy.
-
Select Delete from the dropdown list.
The Confirm dialog box appears. Click Delete from Model.
The hierarchy gets deleted.
Calculations Using Hierarchy
You can create calculations using a hierarchy. In the EventsHierarchy, you can display the number of medals at a child level as a percentage of the number of medals at its parent level as follows −
-
Right click on a Count of Medal value of an Event.
-
Select Value Field Settings from the dropdown list.
Value Field Settings dialog box appears.
-
Click the Show Values As tab.
-
Select % of Parent Row Total from the list and click OK.
The child levels are displayed as the percentage of the Parent Totals. You can verify this by summing up the percentage values of the child level of a parent. The sum would be 100%.
Drilling Up and Drilling Down a Hierarchy
You can quickly drill up and drill down across the levels in a hierarchy using Quick Explore tool.
-
Click on a value of Event field in the PivotTable.
-
Click the Quick Explore tool —
that appears at the bottom right corner of the cell containing the selected value.
The Explore box with Drill Up option appears. This is because from Event you can only drill up as there are no child levels under it.
Click Drill Up.
PivotTable data is drilled up to Discipline.
Click on the Quick Explore tool — 
Explore box appears with Drill Up and Drill Down options displayed. This is because from Discipline you can drill up to Sport or drill down to Event.
This way you can quickly move up and down the hierarchy.
Excel Power Pivot — Aesthetic Reports
You can create aesthetic reports of your data analysis with Power Pivot Data that is in Data Model.
The important features are −
-
You can use PivotCharts to produce visual reports of your data. You can use Report Layouts to structure your PivotTables to make them easily readable.
-
You can insert Slicers for filtering data in the report.
-
You can use a common Slicer for both the PivotChart and the PivotTable that are in the same report.
-
Once your final report is ready, you can choose to hide the Slicers form the display.
You will learn how to get reports with the options that are available in Power Pivot in this chapter.
Consider the following Data Model for illustrations in this chapter.
Reports based on Power PivotChart
Create a Power PivotChart as follows −
-
Click the Home tab on the Ribbon in PowerPivot window.
-
Click PivotTable.
-
Select PivotChart from the dropdown list.
-
Click New Worksheet in the Create PivotChart dialog box.
An empty PivotChart is created in a new worksheet in Excel window.
-
Drag Sport from Medals table to Axis area.
-
Drag Medal from Medals Table to ∑ VALUES area.
-
Click the ANALYZE tab in PIVOTTABLE TOOLS on the Ribbon.
-
Click Insert Slicer in the Filter Group. The Inset Slicers dialog box appears.
-
Click the field NOC_CountryRegion in the Medals table.
-
Click OK.
The Slicer NOC_CountryRegion appears.
-
Select USA.
-
Drag Gender from Medals table to GENDER area.
-
Right click on the PivotChart.
-
Select Change Chart Type from the dropdown list.
The Change Chart Type dialog box appears.
Click on Stacked Column.
-
Insert Slicer for Sport field.
-
Drag Discipline from Disciplines table to AXIS area.
-
Remove the field Sport from AXIS area.
-
Select Aquatics in the Slicer – Sport.
Report Layout
Create PivotTable as follows −
-
Click on Home tab on the Ribbon in PowerPivot window.
-
Click on PivotTable.
-
Click on PivotTable in the dropdown list. The Create PivotTable dialog box appears.
-
Click on New Worksheet and click Ok. An empty PivotTable gets created in a new worksheet.
-
Drag NOC_CountryRegion from Medals table to AXIS area.
-
Drag Sport from Medals table to COLUMNS area.
-
Drag Discipline from Disciplines table to COLUMNS area.
-
Drag Medal to ∑ VALUES area.
Click on the arrow button next to Column Labels and select Aquatics.
-
Click on the arrow button next to Row Labels.
-
Select Value Filters from the dropdown list.
-
Select Greater Than Or Equal To from the second dropdown list.
Type 80 in the box next to Count of Medal is greater than or equal to in the Value Filter dialog box.
-
Click the DESIGN tab in PIVOTTABLE TOOLS on the Ribbon.
-
Click on Subtotals.
-
Select Do Not Show Subtotals fromn the dropdown list.
The Subtotals column – Aquatics Total gets removed.
Click Report Layout and select Show in Outline Form from the dropdown list.
Check the box Banded Rows.
The field names appear in place of Row Labels and Column Labels and the report looks self-explanatory.
Using a Common Slicer
Create a PivotChart and PivotTable next to each other.
-
Click the Home tab on the Ribbon in PowerPivot tab.
-
Click PivotTable.
-
Select Chart and Table (Horizontal) from the dropdown list.
The Create PivotChart and PivotTable (Horizontal) dialog box appears.
Select New Worksheet and click OK. An Empty PivotChart and an empty PivotTable appear next to each other in a new worksheet.
-
Click PivotChart.
-
Drag Discipline from Disciplines table to AXIS area.
-
Drag Medal from Medals table to ∑ VALUES area.
-
Click PivotTable.
-
Drag Discipline from Disciplines table to ROWS area.
-
Drag Medal from Medals table to ∑ VALUES area.
-
Click the ANALYZE tab in PIVOTTABLE TOOLS on the Ribbon.
-
Click Insert Slicer. The Insert Slicers dialog box appears.
-
Click on NOC_CountryRegion and Sport in Medals table.
-
Click OK.
Two Slicers – NOC_CountryRegion and Sport appear. Arrange and size them to align properly next to the PivotTable.
-
Select USA in the NOC_CountryRegion Slicer.
-
Select Aquatics in the Sport Slicer. The PivotTable is filtered to the selected values.
As you can observe, the PivotChart is not filtered. To filter PivotChart with the same filters, you need not insert Slicers again for PivotChart. You can use the same Slicers that you have used for the PivotTable.
-
Click on NOC_CountryRegion Slicer.
-
Click the OPTIONS tab in SLICER TOOLS on the Ribbon.
-
Click Report Connections in the Slicer group. The Report Connections dialog box appears for the NOC_CountryRegion Slicer.
You can see that all the PivotTables and PivotCharts in the workbook are listed in the dialog box.
-
Click on the PivotChart that is in the same worksheet as the selected PivotTable and click OK.
-
Repeat for Sport Slicer.
The PivotChart is also filtered to the values selected in the two Slicers.
Next, you can add details to the PivotChart and PivotTable.
-
Click the PivotChart.
-
Drag Gender to LEGEND area.
-
Right click on the PivotChart.
-
Select Change Chart Type.
-
Select Stacked Column in the Change Chart Type dialog box.
-
Click on the PivotTable.
-
Drag Event to ROWS area.
-
Click the DESIGN tab in PIVOTTABLE TOOLS on the Ribbon.
-
Click Report Layout.
-
Select Outline Form from the dropdown list.
Selecting Objects for Display in the Report
You can choose not to display the Slicers on the final Report.
-
Click the OPTIONS tab in SLICER TOOLS on the Ribbon.
-
Click Selection Pane in Arrange group. The Selection Pane appears on the right side of the window.
As you can observe, the symbol 
-
Click on
symbol next to NOC_CountryRegion.
-
Click on
symbol next to Sport. The
symbol is changed to
for both. This means the visibility for the two Slicers is off.
Close the Selection Pane.
You can see that the two Slicers are not visible in the Report.
Как показывает практика, если в файле Excel больше 50 тысяч строк, да еще формулы типа ВПР, он падает и умирает. Потом восстает, как зомби, чтобы выпить нашу кровь и нервы. Ведет он себя тоже как зомби — еле двигается и «ни черта» не соображает.
Что же делать? Ответ простой: начать работать с надстройкой для Excel — Power Pivot. Этот инструмент создан для работы с данными. Он может легко обрабатывать миллионы строк!
Надстройка Power Pivot в Excel
Power Pivot – это надстройка Excel, с помощью которой можно работать с данными в несколько миллионов строк, объединять таблицы в модель данных и создавать аналитические вычисления.
В «обычном» Excel пользователи ограничены количеством строк в таблице – не более размера листа в 1 048 тысяч строк, но в Power Pivot такого ограничения нет. Надстройка может подключаться к данным из внешних источников и работать с большими объемами информации в миллионы строк.
Открыть надстройку Power Pivot можно, нажав на вкладке меню Power Pivot кнопку Управление. Эта вкладка выглядит одинаково во всех версиях Excel.
Если такой вкладки у вас меню нет, проверьте, та ли у вас версия Excel. Так как Power Pivot представляет собой надстройку COM, то перед первым применением вам может потребоваться добавить её в меню (как это сделать, читайте в предыдущей статье).
Хорошая новость: начиная c версий после 2019 года компания Microsoft анонсировала включение Power Pivot во все версии Excel.
Работа с данными в Power Pivot
Как правило, разработка отчетов в Power Pivot происходит в следующем порядке:
- Подключение к внешним источникам данных. При загрузке в Power Pivot данные сжимаются в несколько раз с помощью специальных механизмов оптимизации.
- Объединение таблиц в модель данных с помощью создания связей между ними.
- Аналитические вычисления с помощью DAX-формул.
- Построение сводных таблиц и диаграмм на основе модели данных.
Подключения к источникам, связи и вычисления настраиваются в отчете один раз. При изменении исходных данных отчеты можно обновить в меню Данные → Обновить все. Давайте разберем подробнее, как это работает.
Добавление данных в Power Pivot
Чтобы начать работать с Power Pivot, перейдите на вкладку меню Power Pivot → нажмите Управление. Добавить данные в открывшейся надстройке можно несколькими способами:
- С помощью встроенных инструментов импорта.
- Добавить данные из Power Query.
- Также таблицу с данными можно просто скопировать и вставить в Power Pivot из буфера обмена в меню Главная → Вставить.
Способ 1. Подключение к данным с помощью встроенных инструментов импорта.
В Power Pivot есть свои инструменты для импорта внешних данных, которые можно найти на вкладке Главная → кнопки Из базы данных, Из службы данных, Из других источников.
С помощью встроенных инструментов настраивается подключение к 15 видам источников данных.
Увидеть весь список можно в окне «Мастер импорта таблиц», которое открывается в меню Главная → Из других источников.
Настроим подключение к данным на примере файла Excel. Укажите путь к файлу, поставьте галочку «Использовать первую строку в качестве заголовков столбцов», выберите таблицы, жмем «Готово». У вас в окне включится счетчик импорта строк — работает довольно быстро. В результате импорта в окне Power Pivot появятся вкладки с таблицами.
Способ 2. Добавить данные из Power Query.
Загрузка данных с помощью инструментов Power Pivot делается легко, но Power Query лучше подходит для импорта и значительно расширяет возможности аналитики. В нем намного больше доступных источников и возможностей для обработки таблиц произвольного вида.
Чтобы настроить подключение с помощью Power Query, вам нужно создать запрос к источнику данных. Список ранее созданных запросов находится на вкладке «Запросы и подключения». Нажмите на запрос правой кнопкой мышки и выберите Загрузить в… В открывшемся окне доступных вариантов импорта поставьте галочку «Добавить эти данные в модель данных». Задать настройки импорта также можно в самом редакторе Power Query.
К сожалению, в Excel 2010 Power Pivot почти невозможно «подружить» с Power Query и этот новый функционал в старом Excel сильно ограничен.
Интерфейс Power Pivot
Разберем подробнее интерфейс Power Pivot.
В окне Power Pivot есть:
- Лента редактора для вкладок меню Главная, Конструктор, Дополнительно.
- Строка формул на языке DAX.
- Область данных и вычисляемых столбцов.
- Добавление нового вычисляемого столбца.
- Область вычислений, в которой можно писать меры.
- Меню, которое появляется при нажатии правой кнопкой мышки.
- Ярлычки с названиями таблиц данных для переключения между ними (как между листами в «обычном» Excel).
Модель данных и связи
Чтобы перейти к настройке связей между таблицами, выберите в меню Главная → Представление диаграммы (вернутся обратно к просмотру таблиц можно, нажав Представление данных).
Модель данных в Power Pivot – это набор таблиц, объединенных связями.
Графически связь таблиц обозначается линией между ними, как в примере на рисунке. Чтобы создать связь, выделите мышкой поле в одной таблице и «перетащите» его на соответствующее ему поле в области другой таблицы.
Power Pivot поддерживает типы связей «один к одному», «один ко многим».
- Понять, какой именно вид связи задан между таблицами, можно с помощью значков на концах линий: на стороне «один» стоит символ единица — «1», а на стороне «многие» — звездочка «*». Если между таблицами задана связь «один к одному», то на концах линии будут единички «1».
- Поля, которые используются для создания связей, называются ключами связи. В таблицах, которые находятся на стороне «один» (конец линии с единичкой «1») в ключевых столбцах должны содержаться только уникальные значения. В таблицах на стороне «многие» со звездочкой «*» в ключевых столбцах те же значения, но они могут повторяться много раз.
- Стрелка на линии связи обозначает направление фильтрации. Так, на рисунке выше справочники Товары и Города фильтруют таблицы ДанныеФакт и ДанныеПлан.
Если выделить мышкой линию связи в модели данных, то можно увидеть, с помощью каких полей задана связь. Выделенные линии можно удалять. Или, щелкнув по ним дважды, менять связи в открывшемся окне. Также управление связями доступно в окне, которое открывается в меню Конструктор → Управление связями.
Вычисления в Power Pivot
Формулы Power Pivot пишут на языке DAX (Data Analysis Expressions, выражения для анализа данных). DAX-формулы позволяют, по аналогии с формулами Excel, выполнять вычисления и/или настраивать произвольную фильтрацию и представление данных в таблицах.
Язык DAX впервые появился в 2010 году вместе с надстройкой Power Pivot. В этом языке сотни функций, с помощью которых можно создавать аналитические расчеты. Кроме Power Pivot в Excel, DAX-формулы также доступны в Power BI и Analysis Services. То есть эти формулы вам точно пригодятся.
Вычисления с помощью DAX-формул создаются в виде:
- вычисляемых столбцов, как в обычных таблицах Excel.
- мер, которые пишут в области вычислений под таблицей.
Вычисляемые столбцы представляют собой столбцы в таблицах данных, созданные с помощью формул. Чтобы добавить такой столбец, щелкните мышкой дважды по столбцу слева «Добавление столбца», введите название вычисления, а затем знак «=» и формулу в строке формул.
Вычисляемый столбец похож на любой другой столбец в таблице. Также с помощью таких столбцов можно создавать связи в модели. Вычисляемые столбцы в Excel рассчитываются в момент загрузки (обновления) данных, а значения в самом столбце сохраняются, увеличивая размер файла. То есть столбцы – это статические вычисления.
Как и вычисляемые столбцы, меры тоже создаются с помощью DAX-формул. В отличие от столбцов, меры – это динамические вычисления, результат которых зависит от контекста – его можно увидеть в отчете, где мы задаем в разрезе каких полей, фильтров и др. вычислить меру. Меры записываются под таблицей в области вычислений.
Меры в Power Pivot можно превратить в KPI – ключевые показатели эффективности. Для этого выделите меру и нажмите на кнопку Создать KPI в меню Главная. Кроме мер, созданных пользователями, в Excel также есть неявные меры. Они создаются автоматически при формировании сводной таблицы, когда пользователь помещает данные в область значений. Чтобы посмотреть, есть ли у вас в Power Pivot неявные меры, выберите на вкладке Главная → Показать скрытые.
Отчеты на основе Power Pivot
Power Pivot отлично работает со сводными таблицами. Используя модель данных, пользователи могут создавать отчеты с помощью сводных таблиц и диаграмм. Чтобы создать сводную таблицу, выберите меню Главная → Сводная таблица.
В версиях Excel после 2013 года это можно сделать прямо из Excel в меню Вставка → Сводная таблица, выбрав там «Использовать модель данных этой книги». После этого откроется стандартное меню, уже знакомое вам по работе с обычными сводными таблицами.
Вид этого окна может немного отличаться в зависимости от версии Excel.
Так как данные в Power Pivot связаны, можно создать одну сводную таблицу на основе нескольких таблиц. Например, добавить в область строк и столбцов значения из справочников, а в область значений – меры, записанные с помощью DAX-формул.
Подключения к источникам данных и вычисления настраиваются в отчете один раз. Если данные в источниках поменяются, то для повторного выполнения вычислений достаточно нажать на кнопку Обновить все на вкладке Данные.


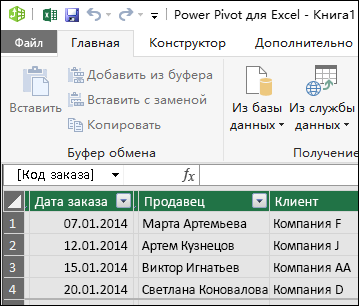

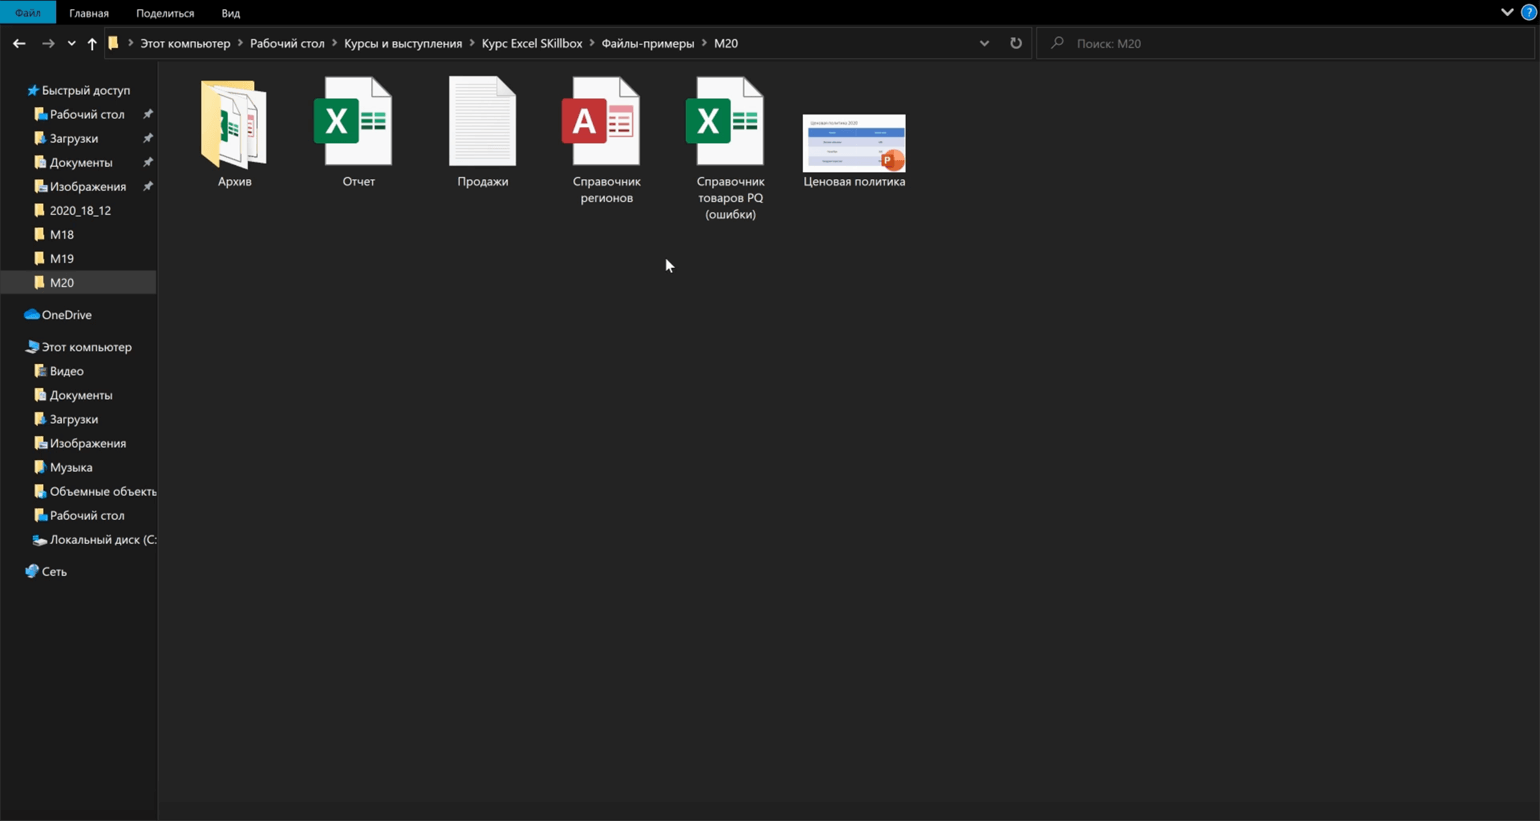
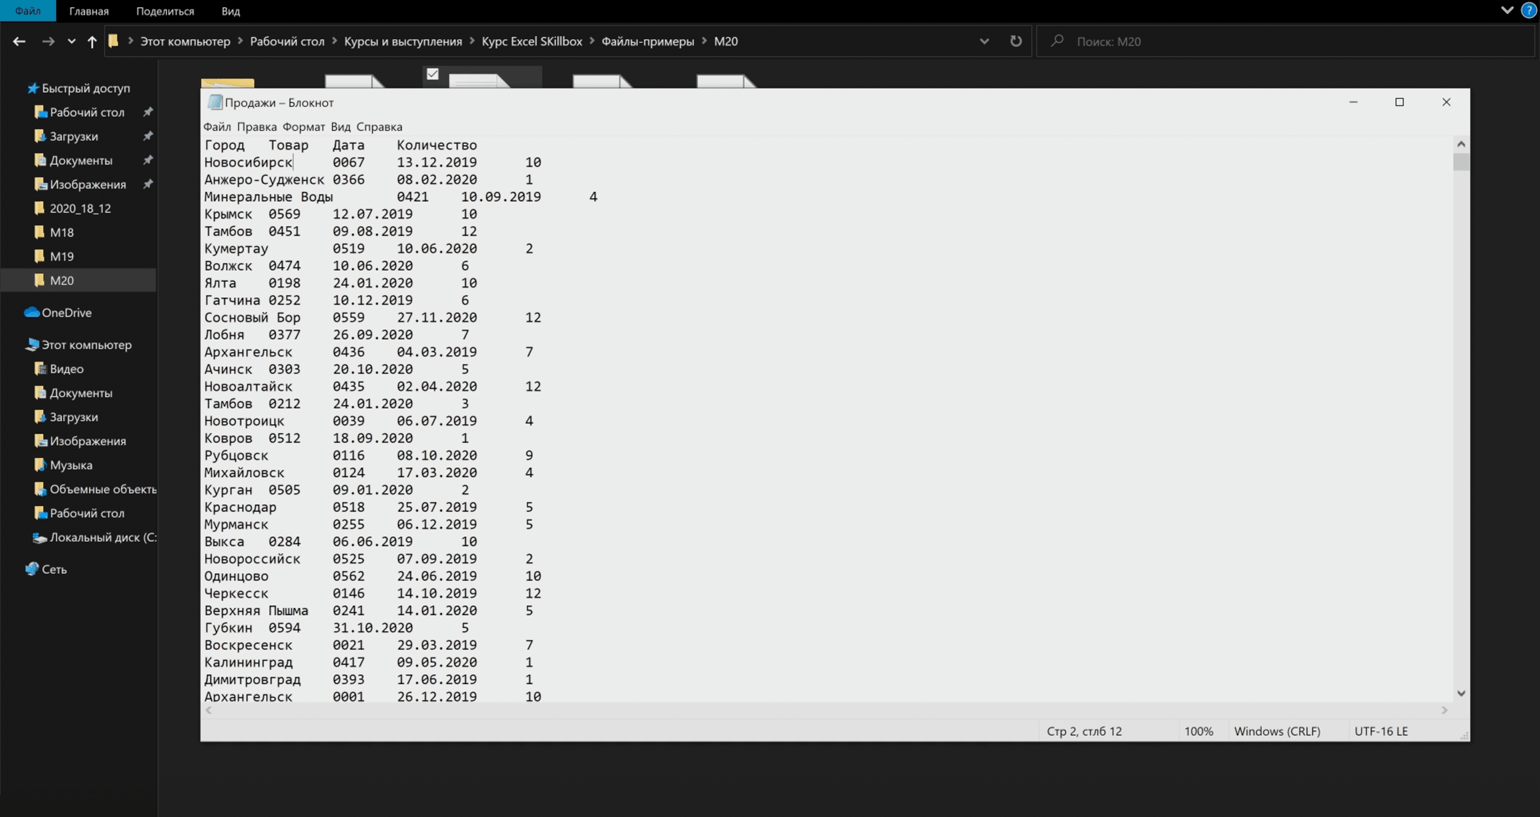
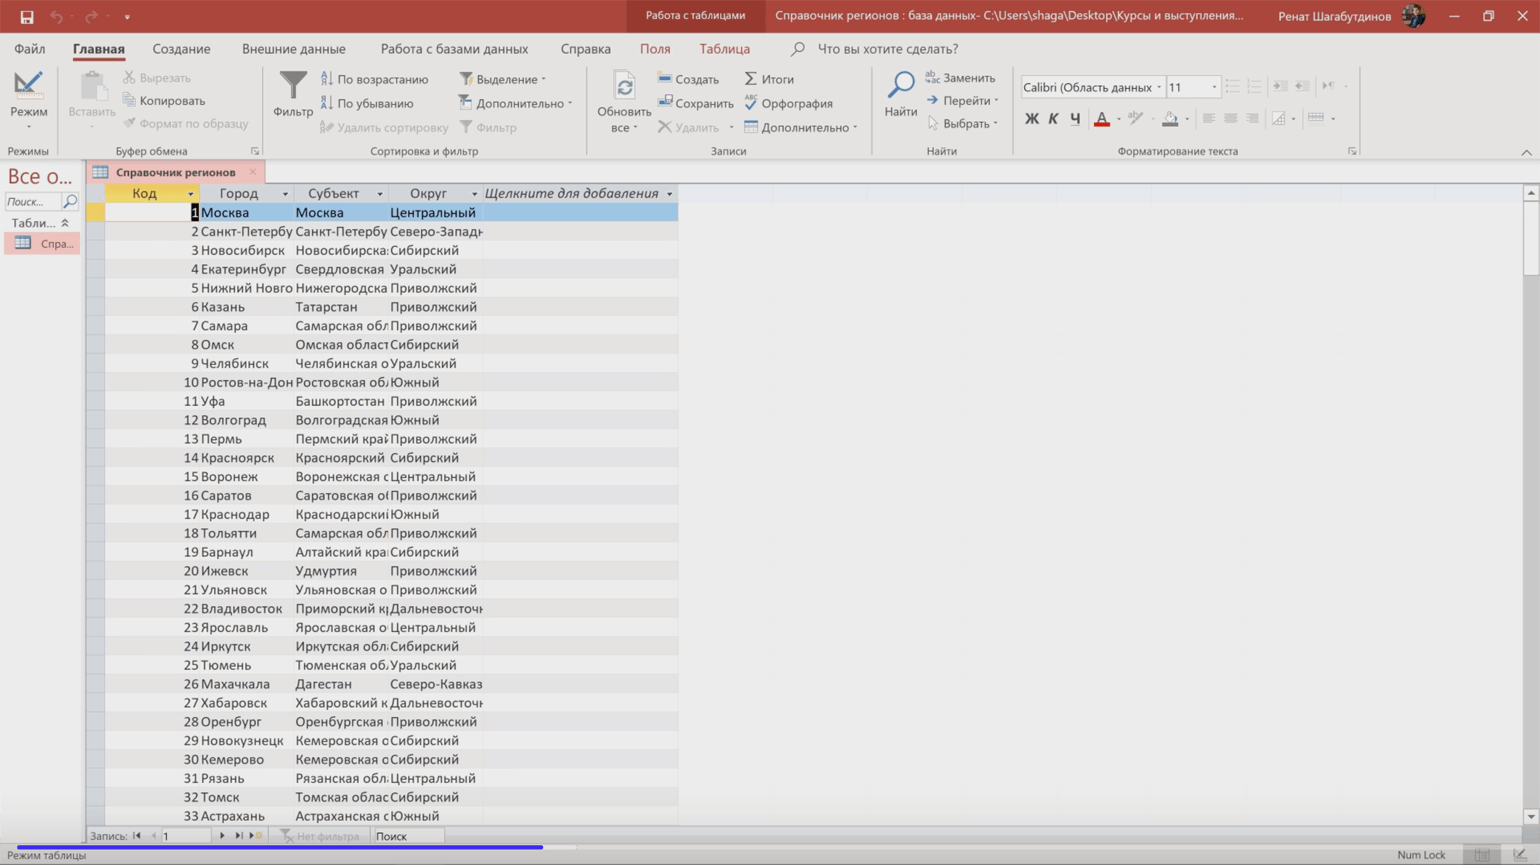
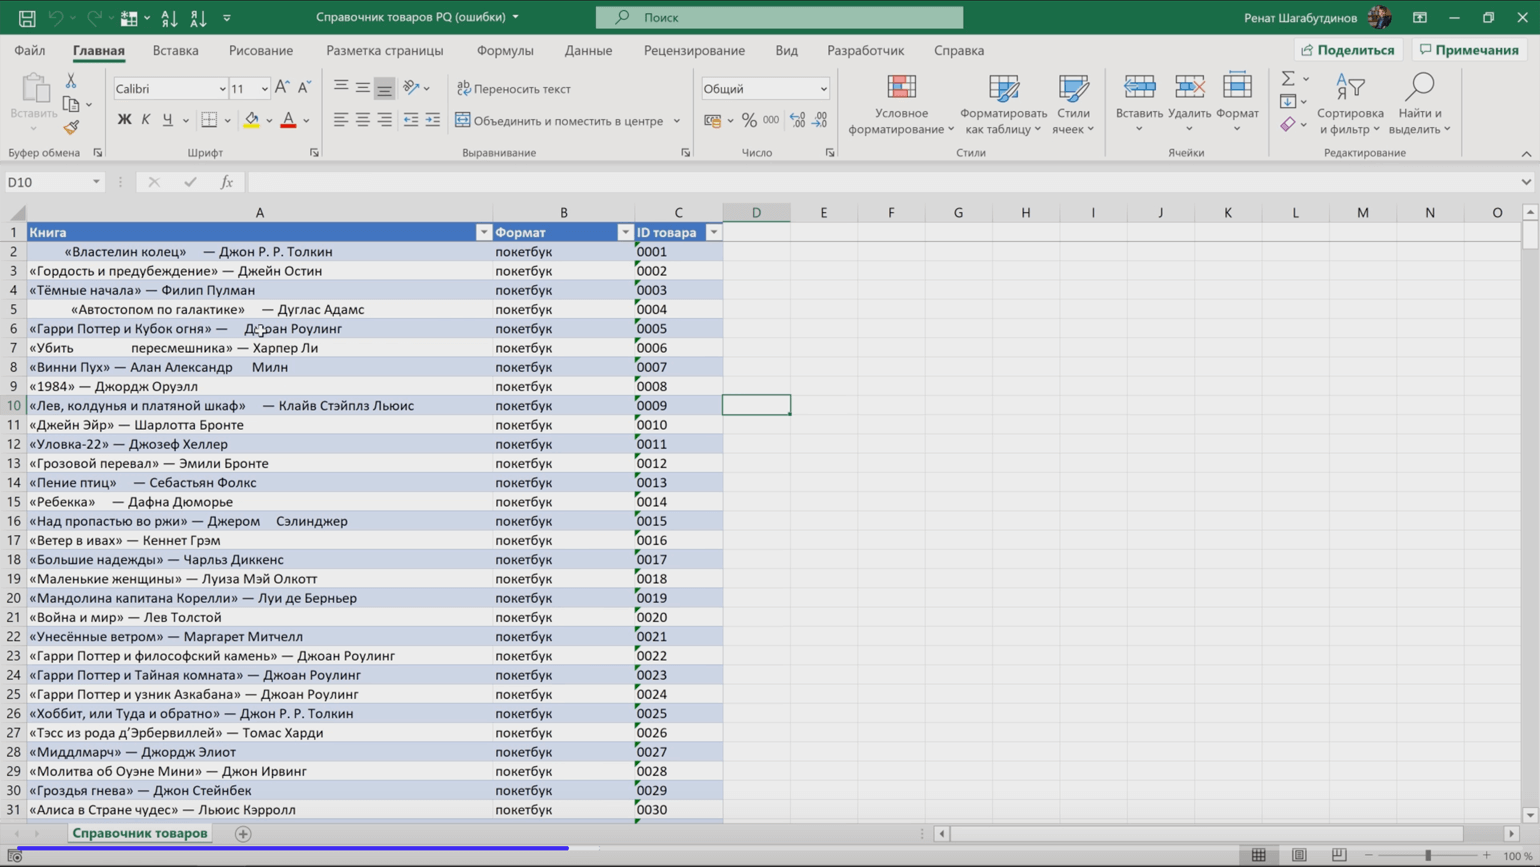
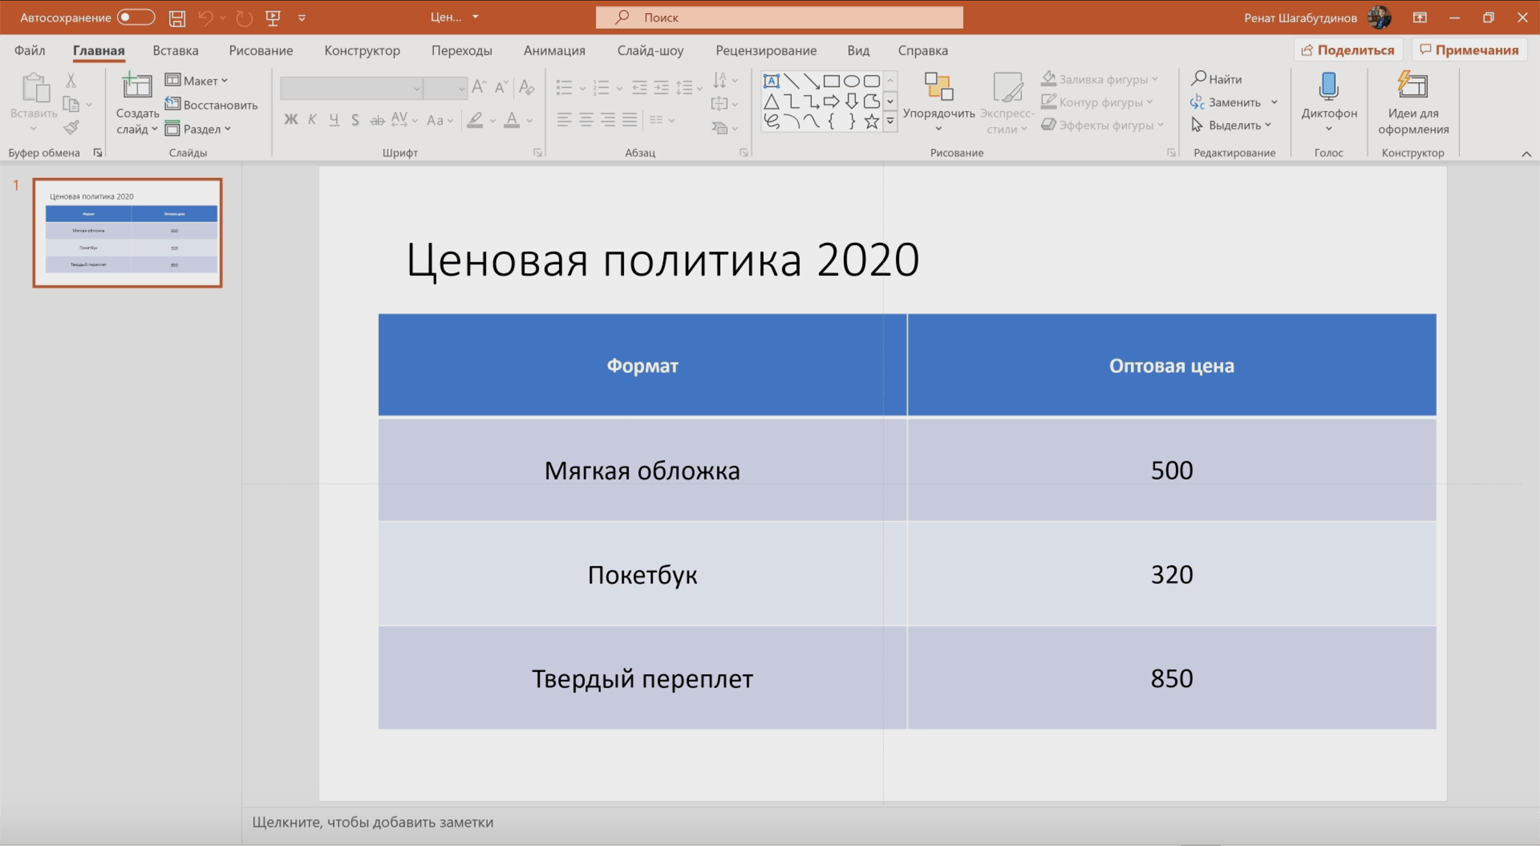
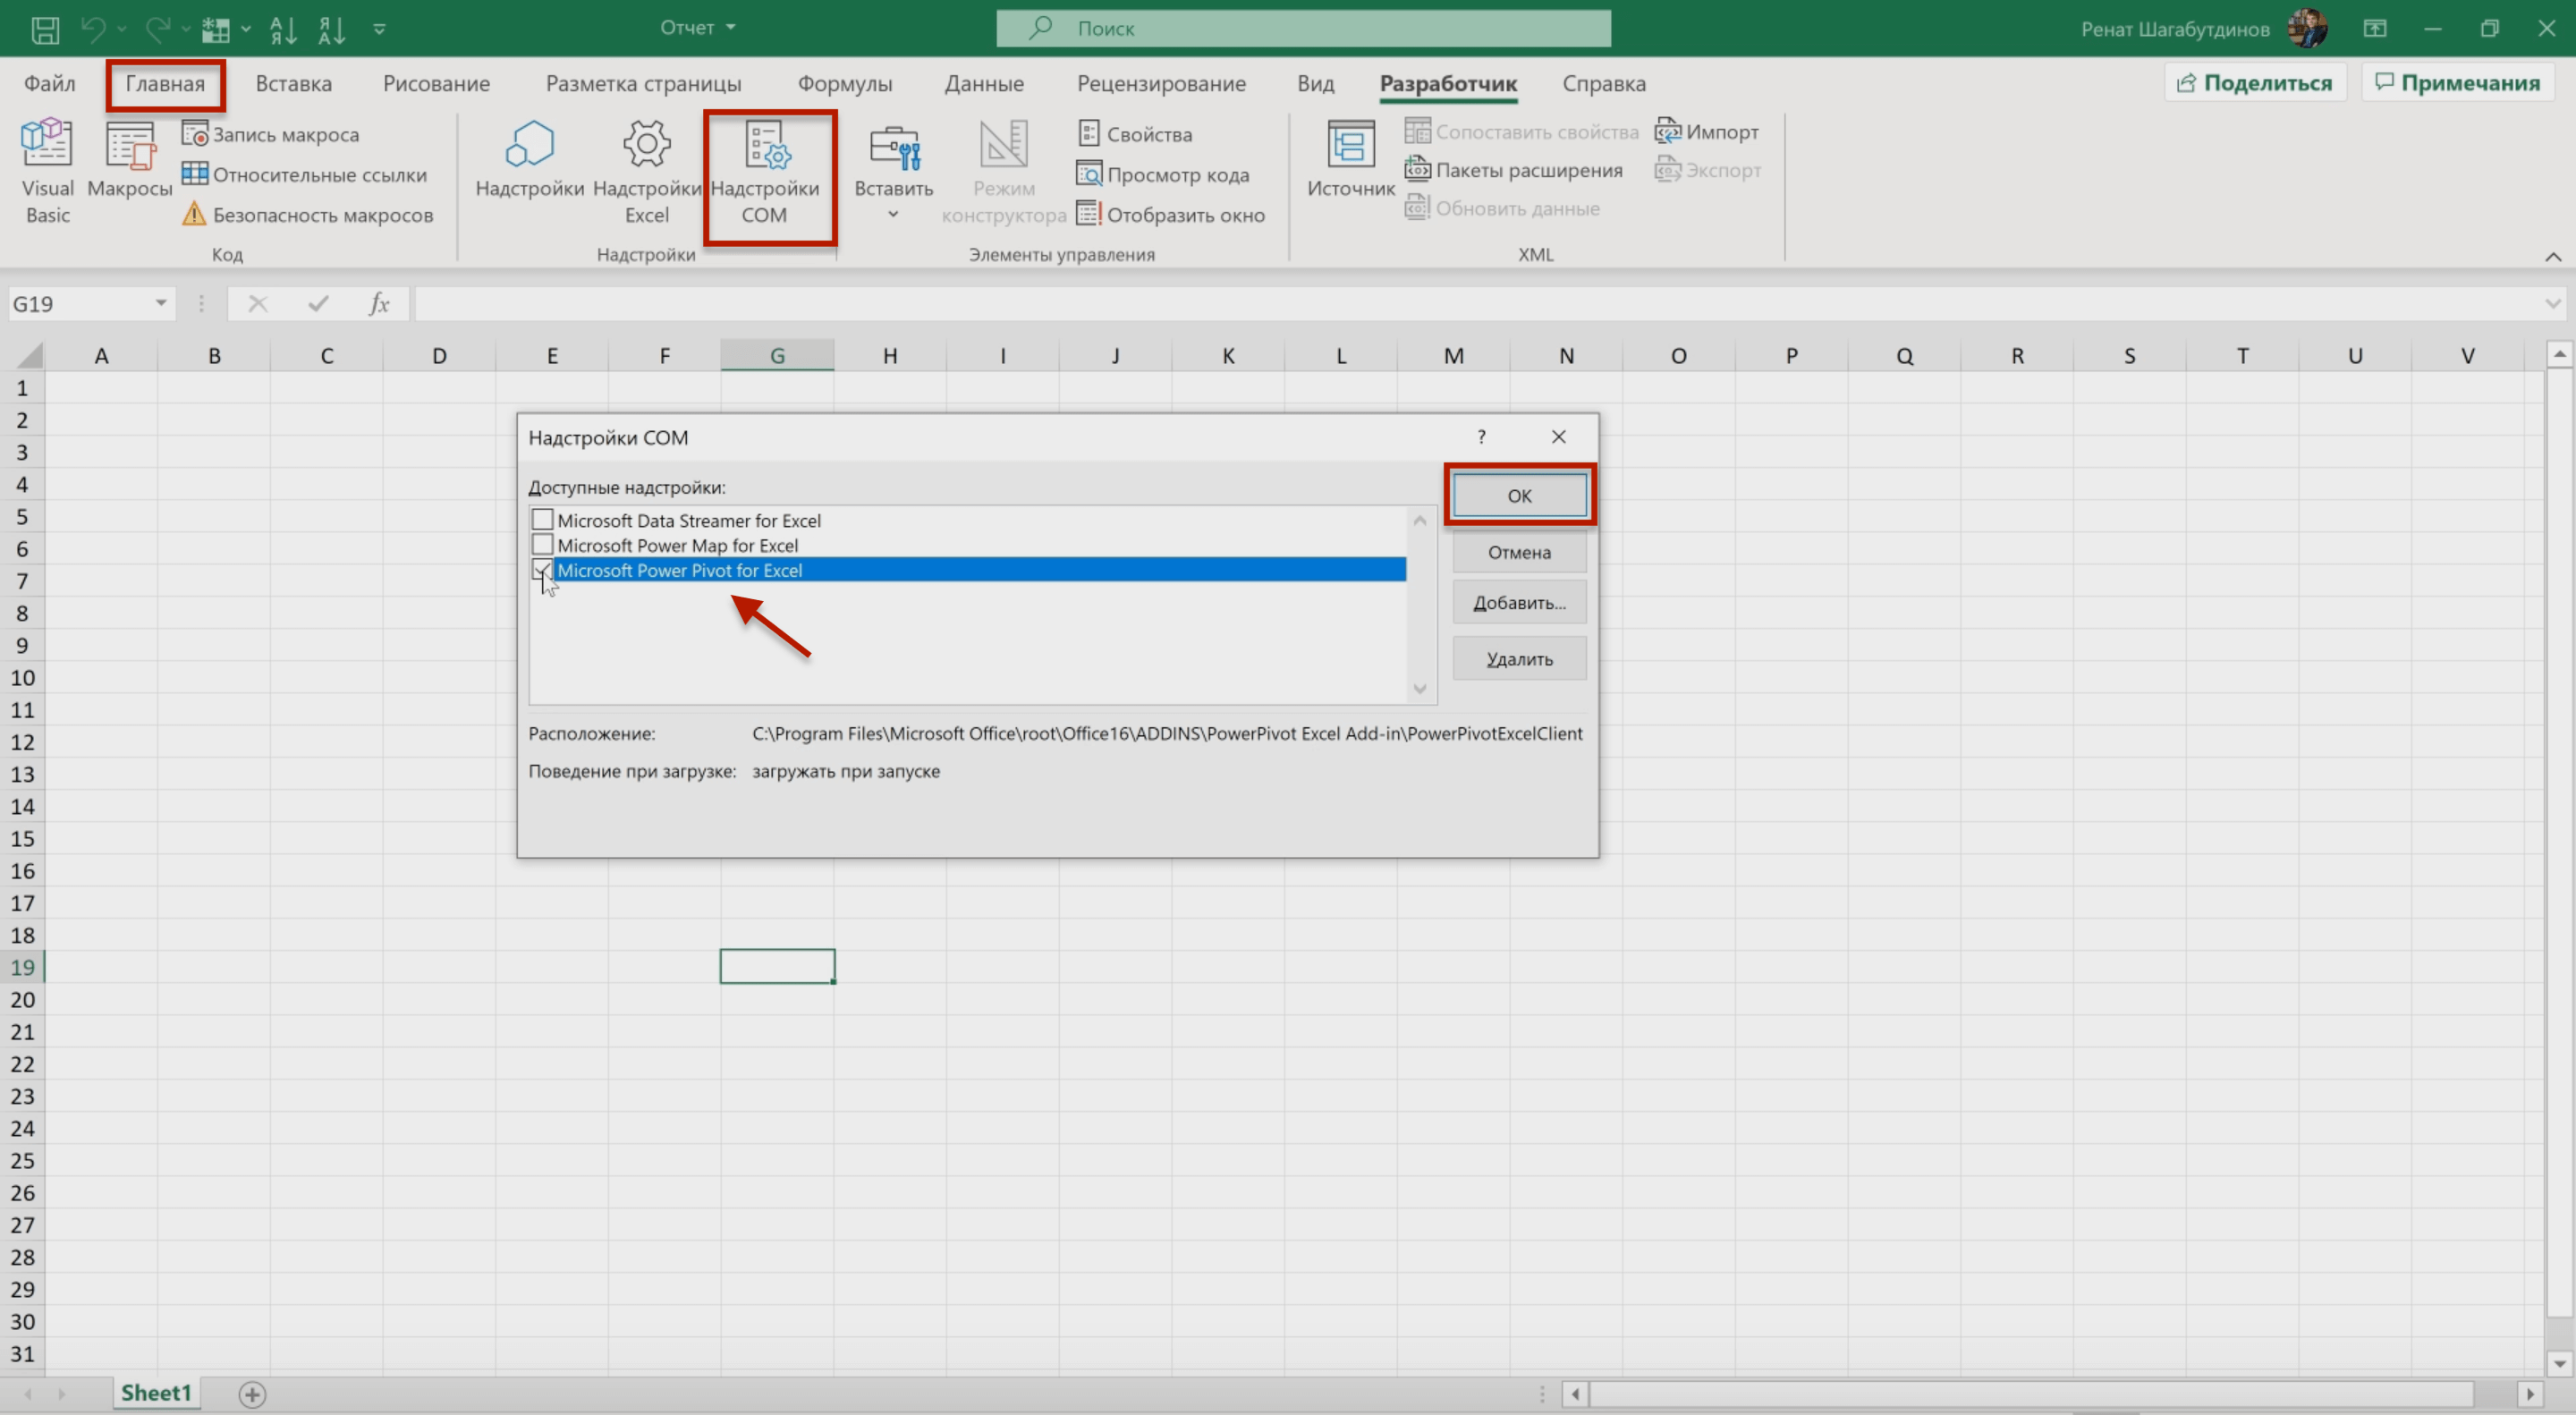
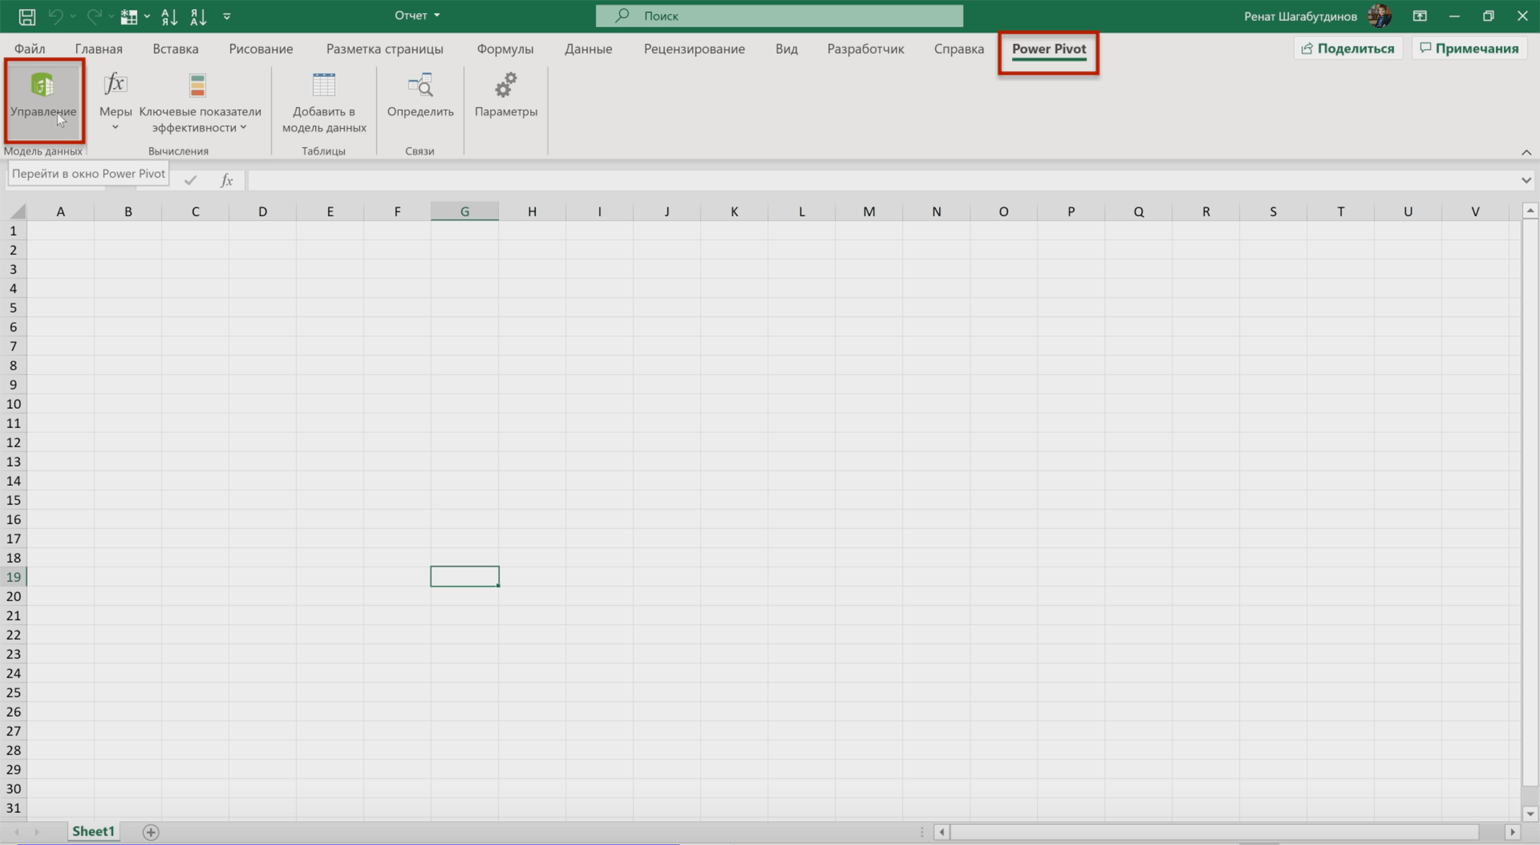


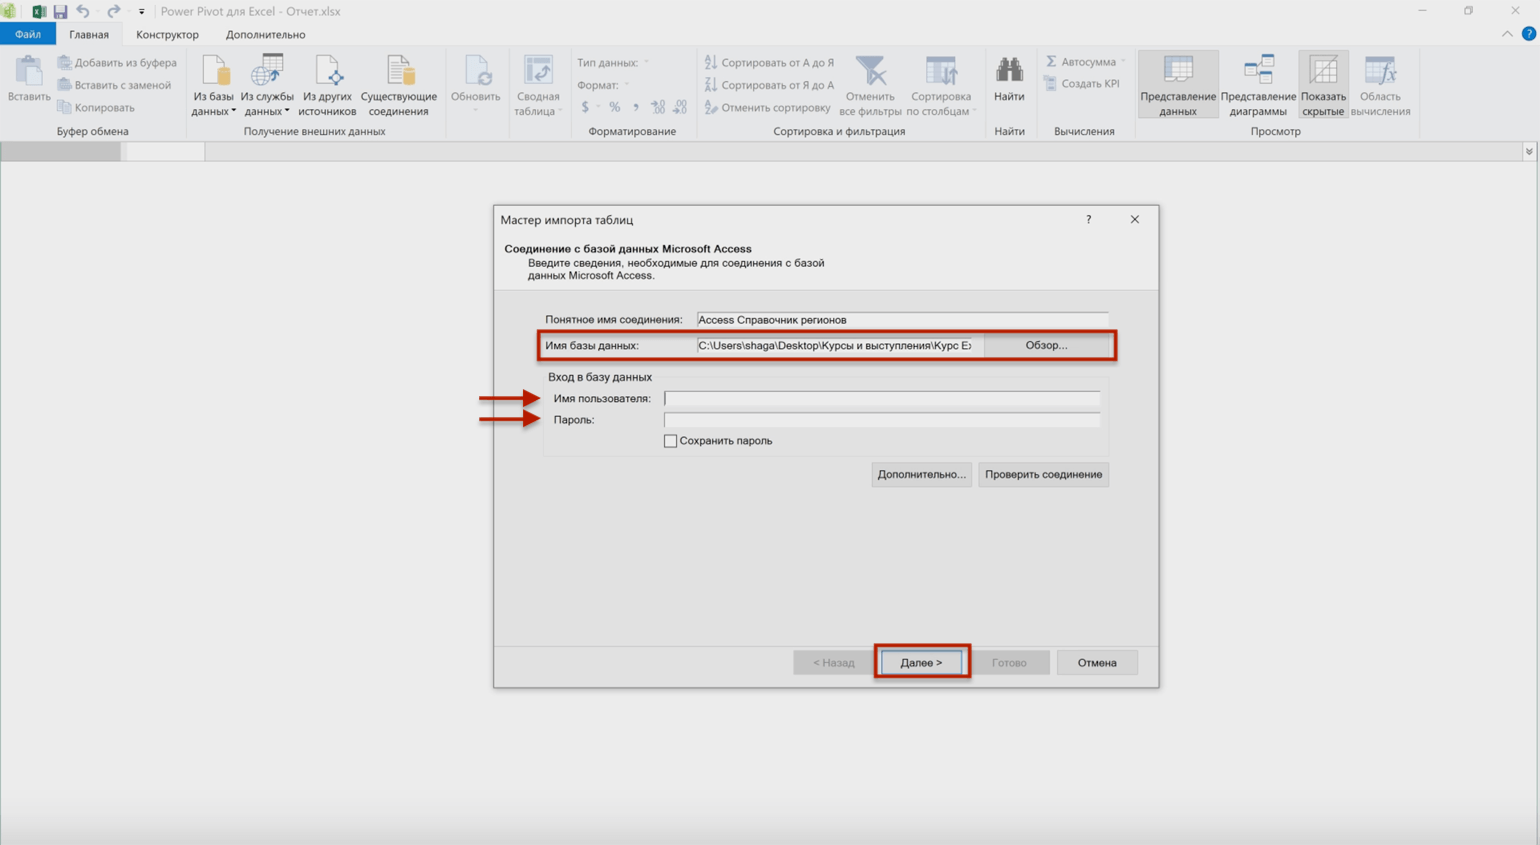
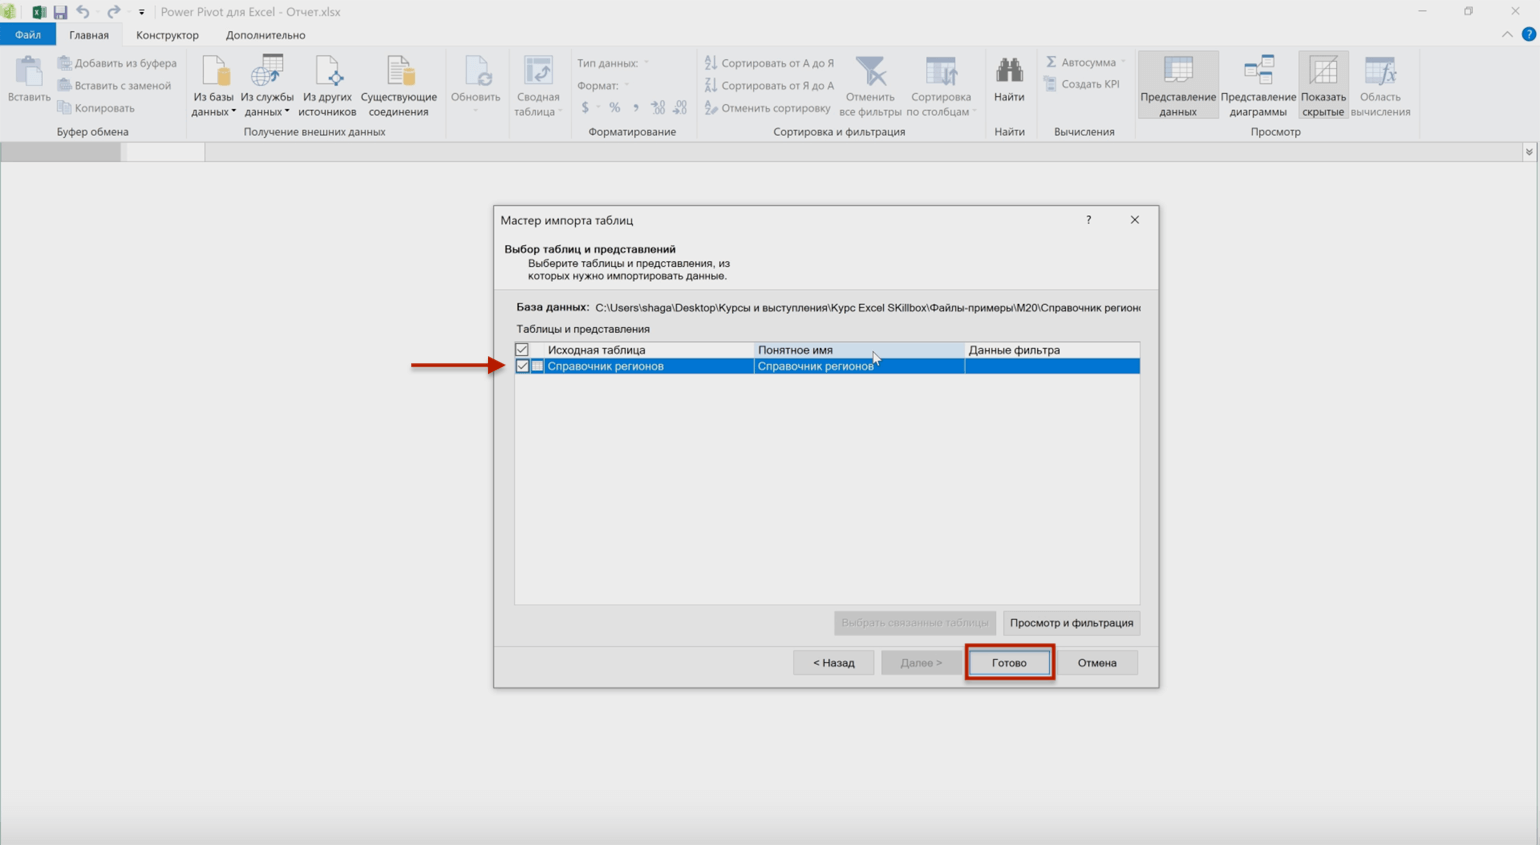
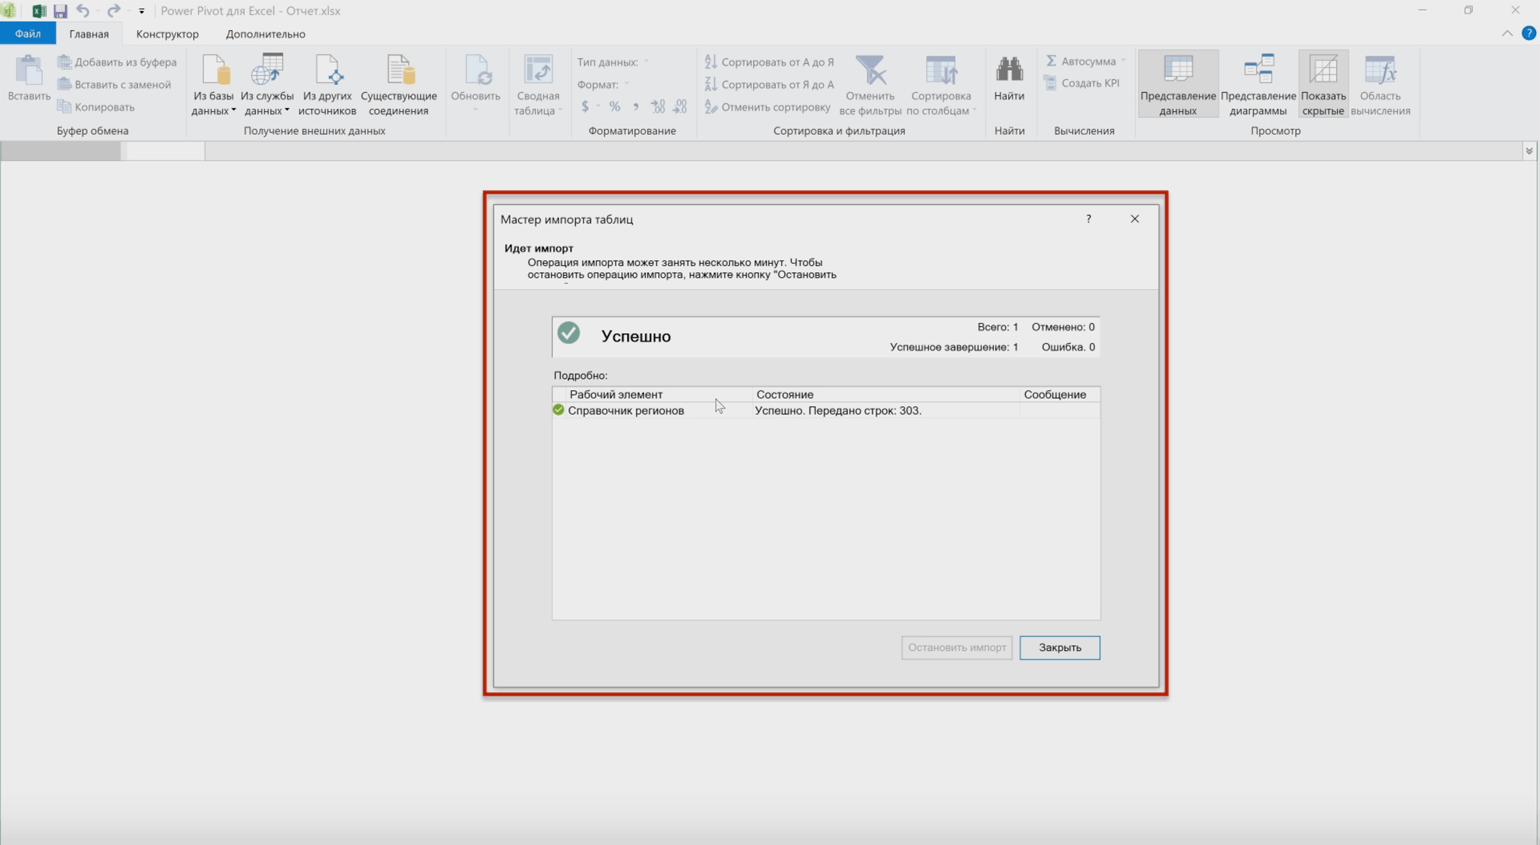
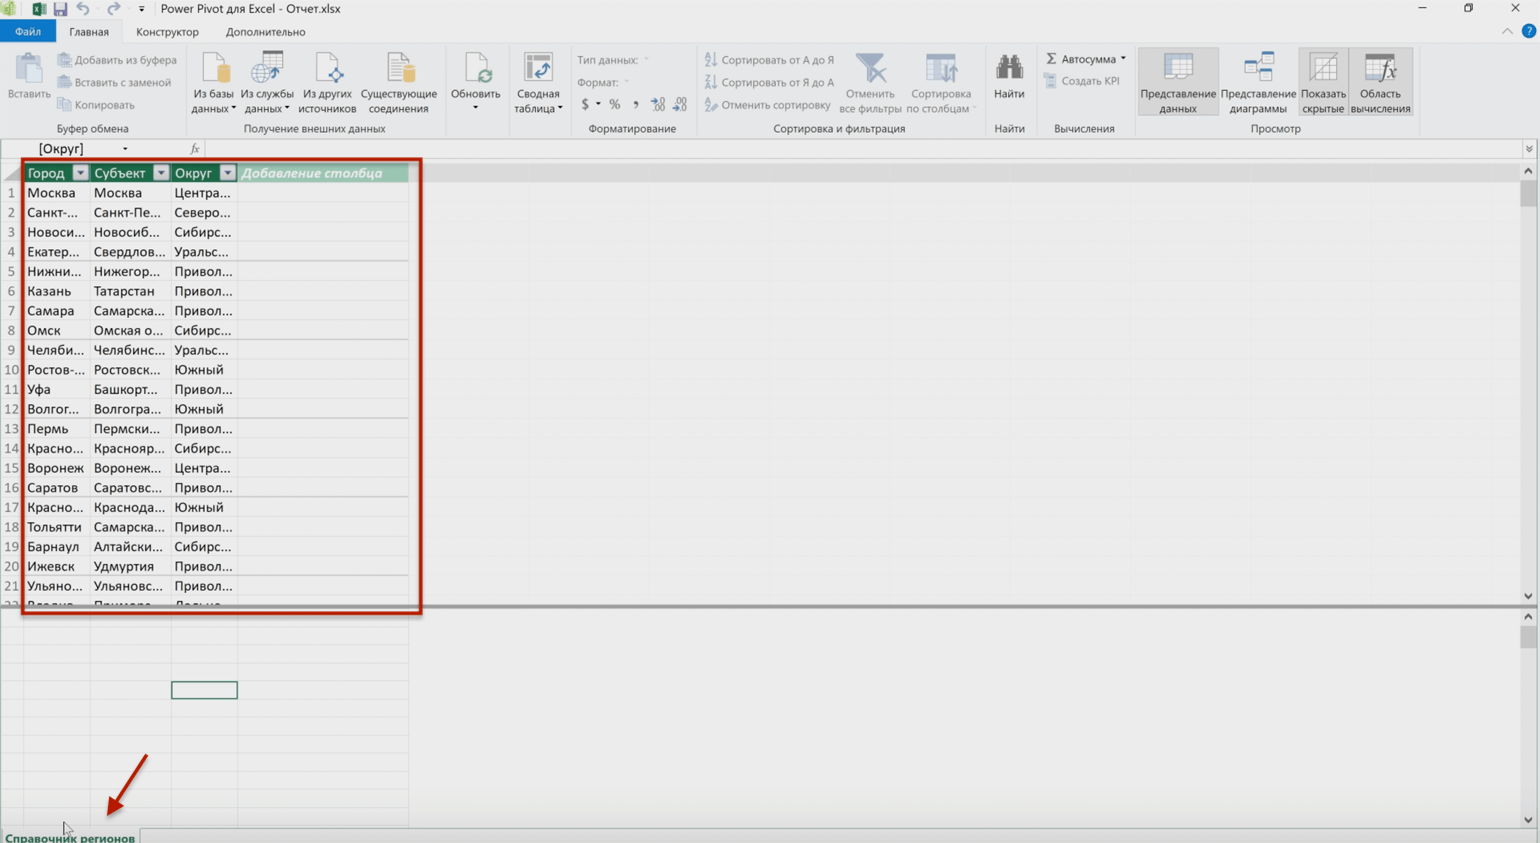
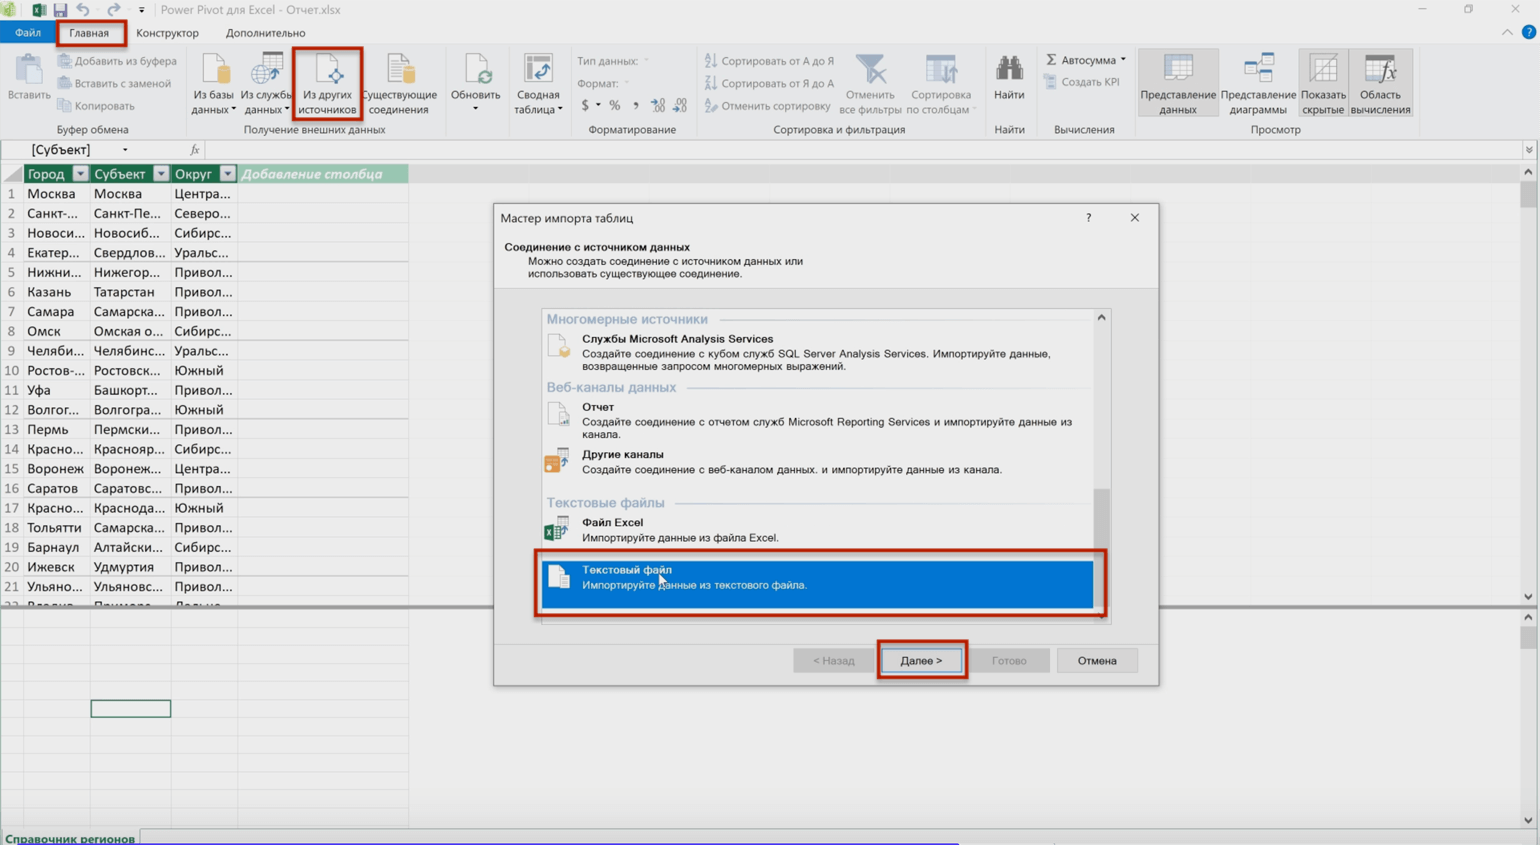
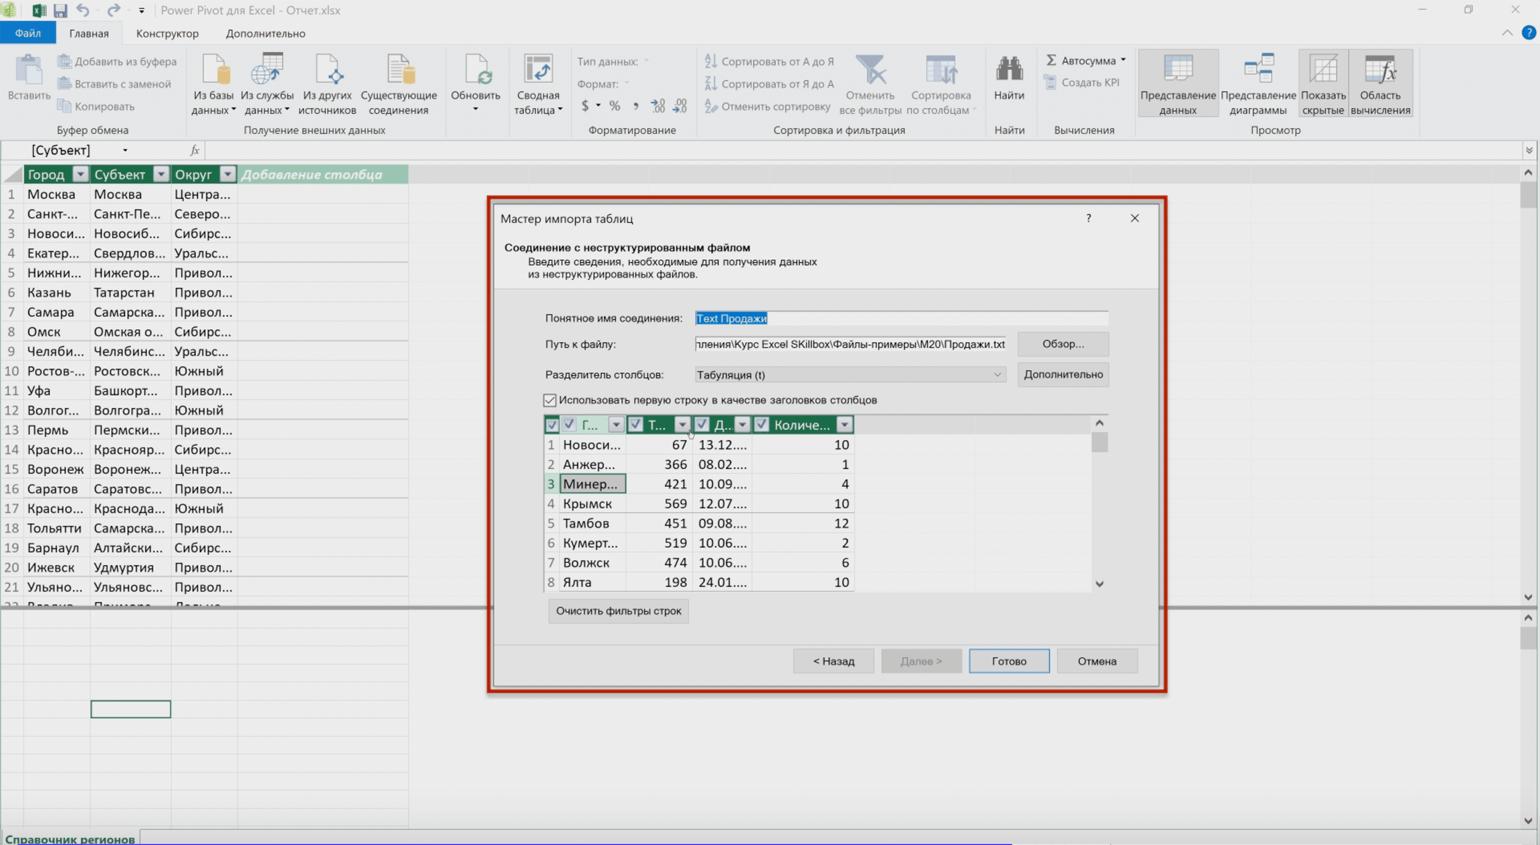
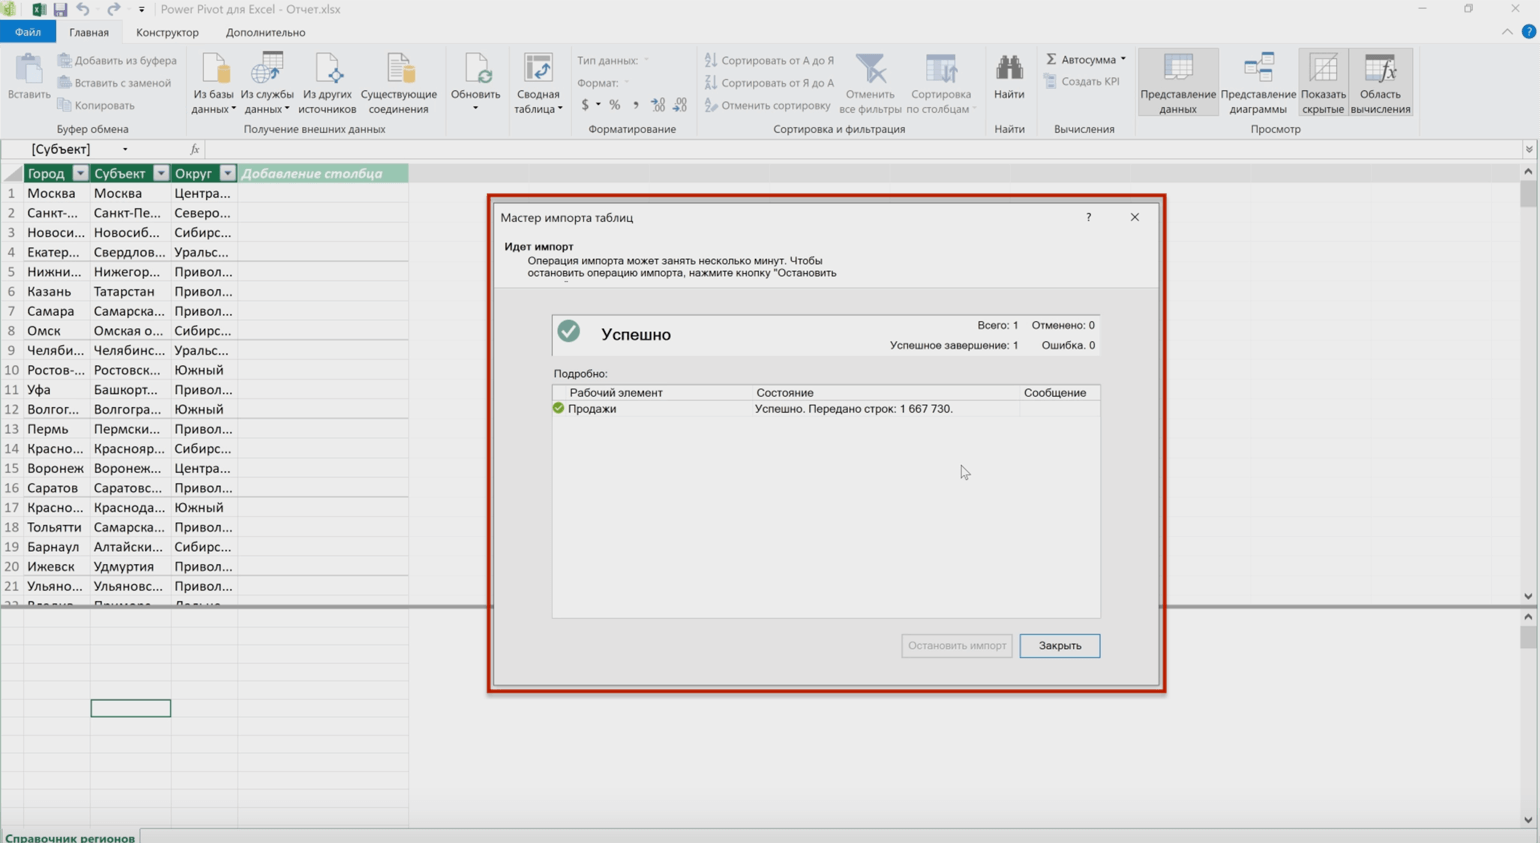
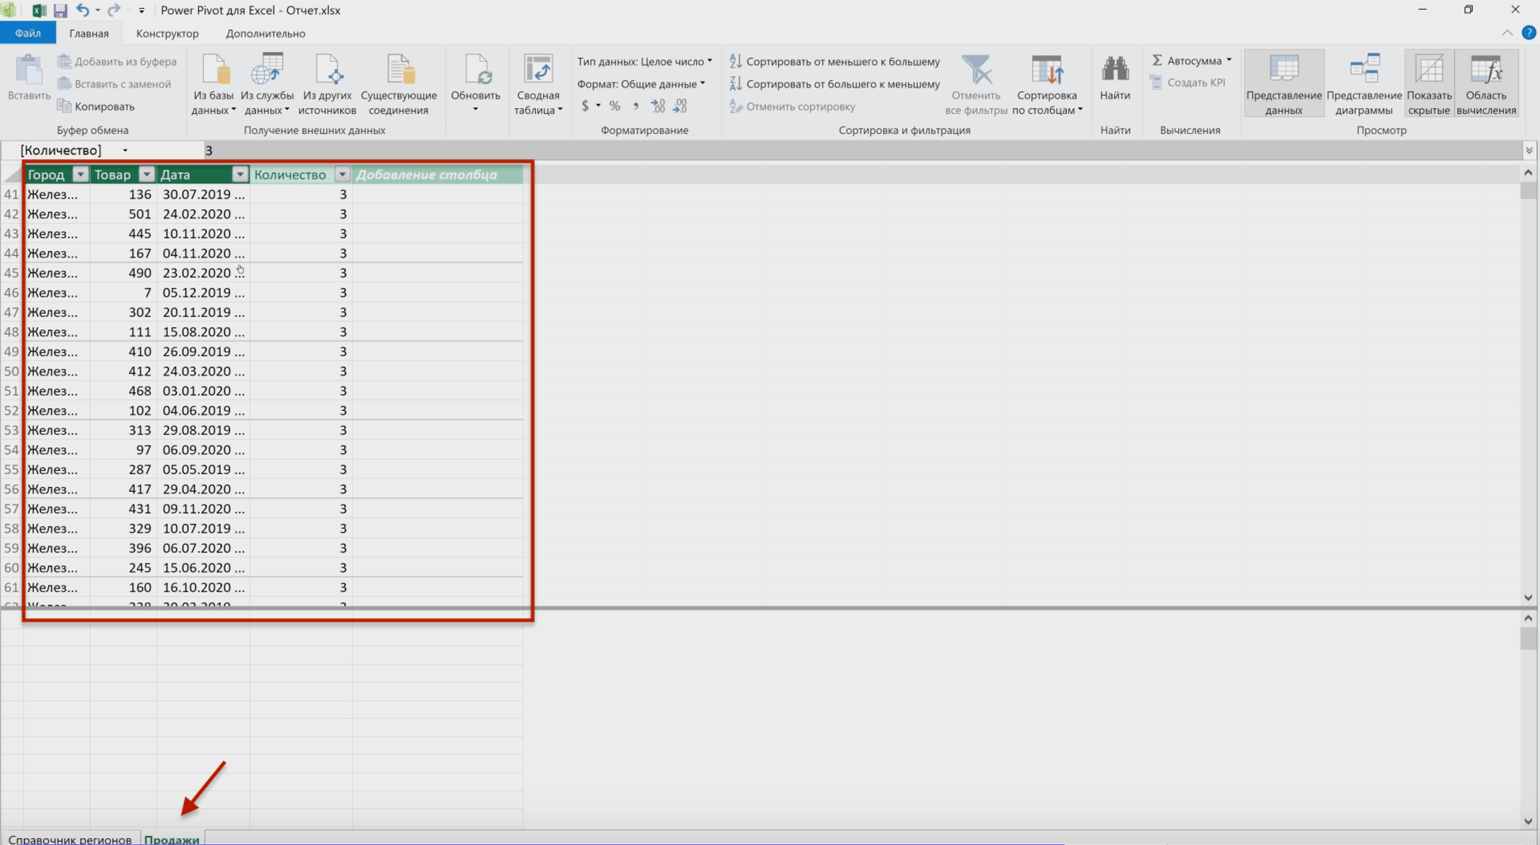
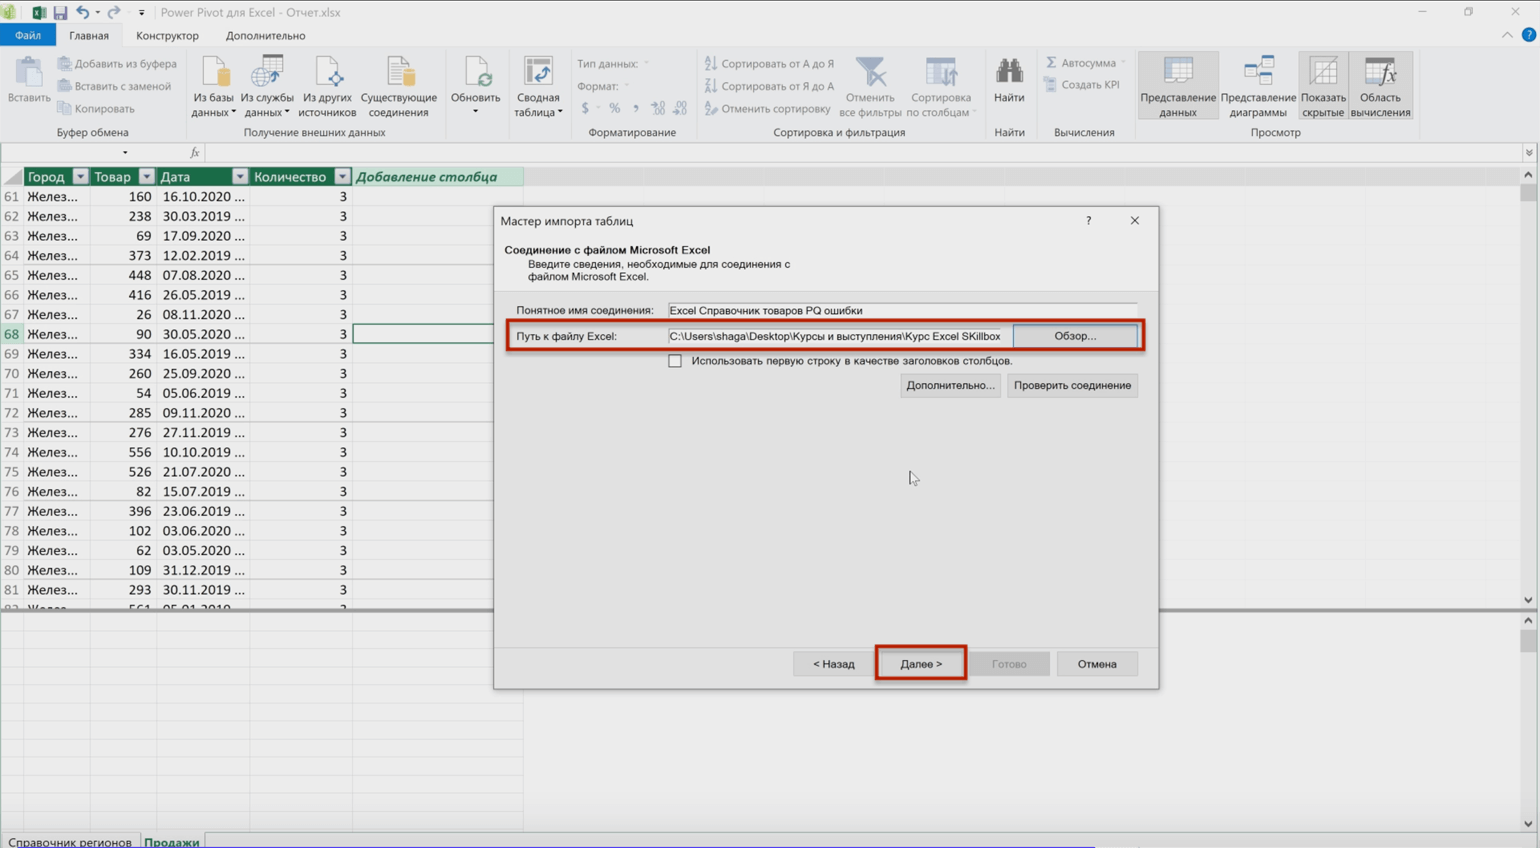
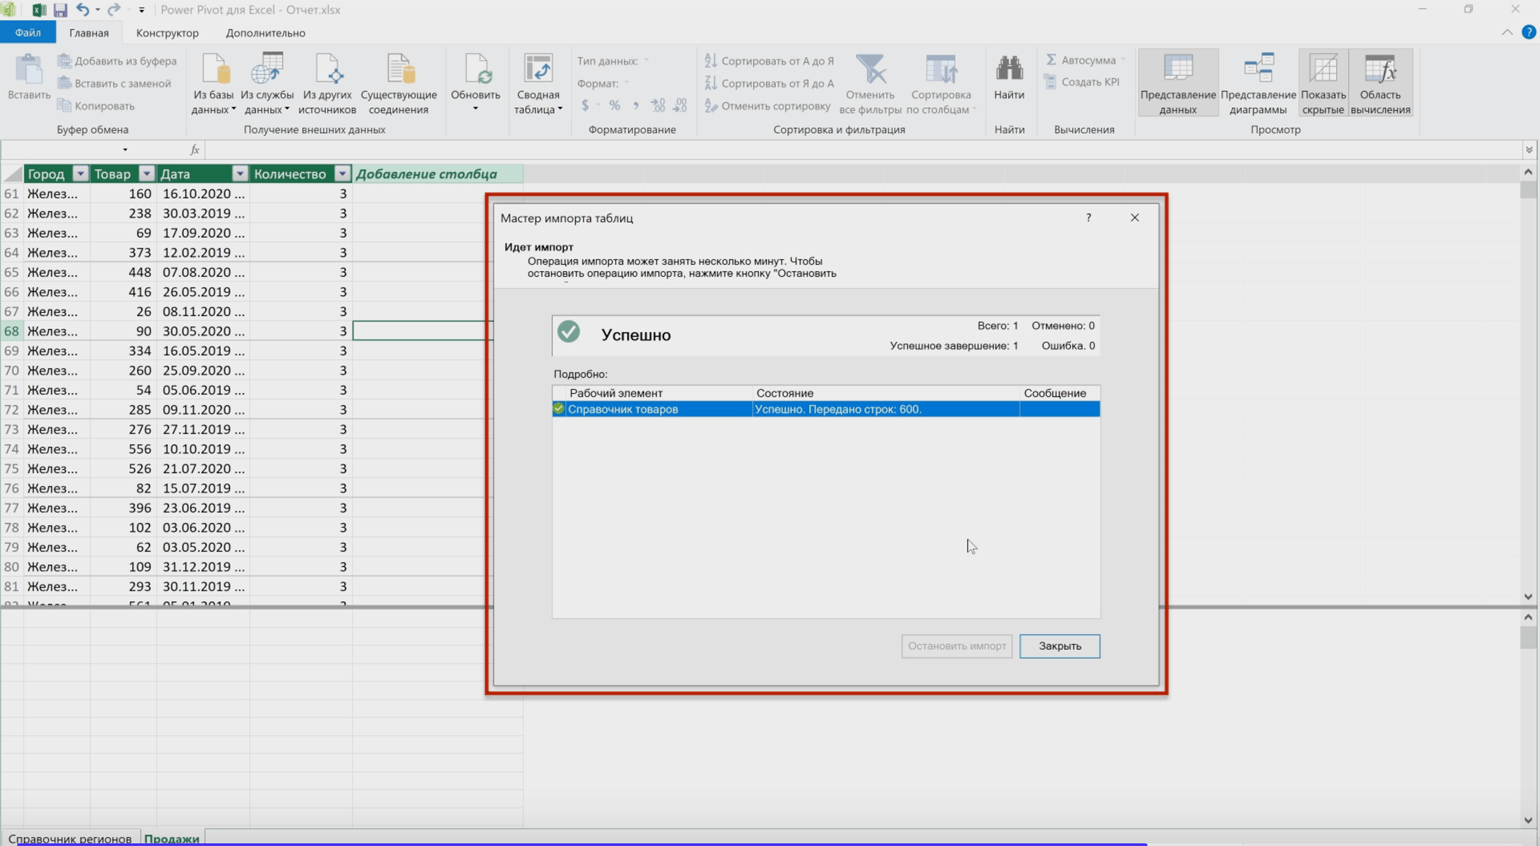
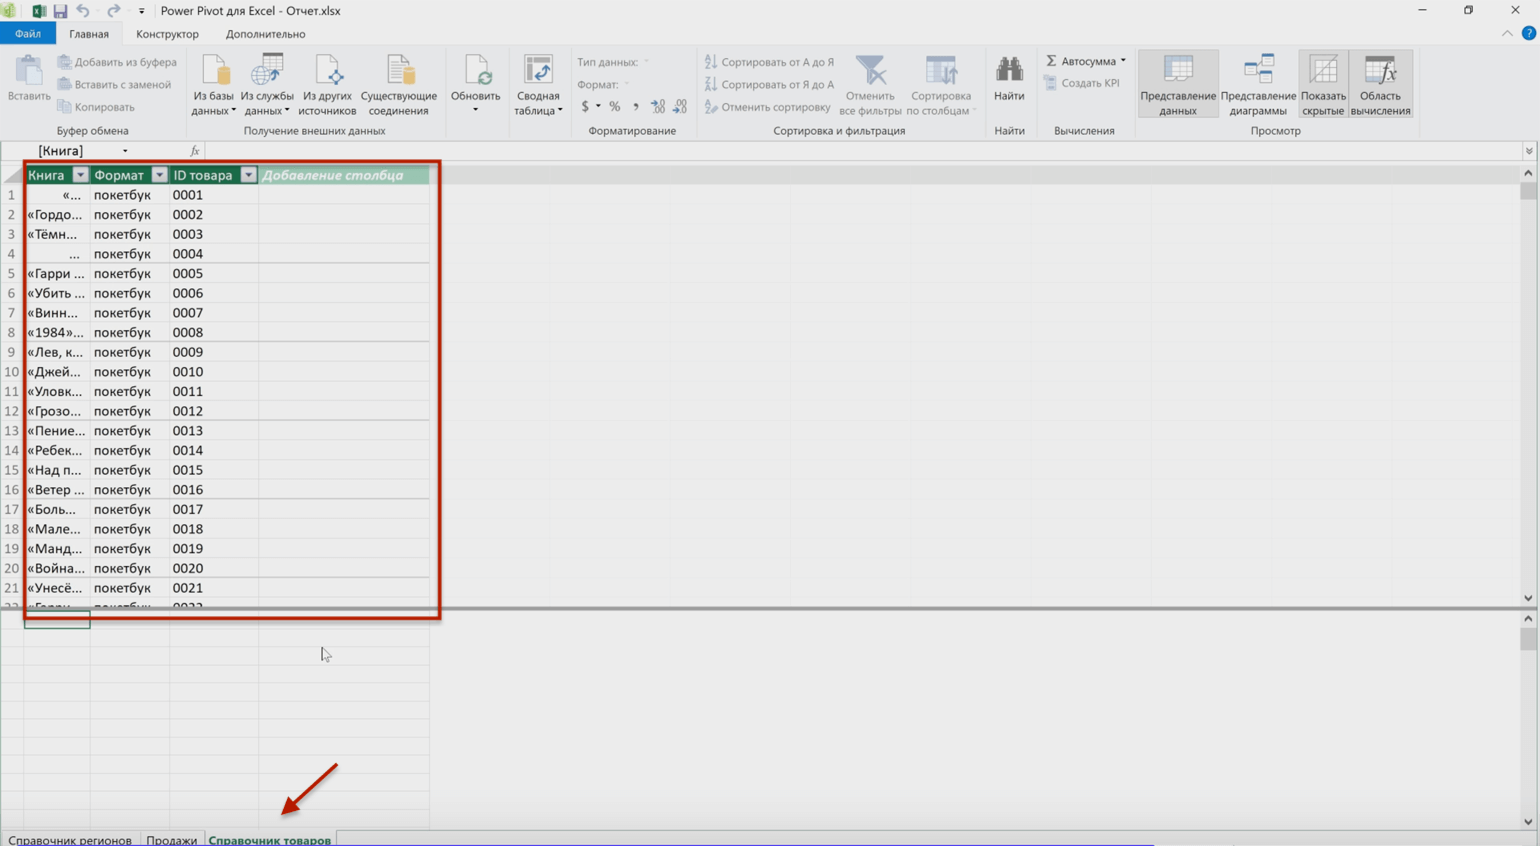
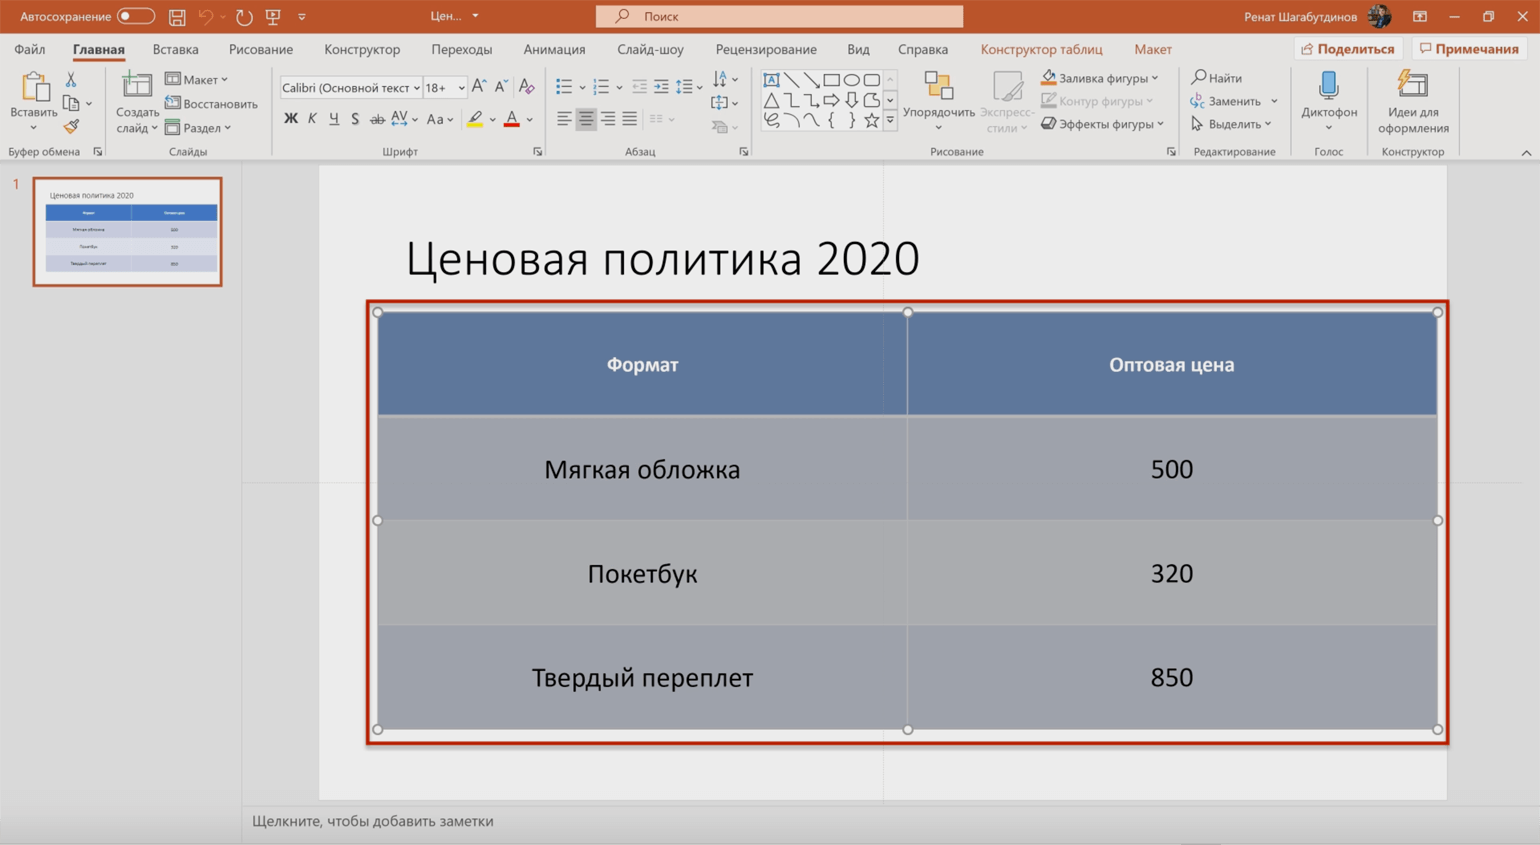
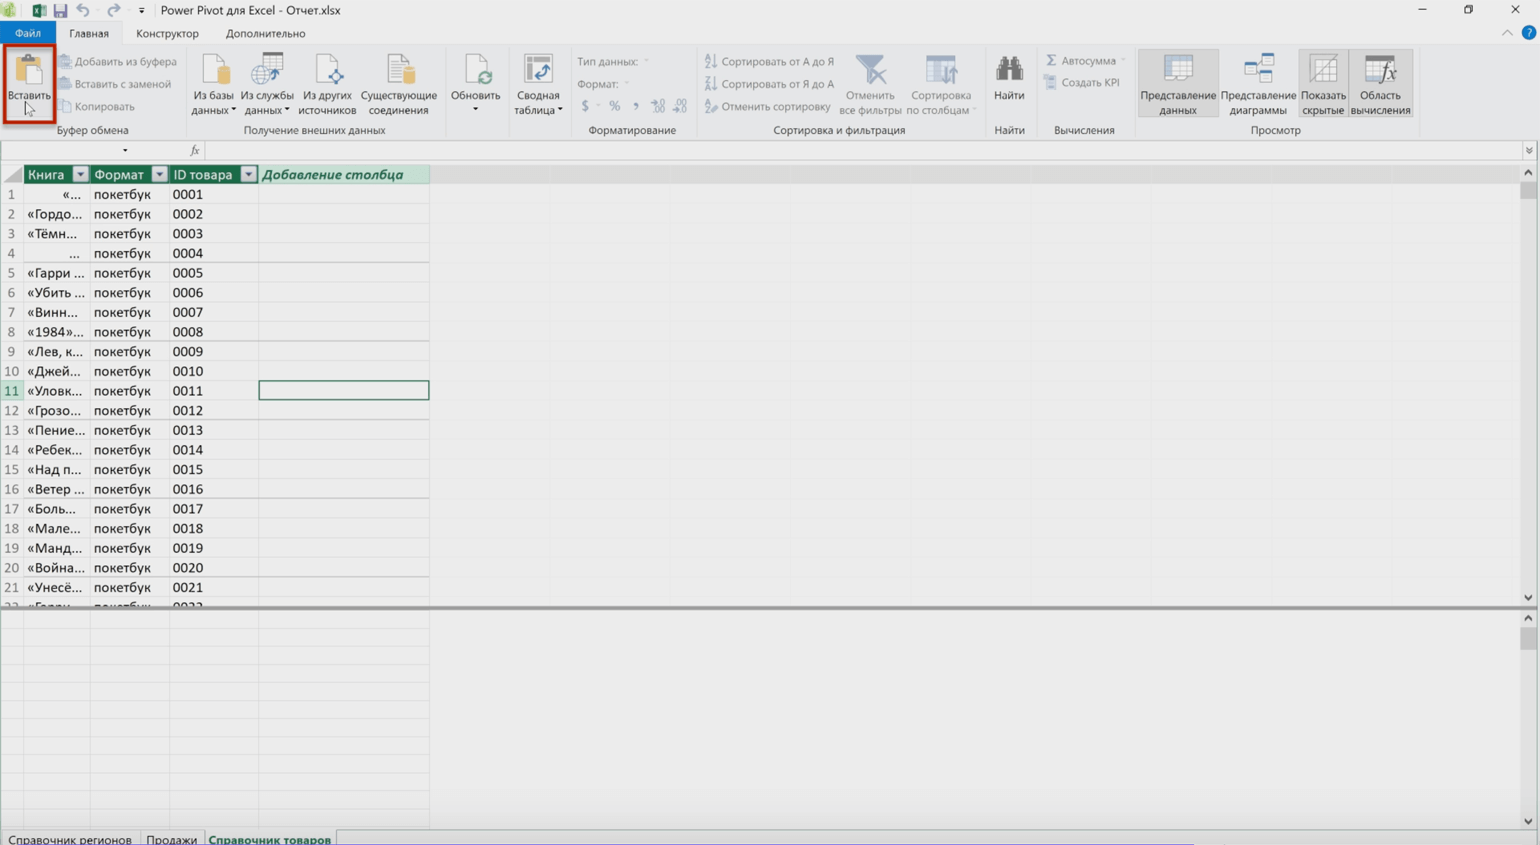
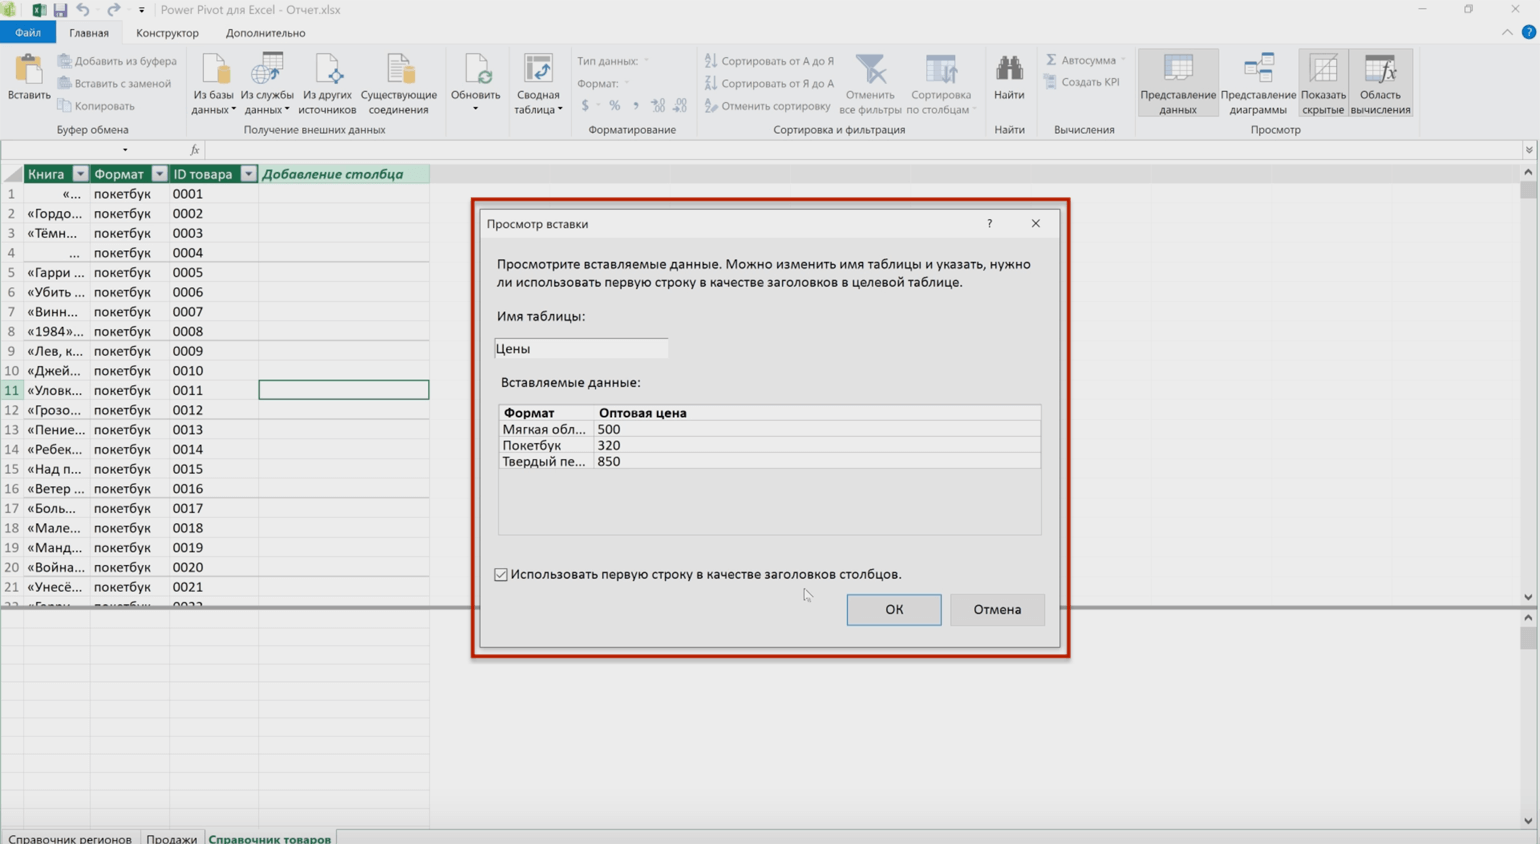
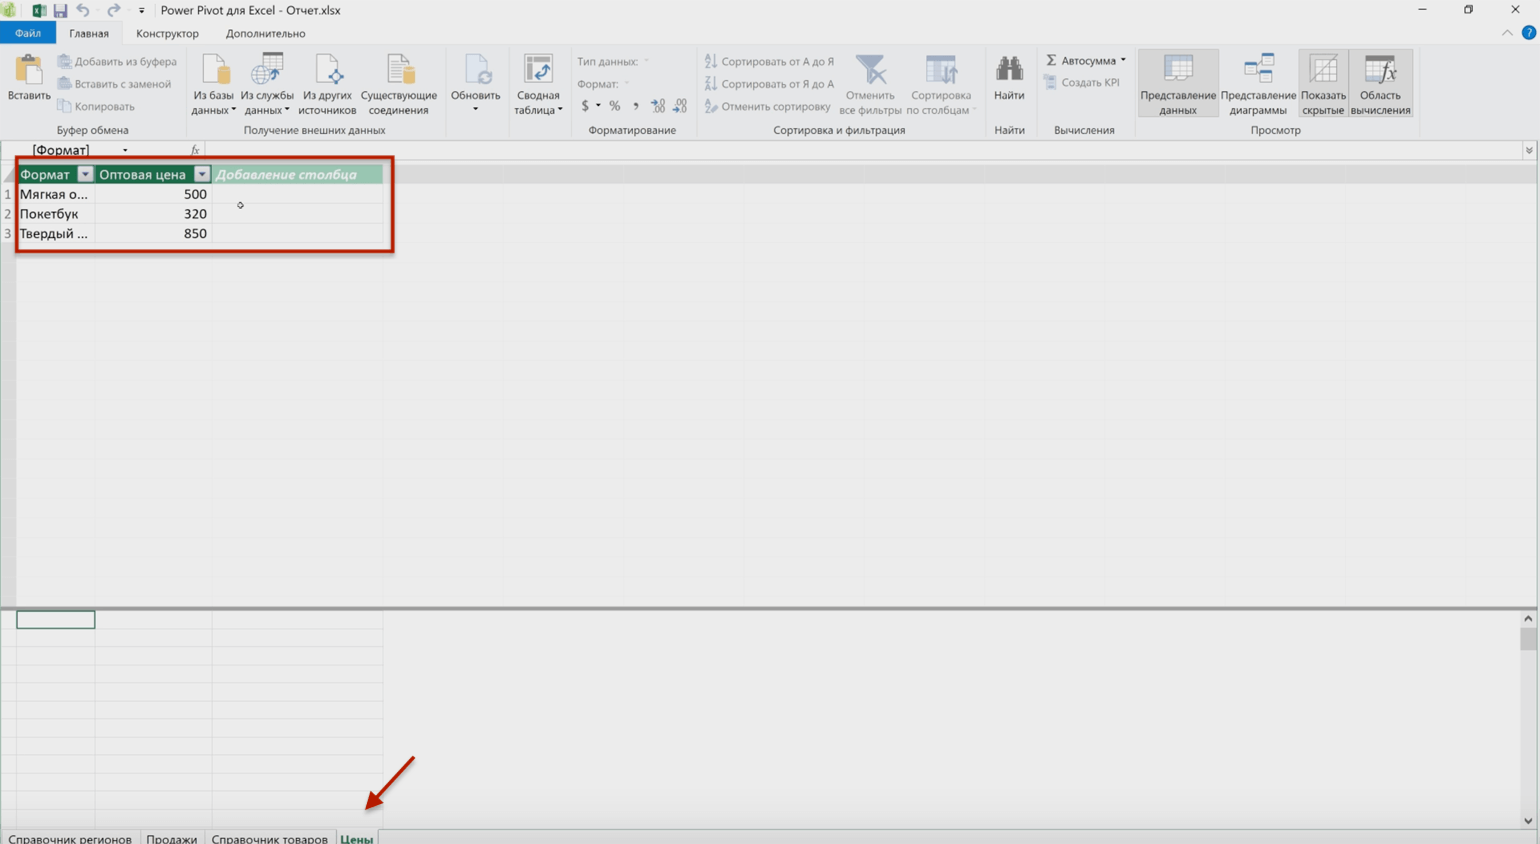
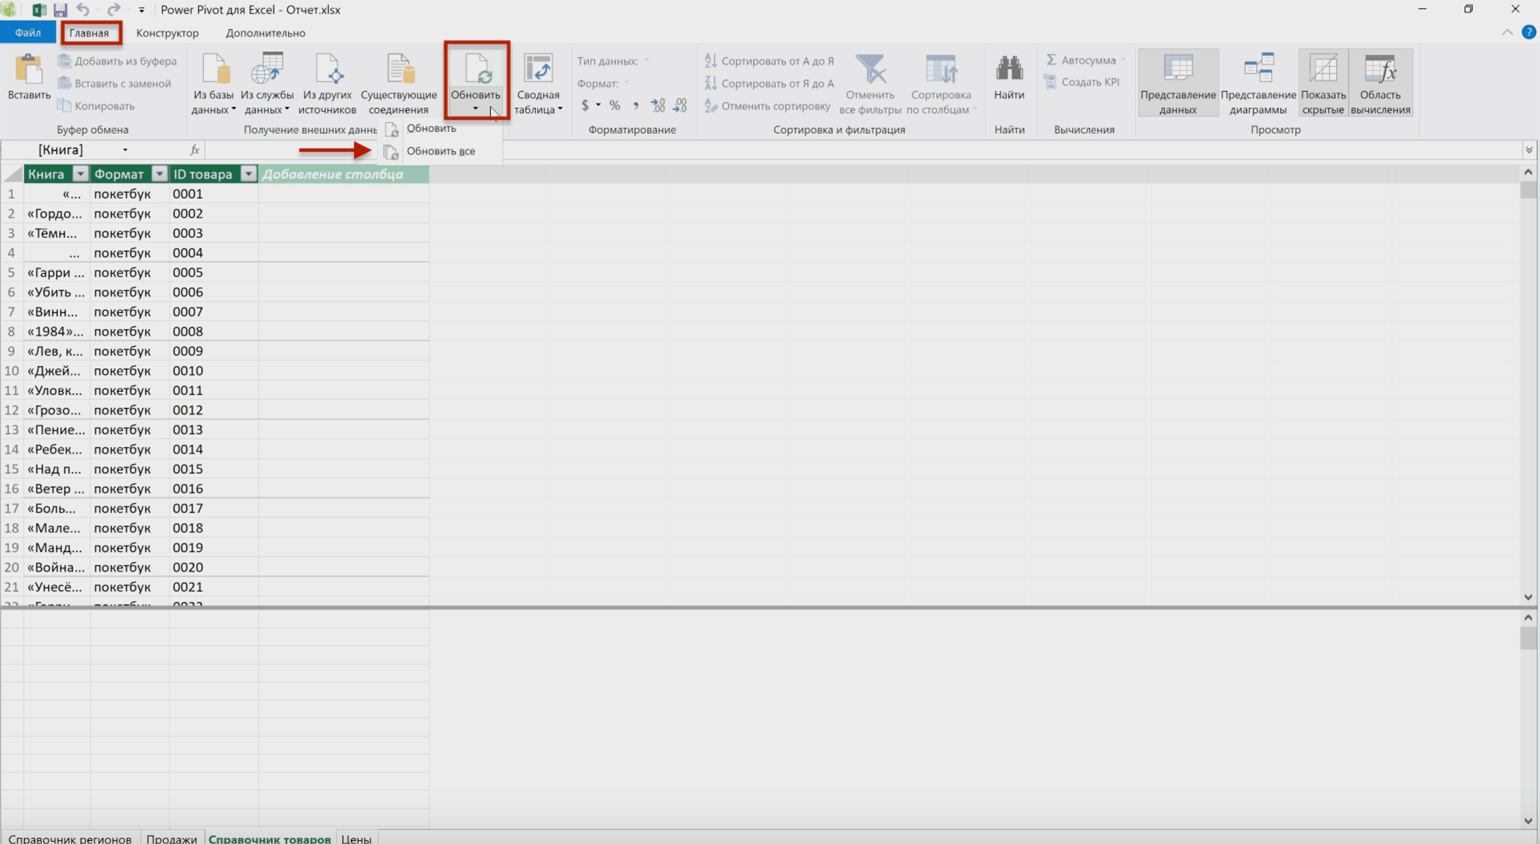
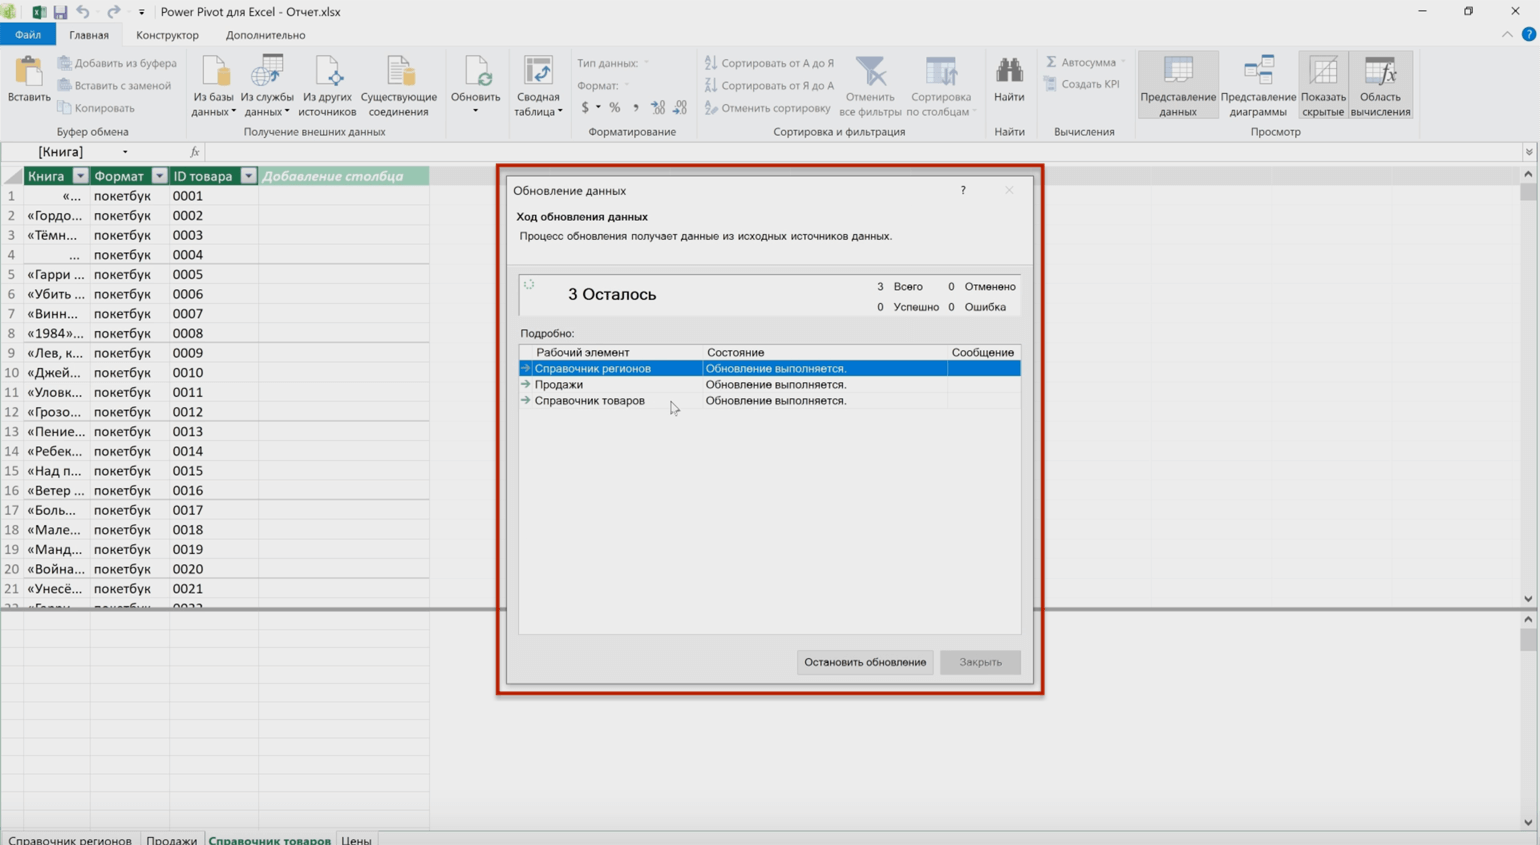
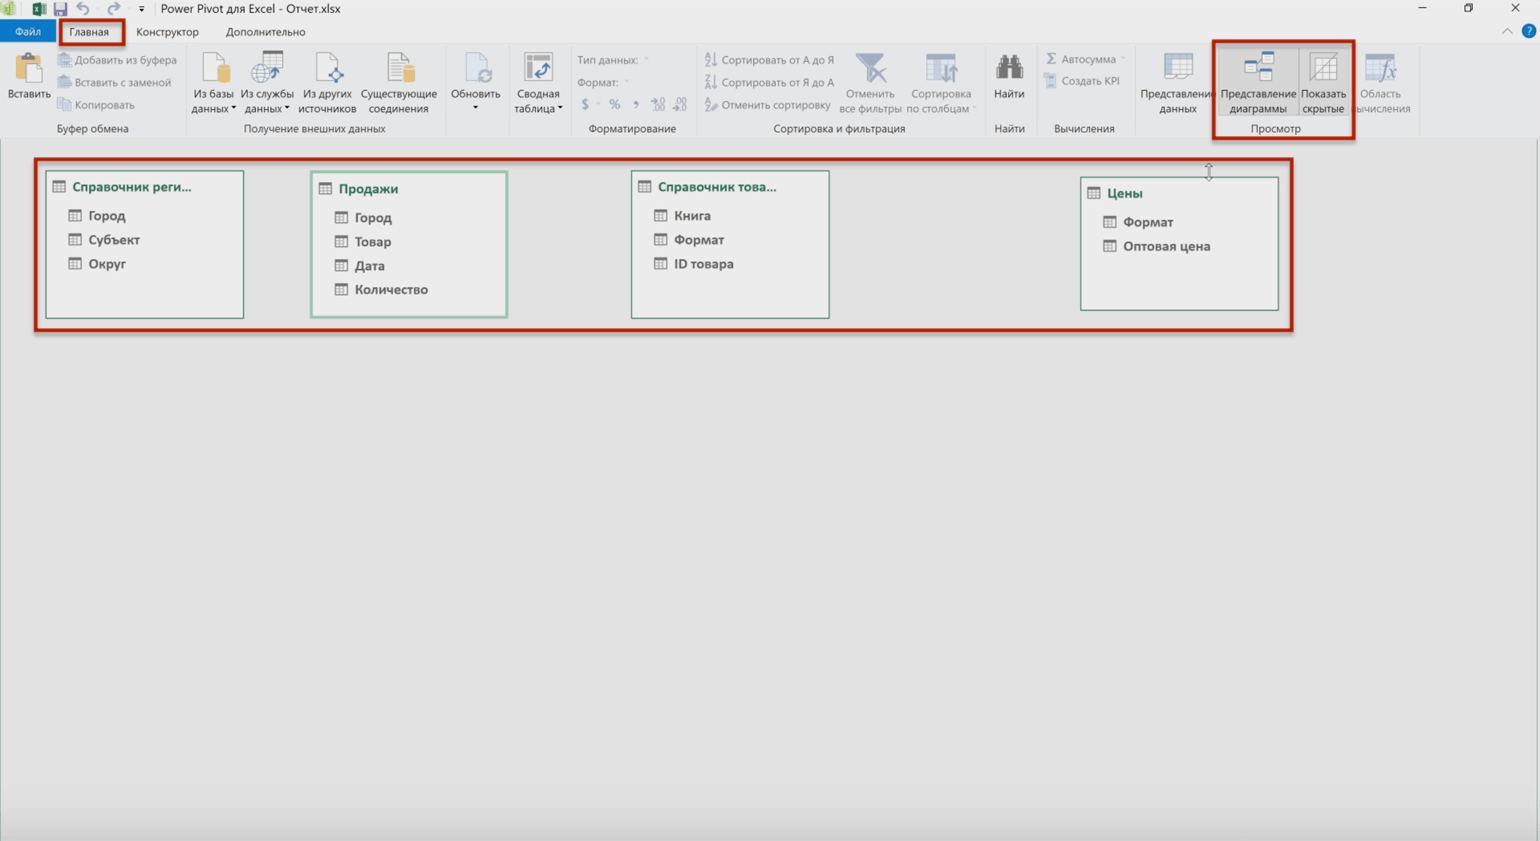
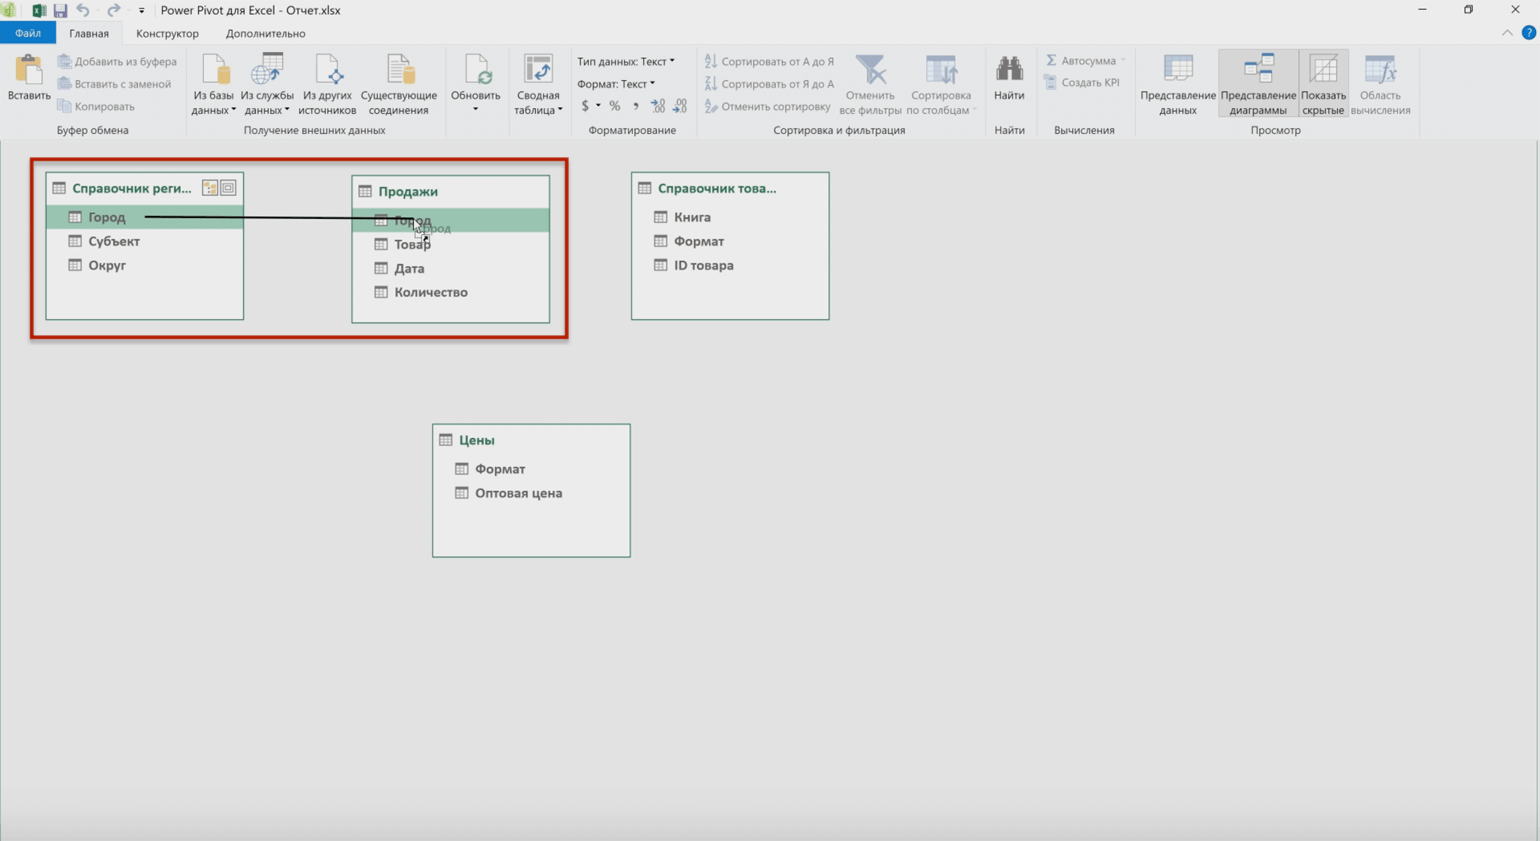
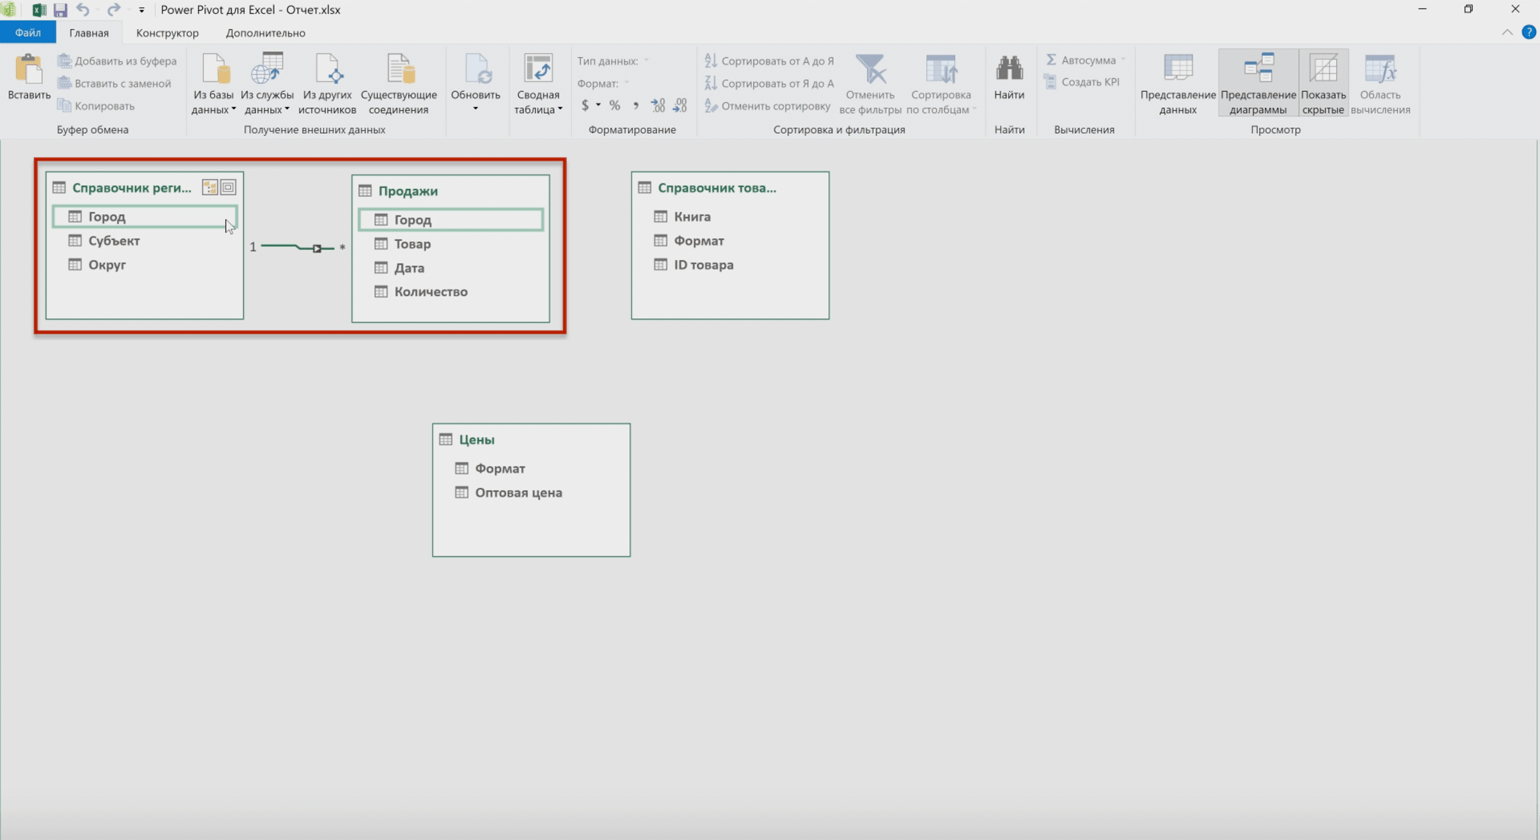
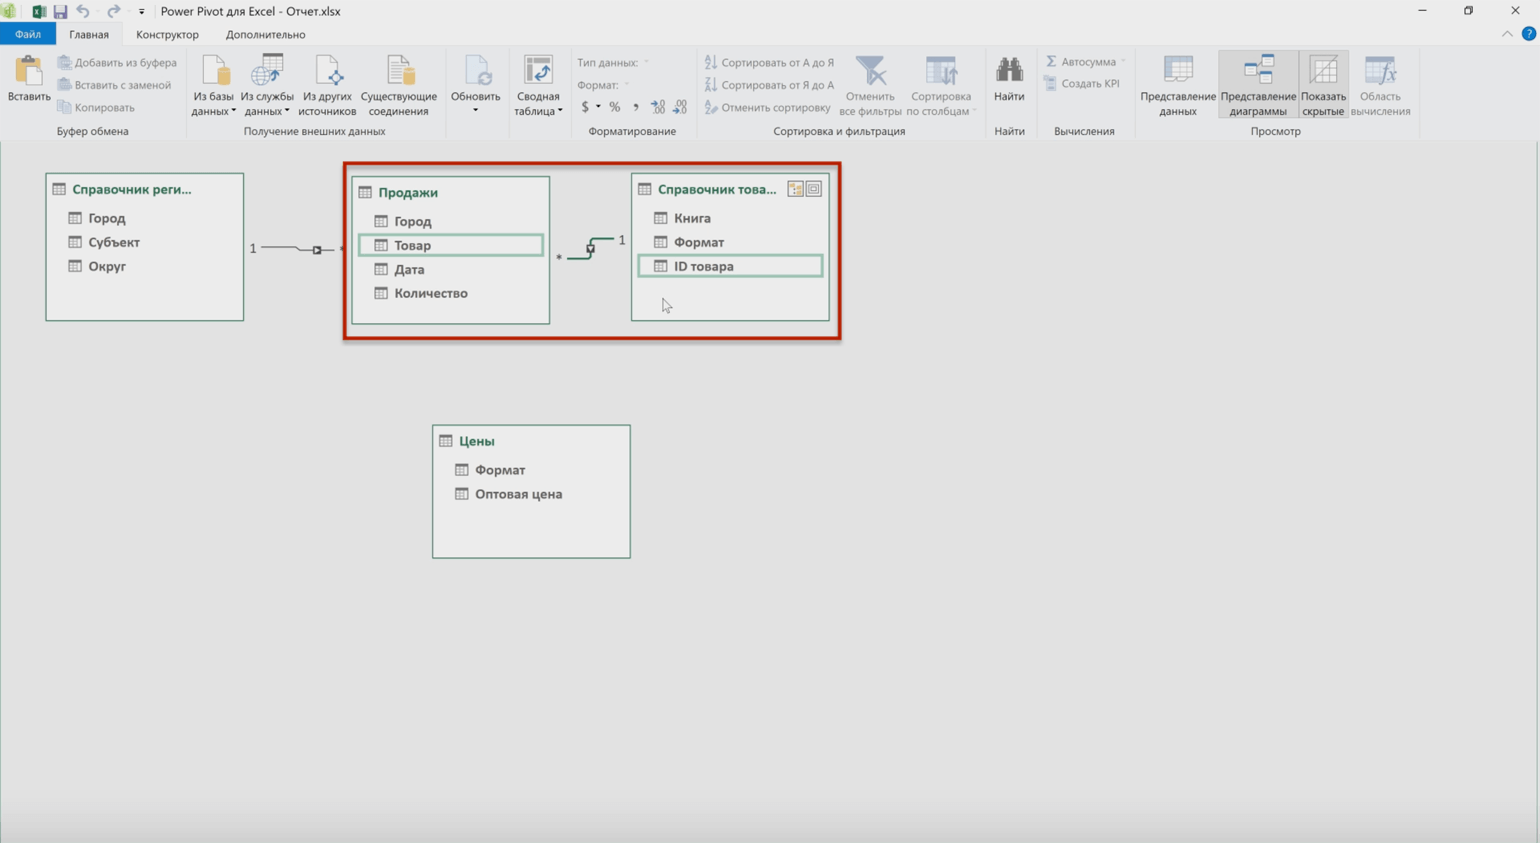
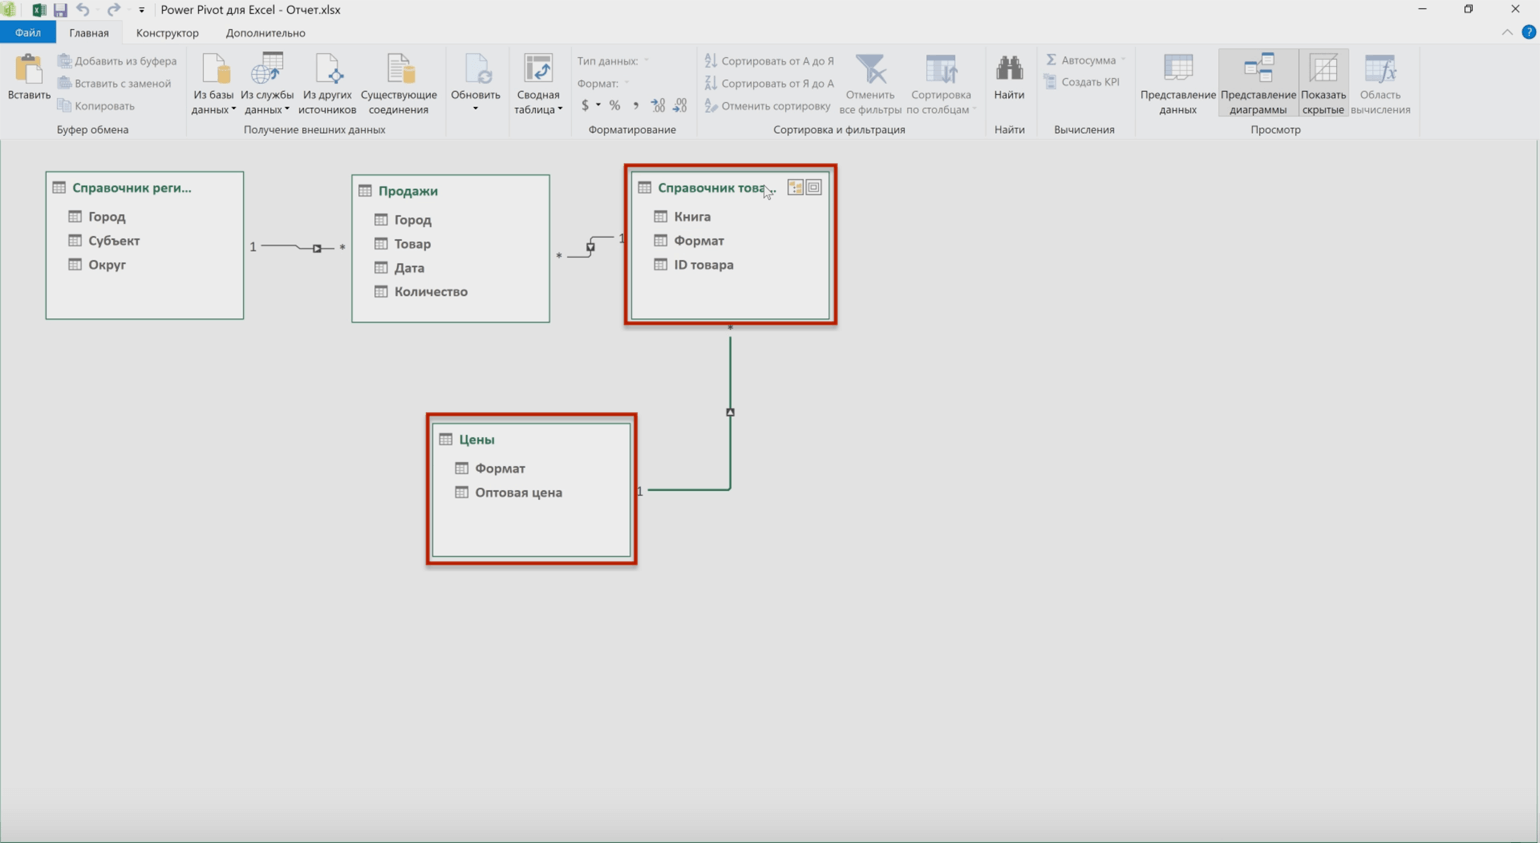
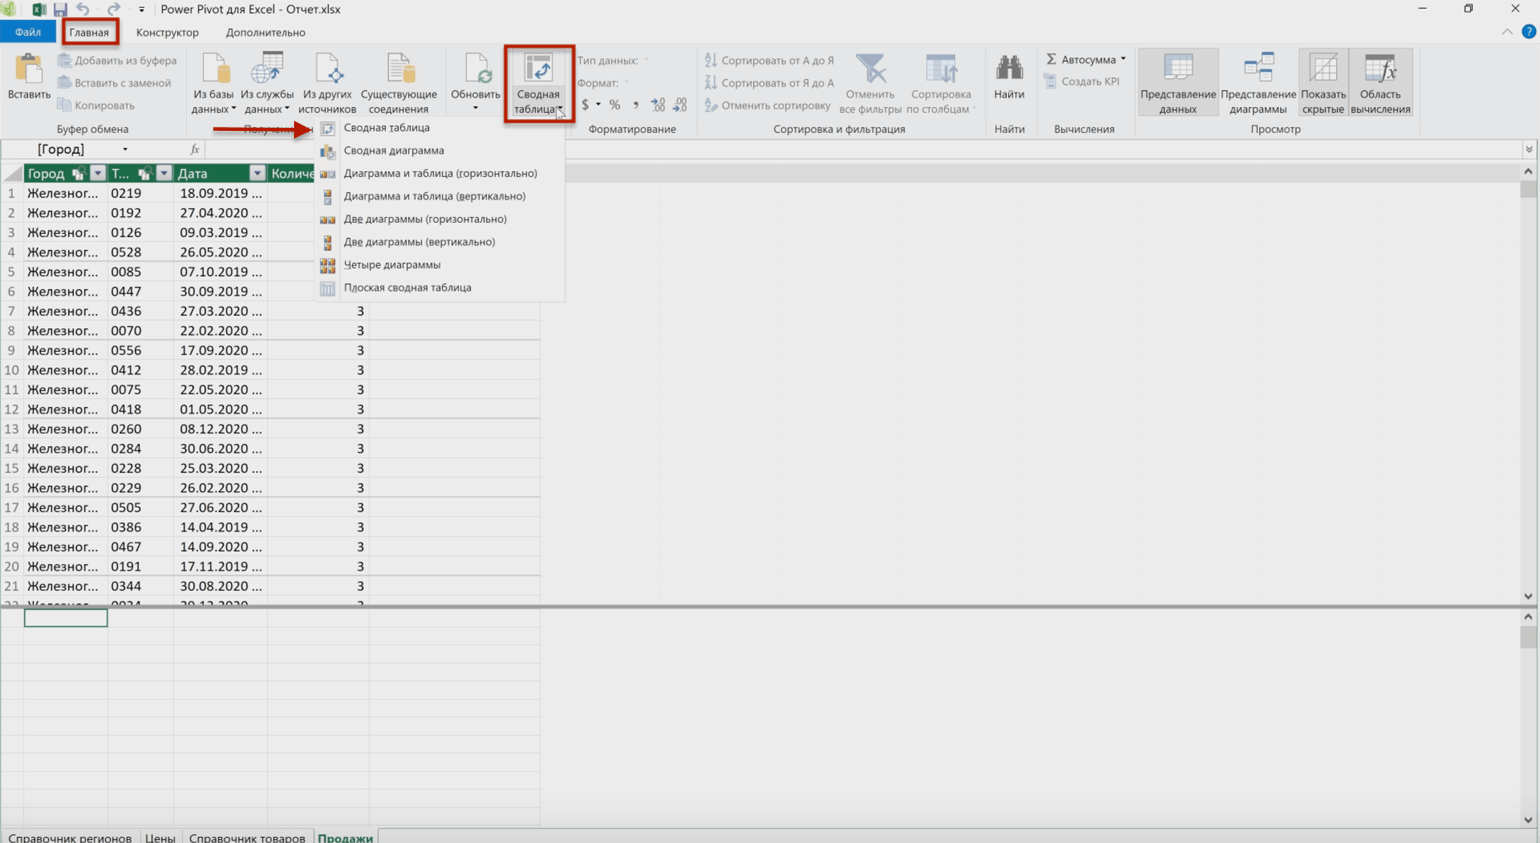
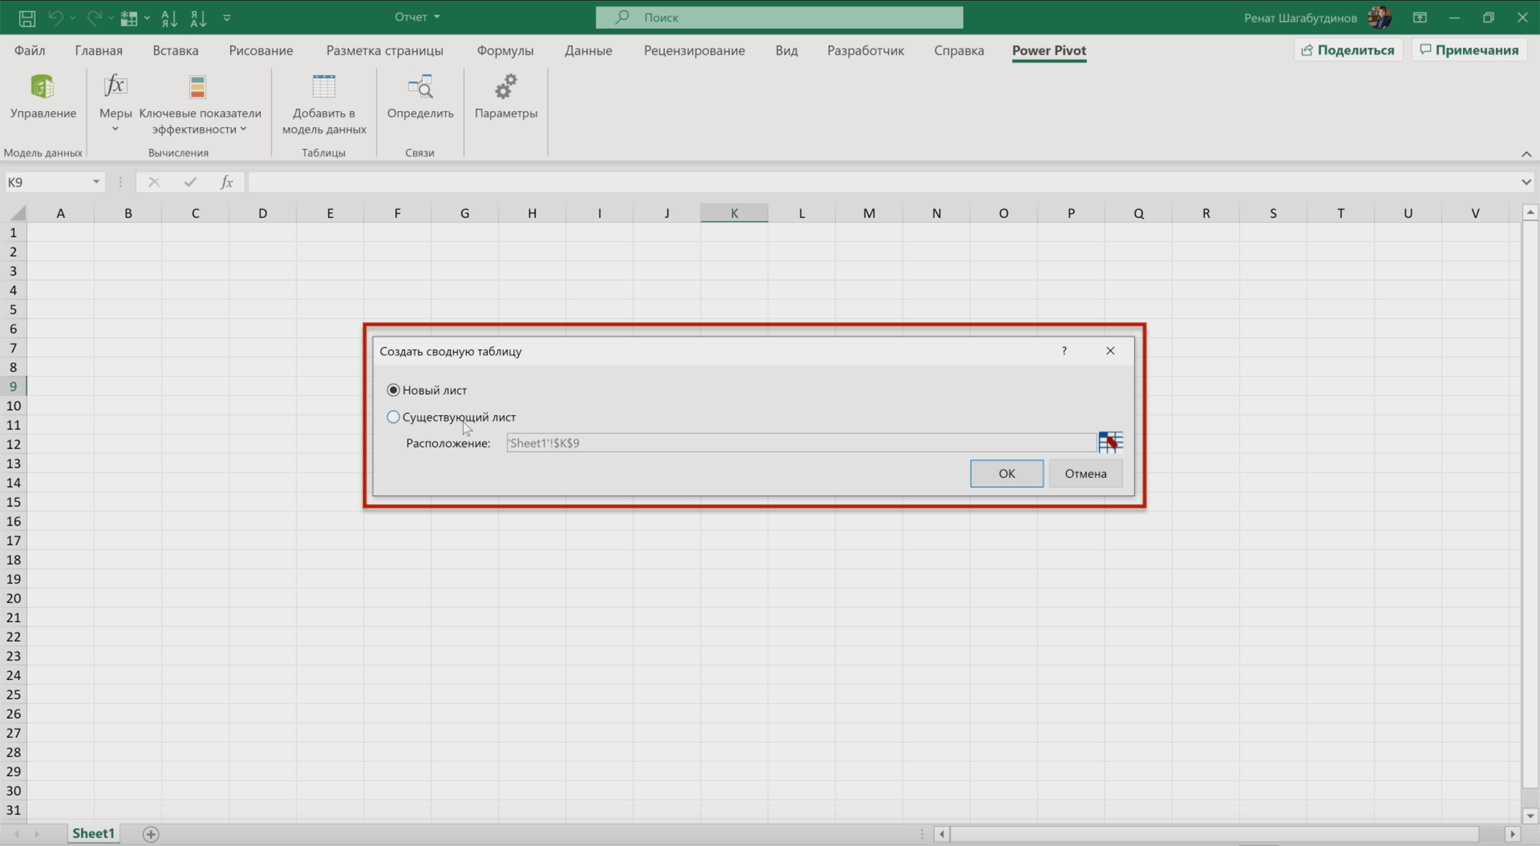
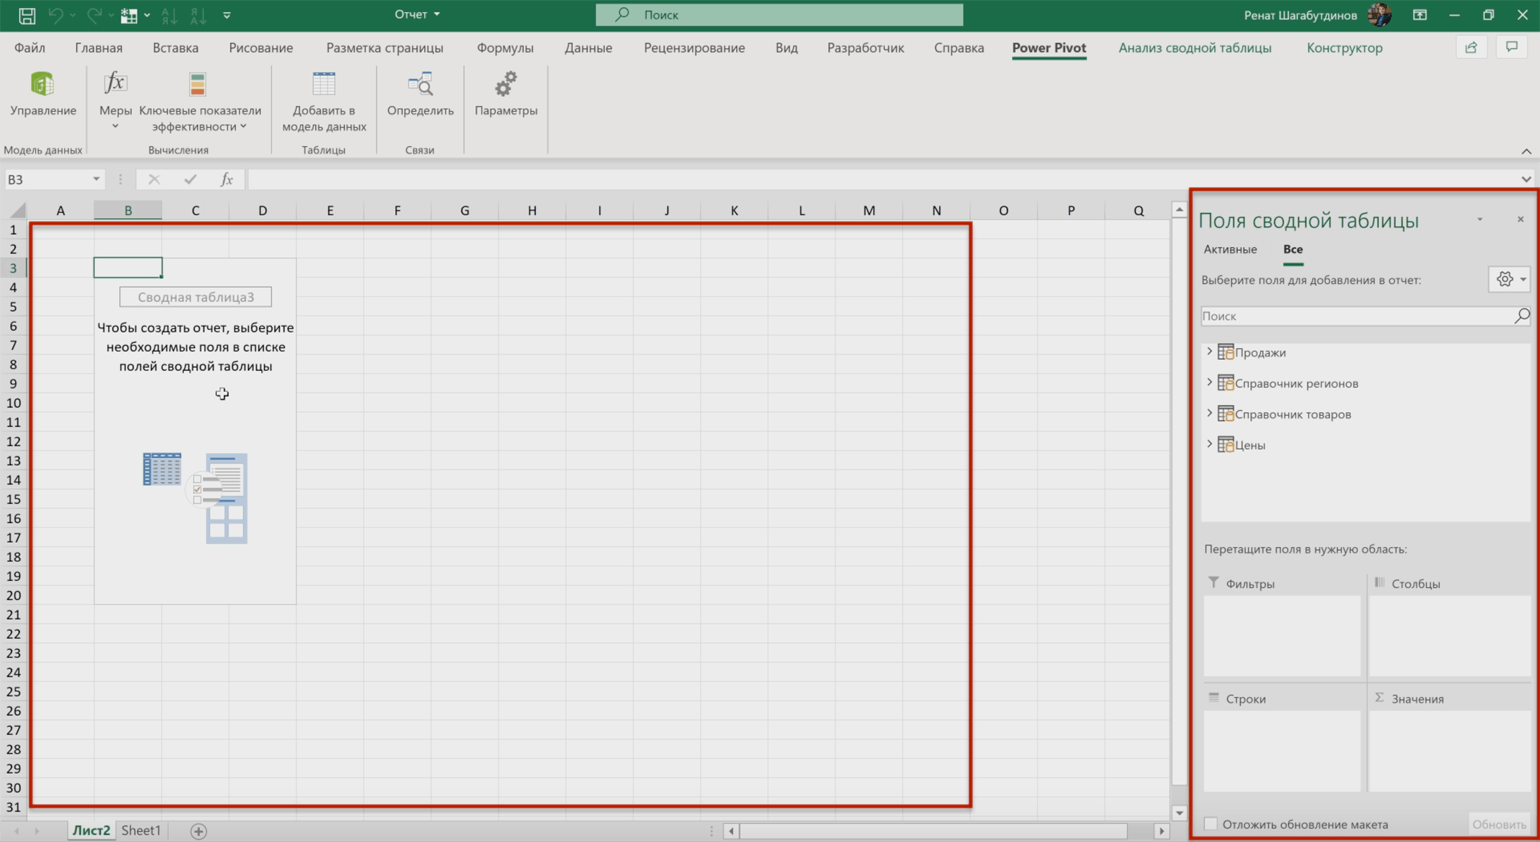
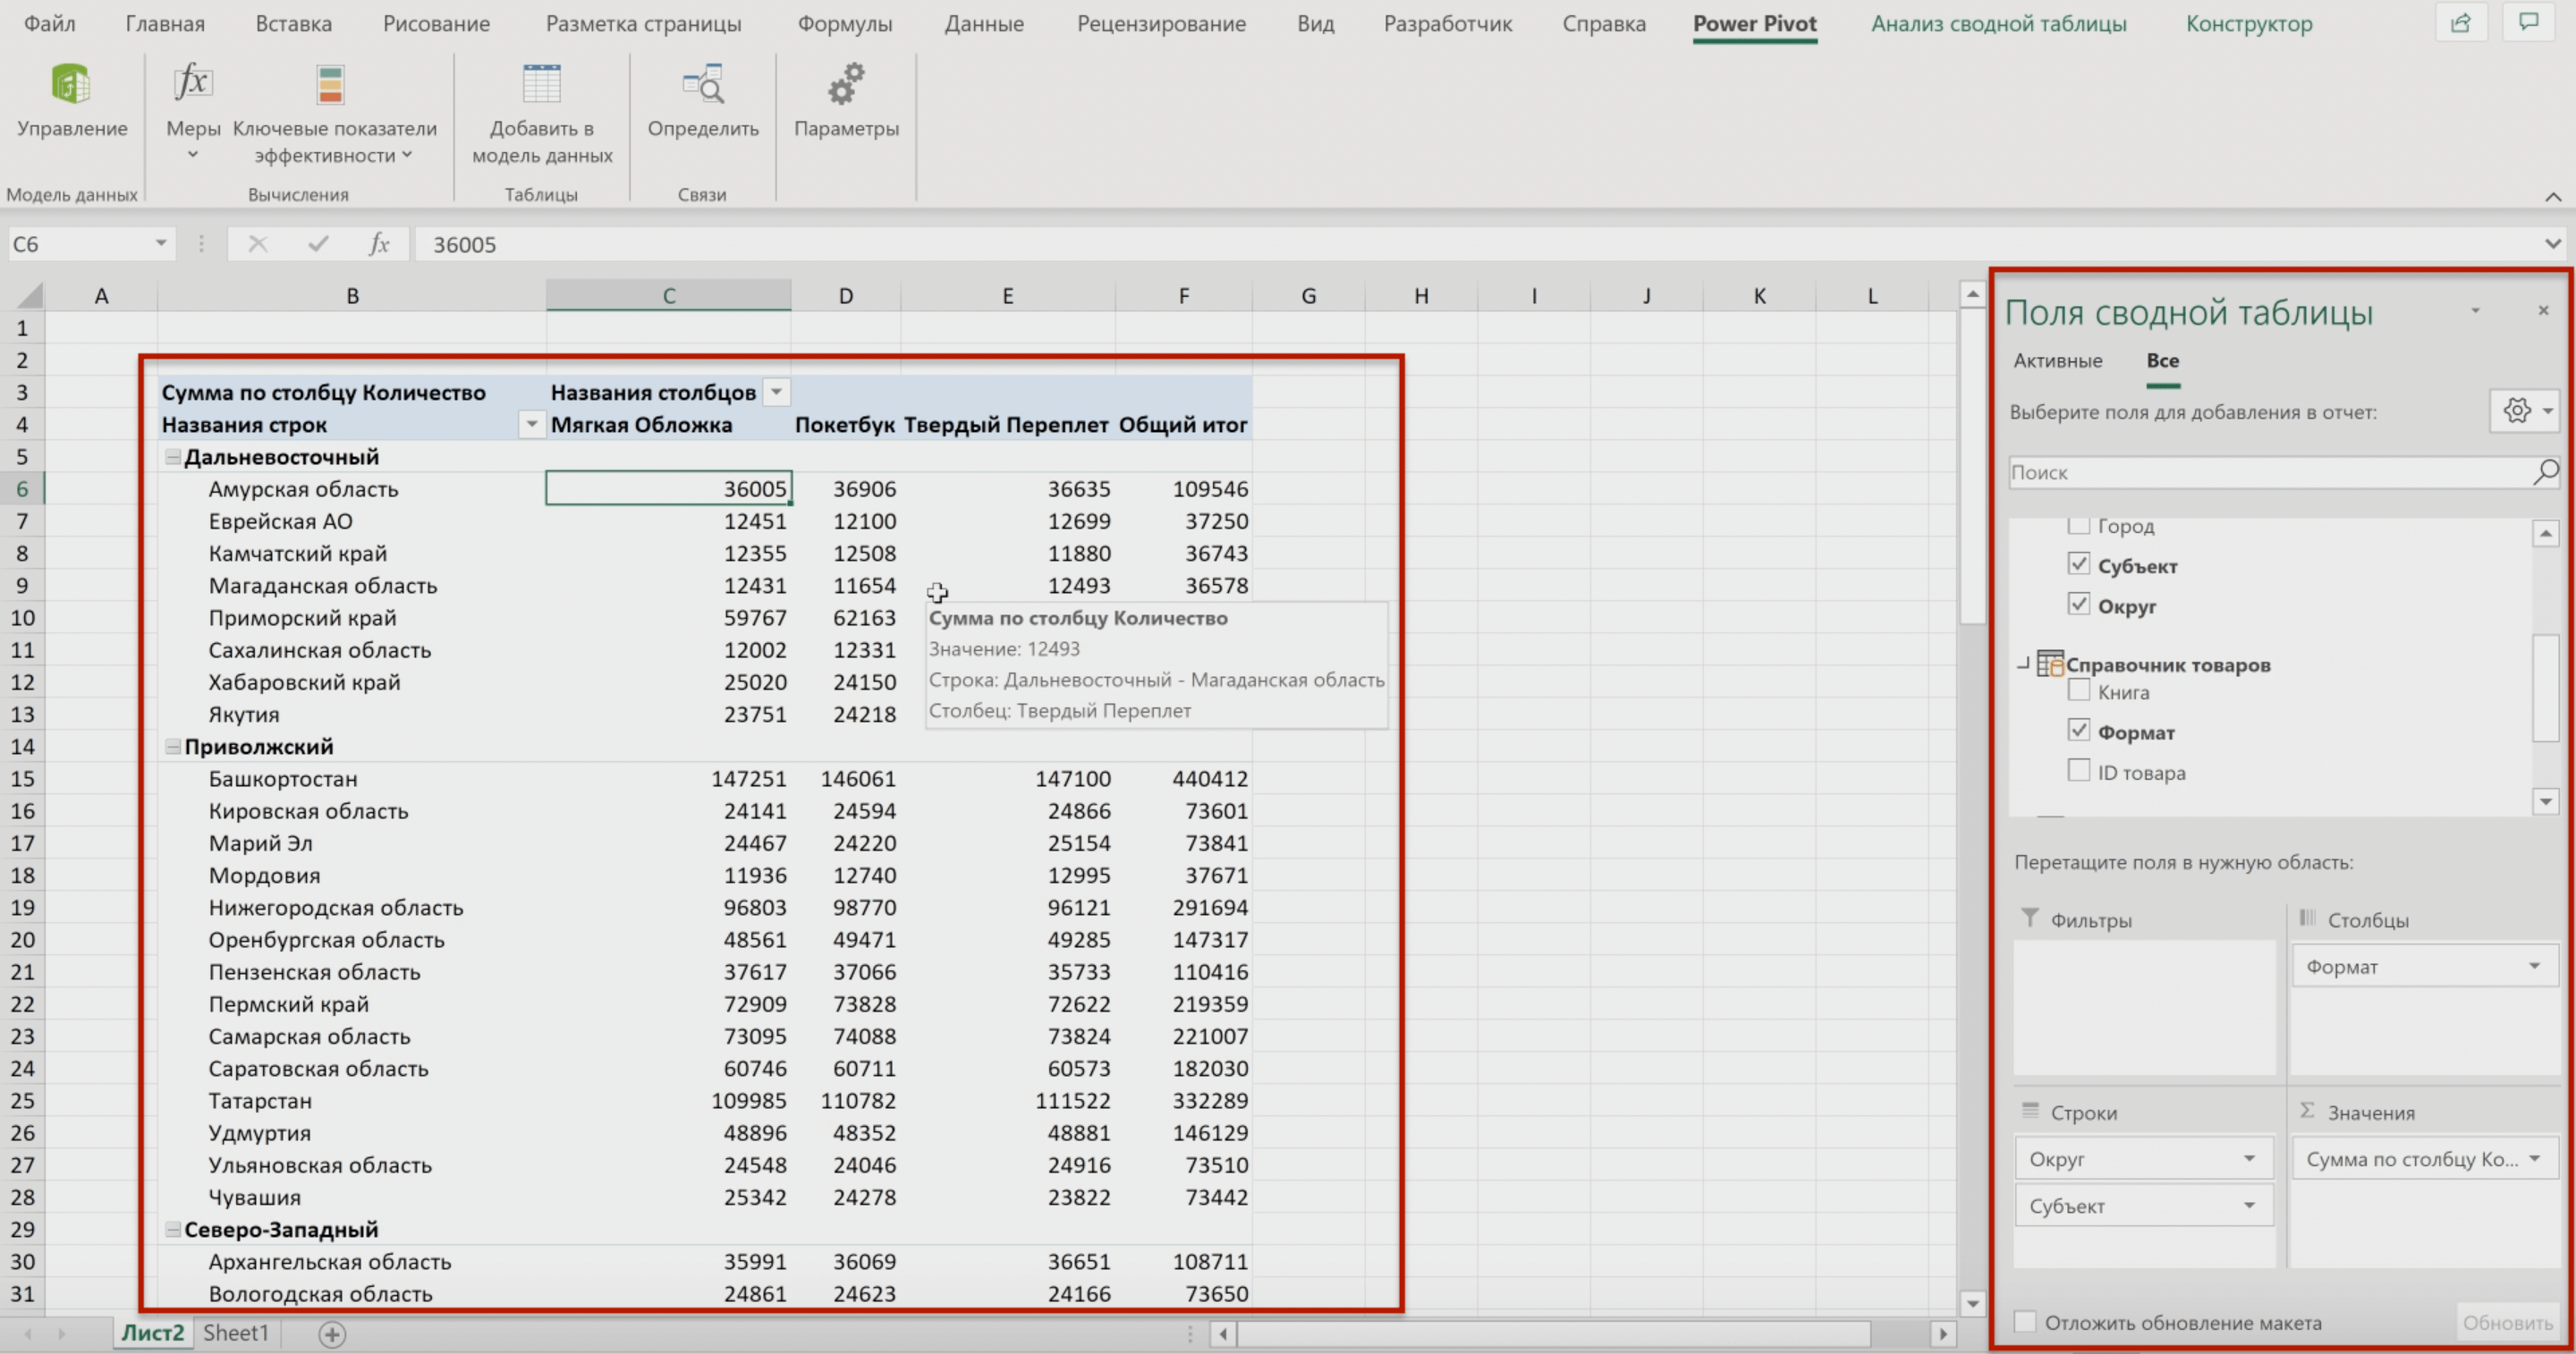

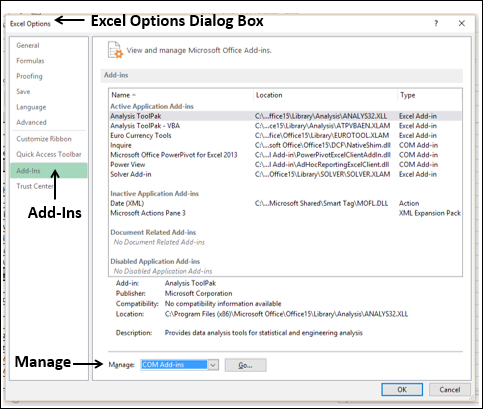


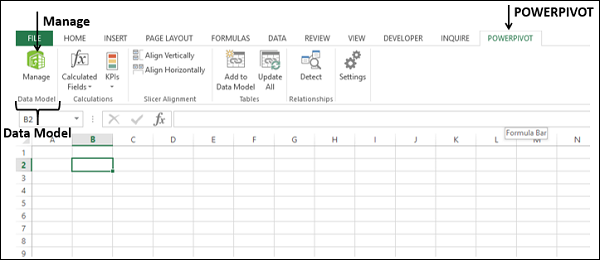

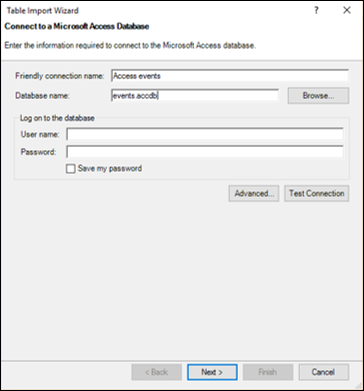
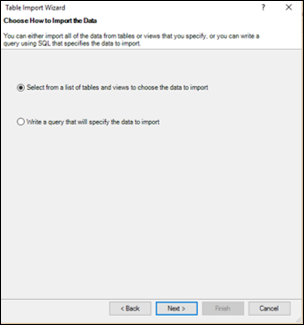
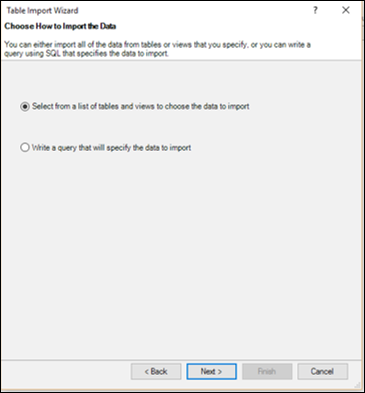
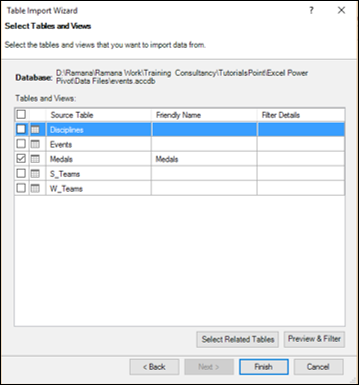

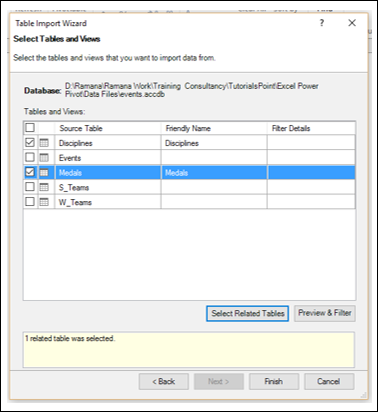
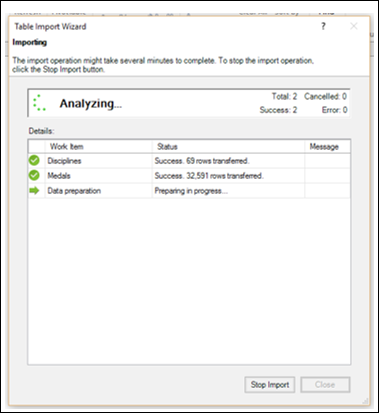
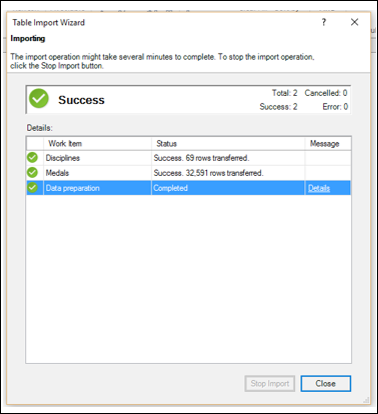
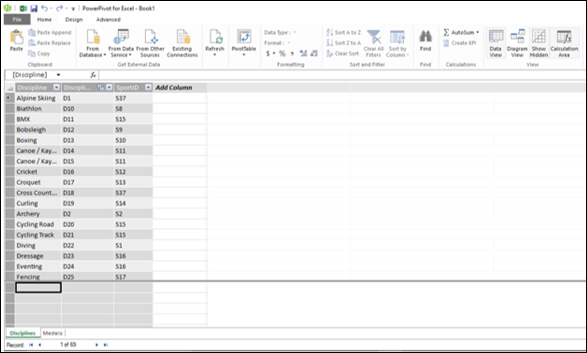

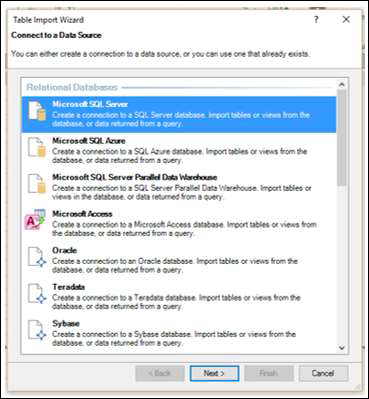
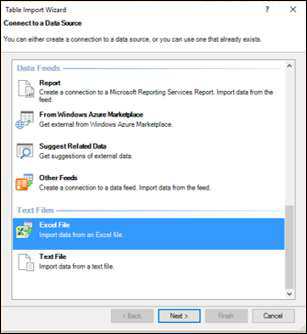
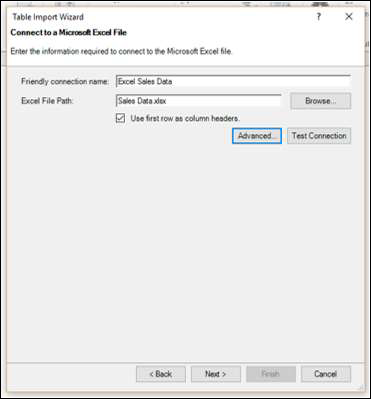
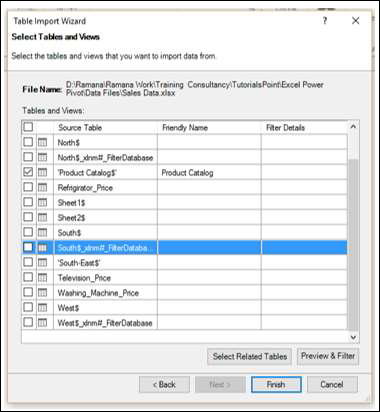
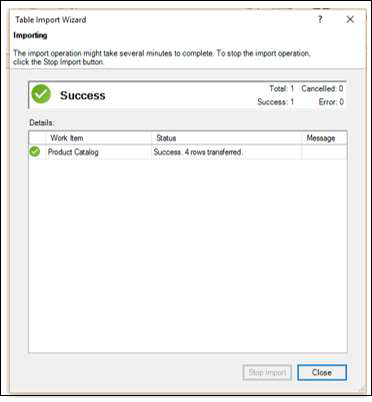

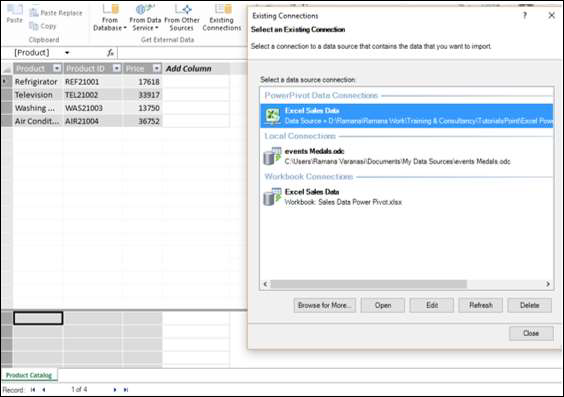
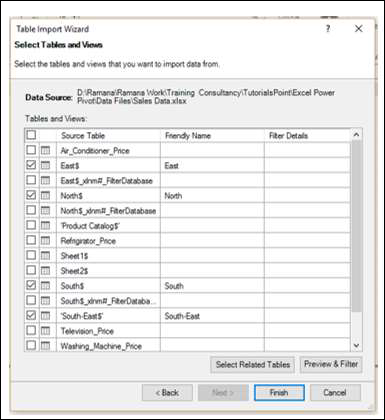
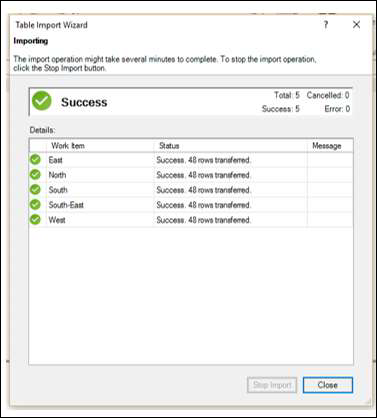
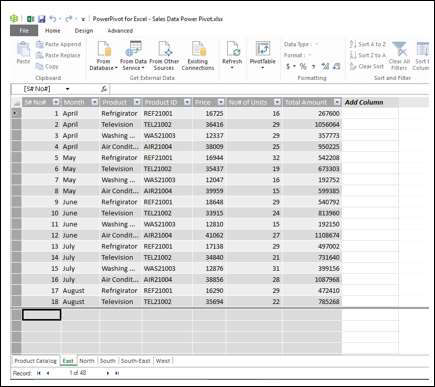
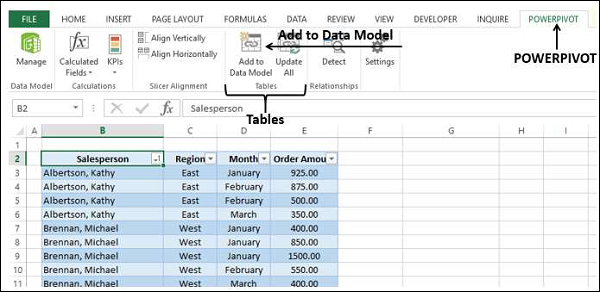
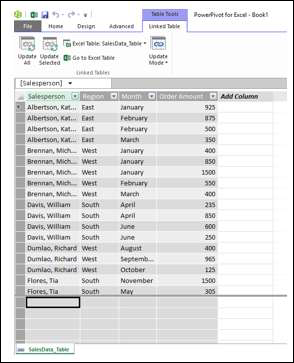

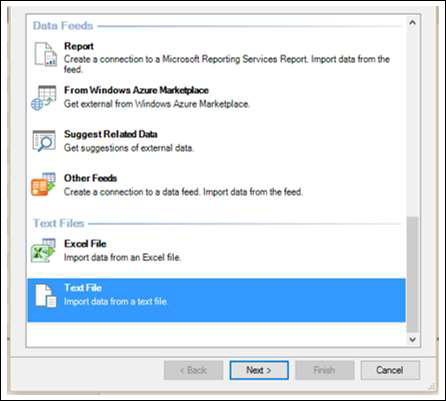
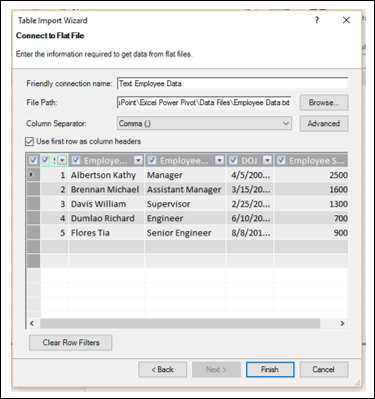
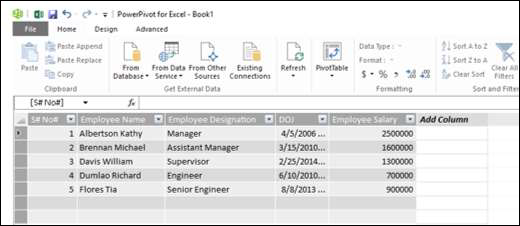
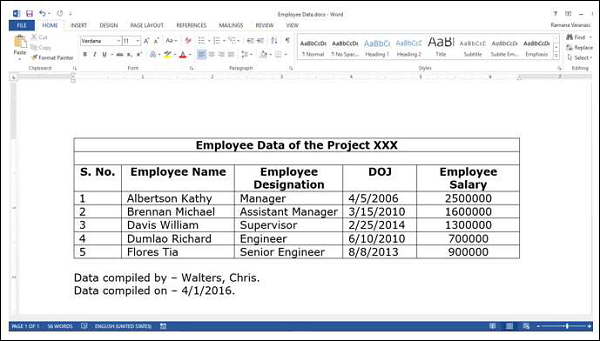
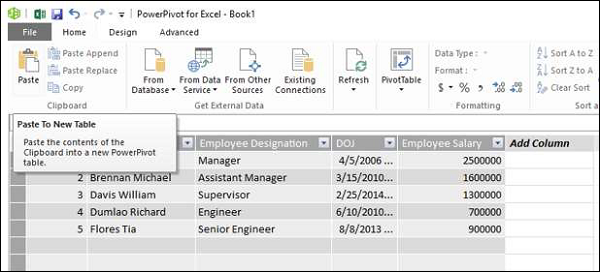
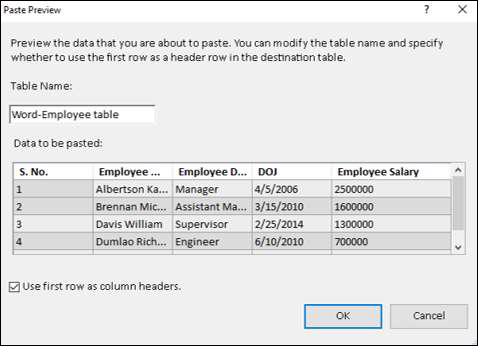
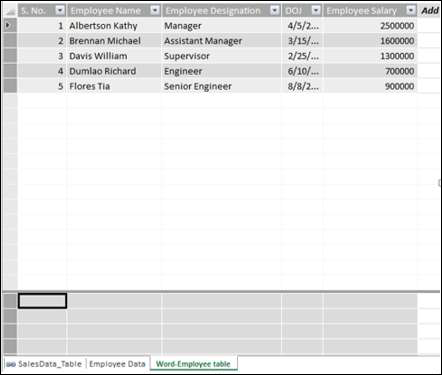
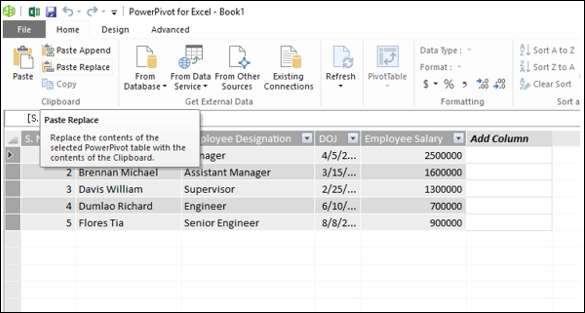
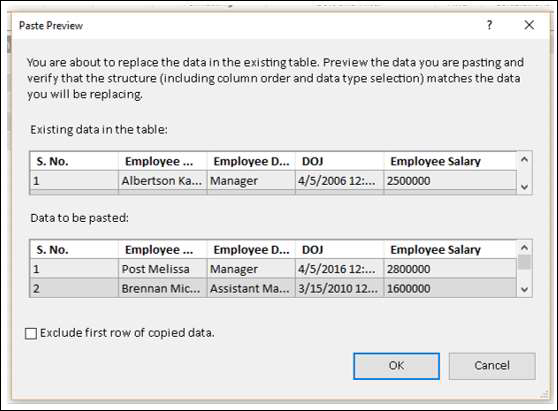
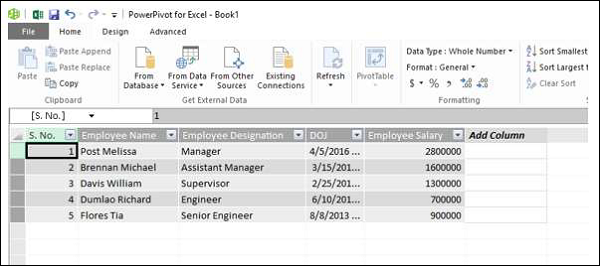
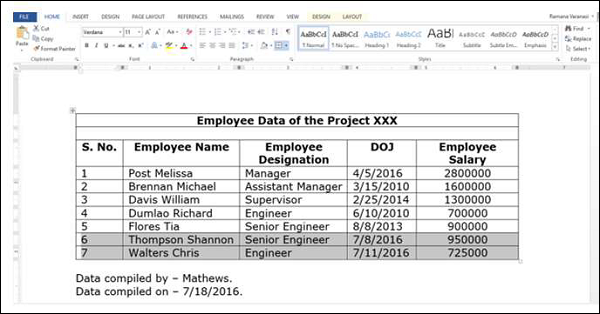
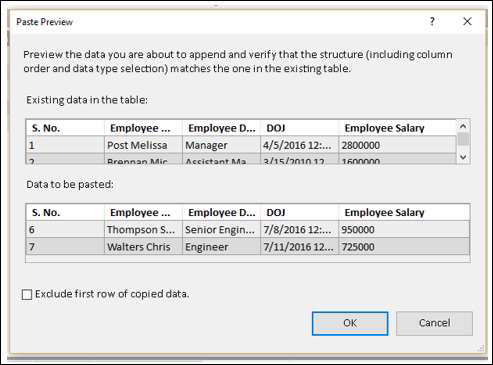
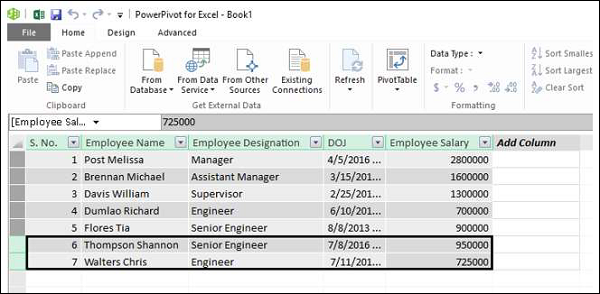
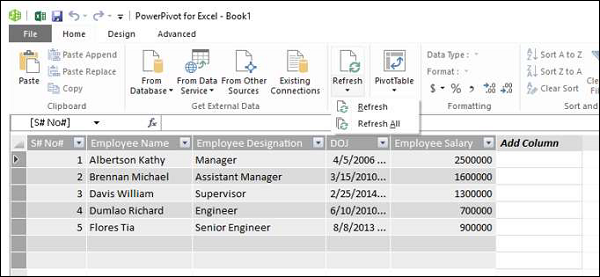
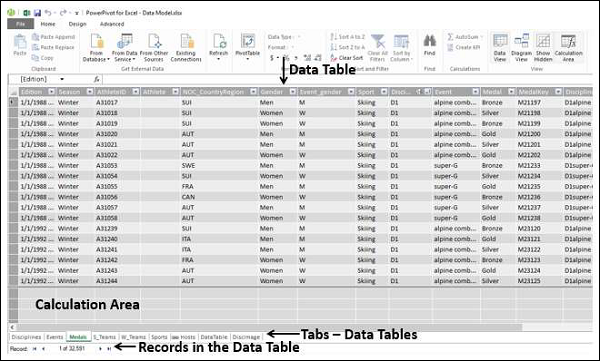
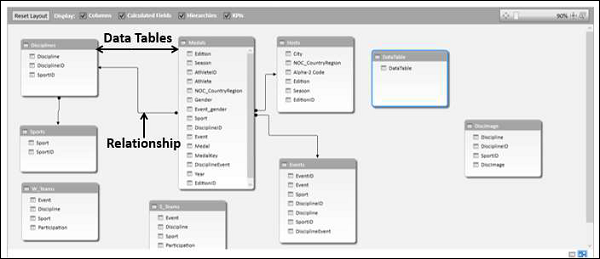
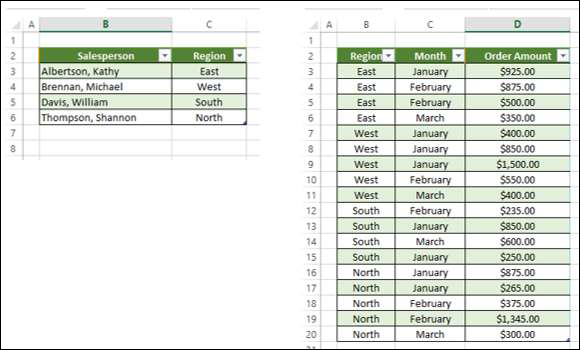
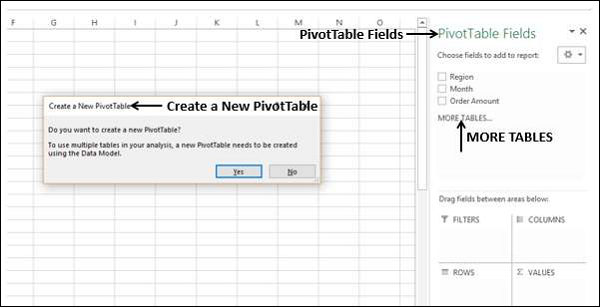
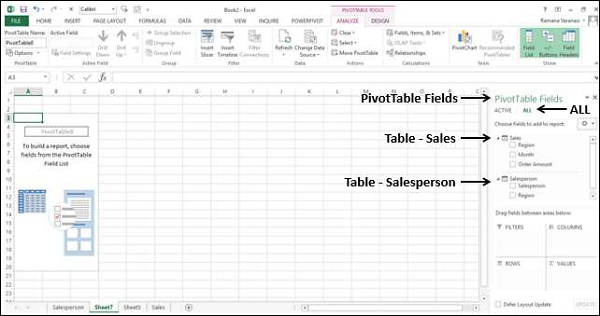
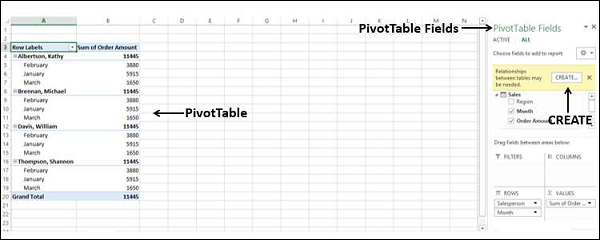
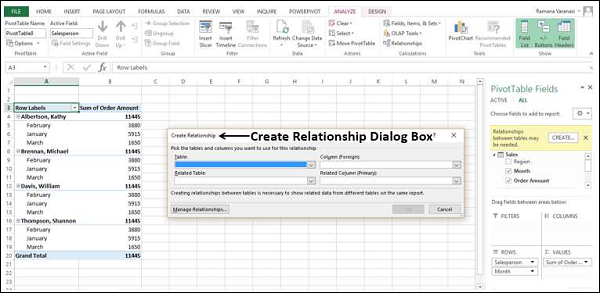

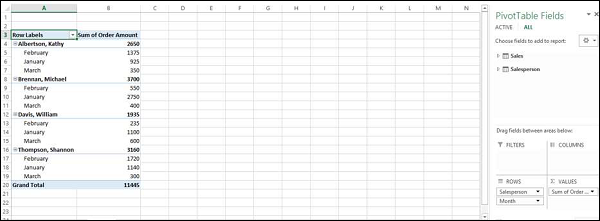
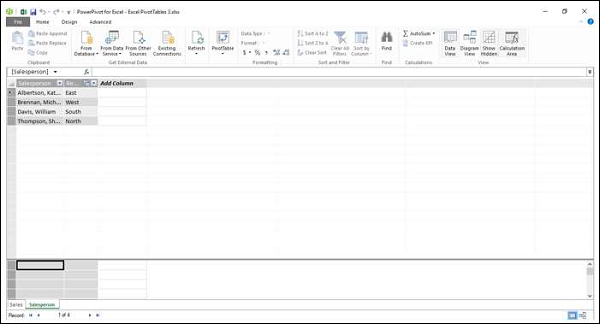
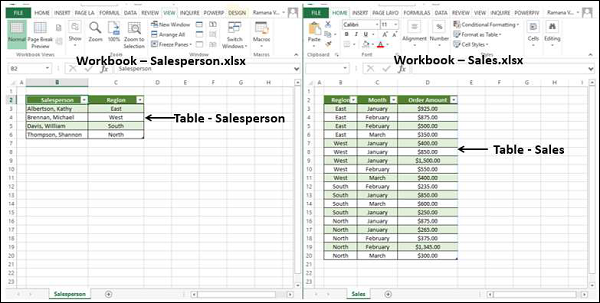
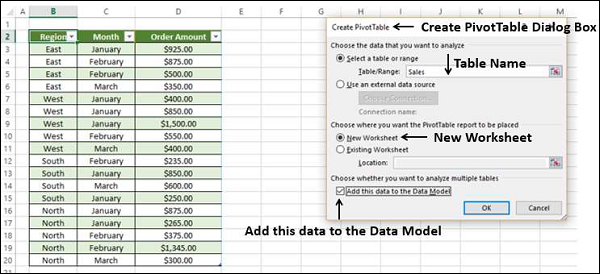
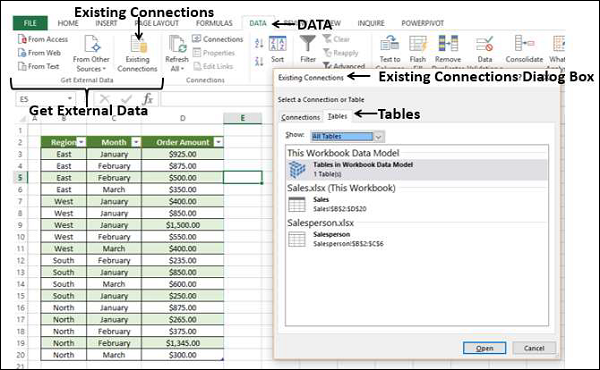
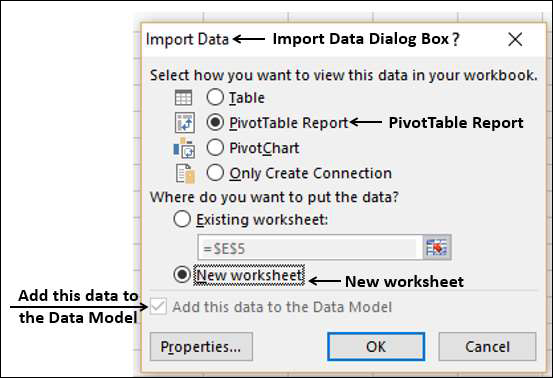
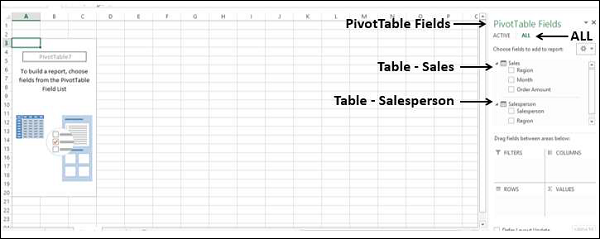
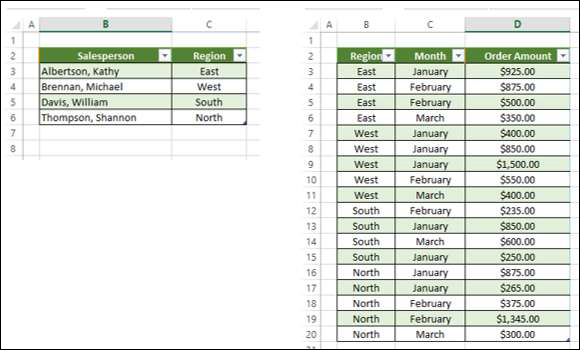
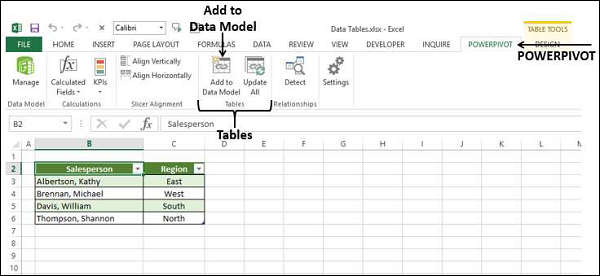
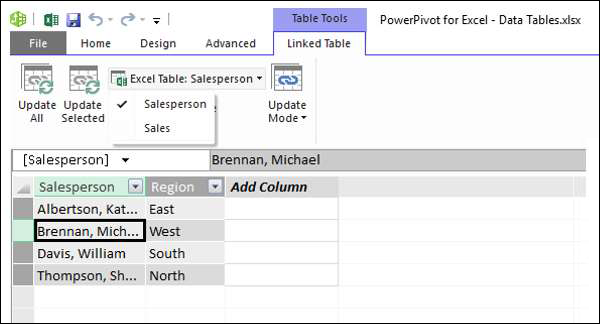
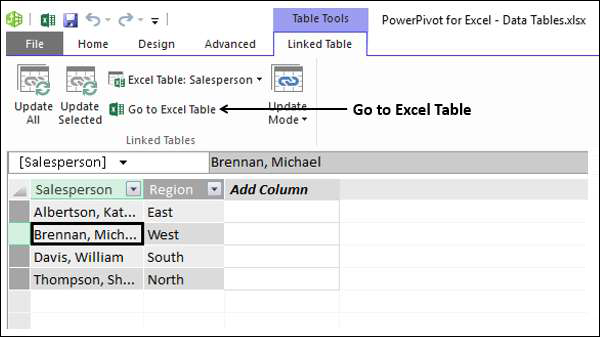
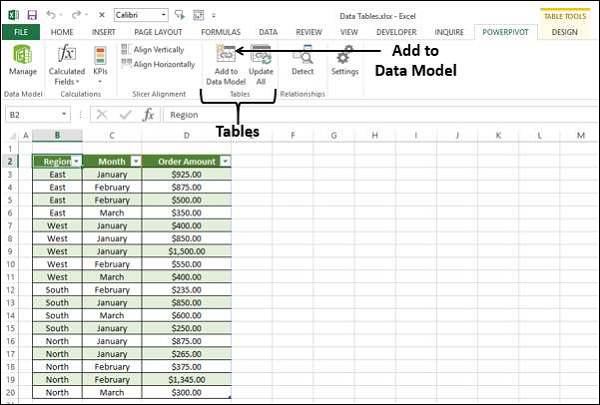
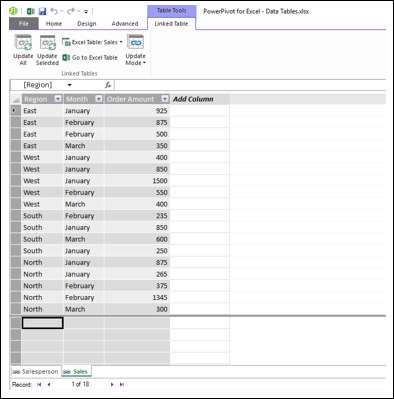
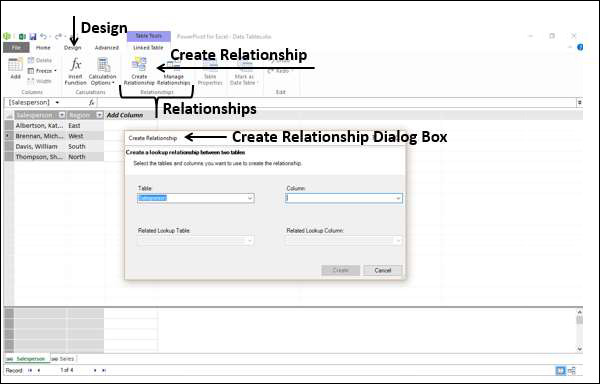
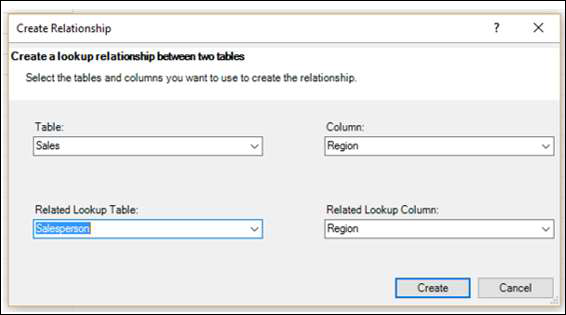
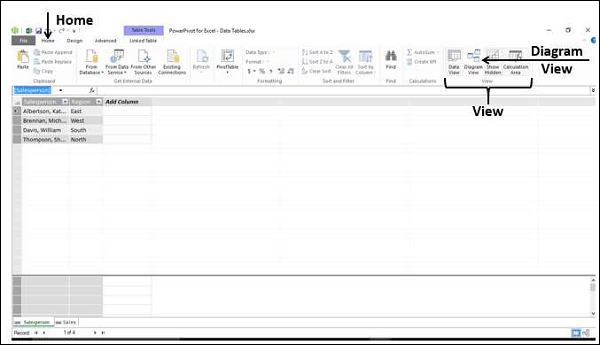
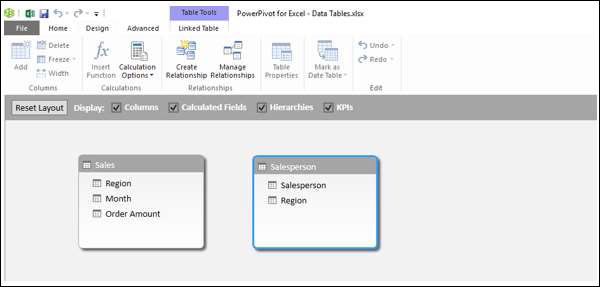
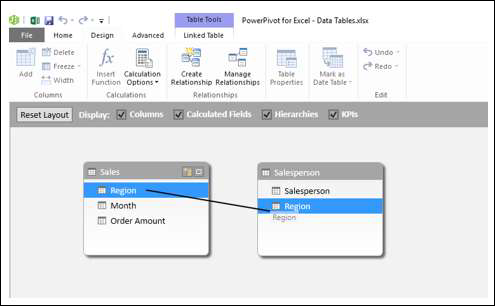
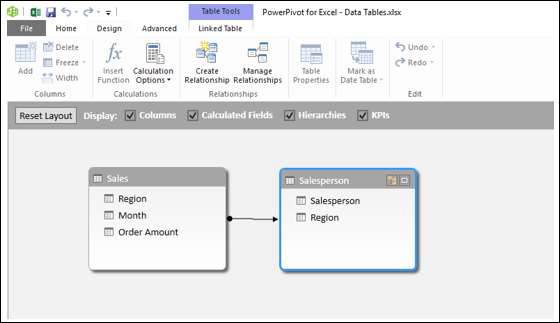
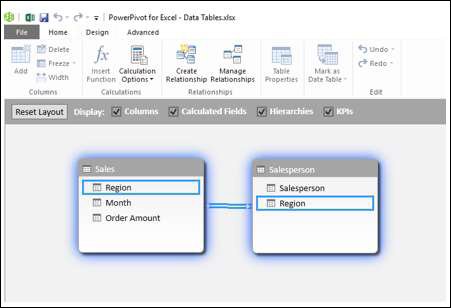
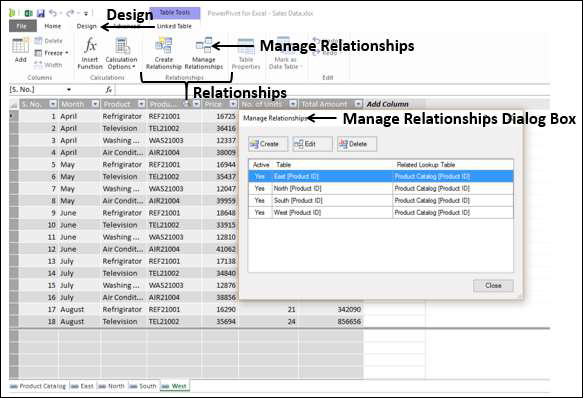
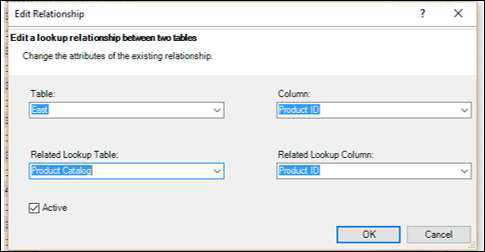
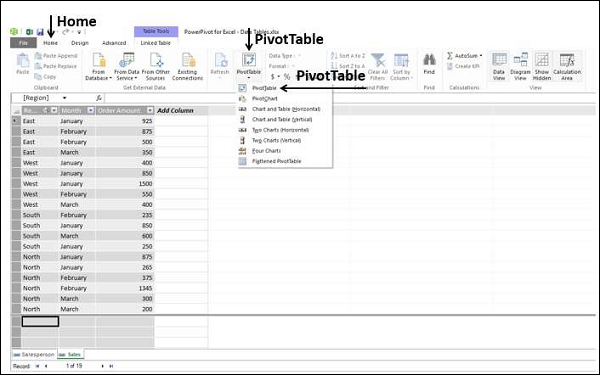
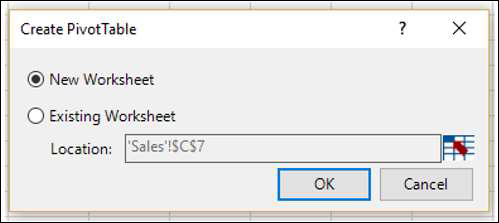
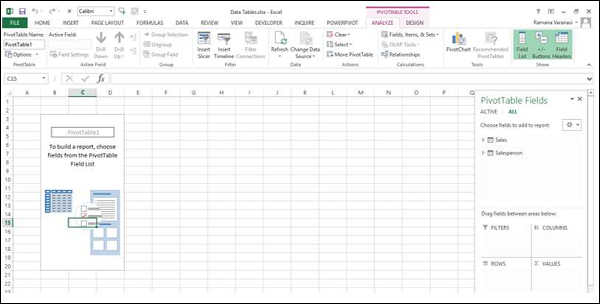
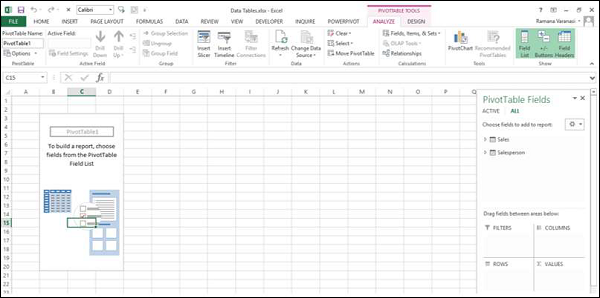
 on the left side.
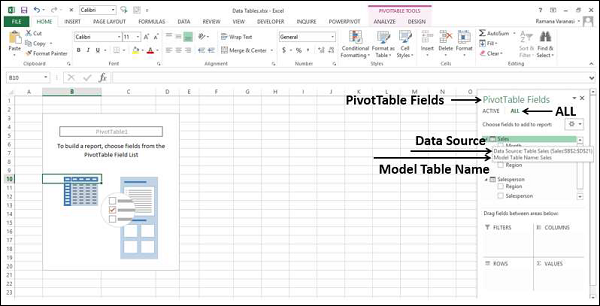
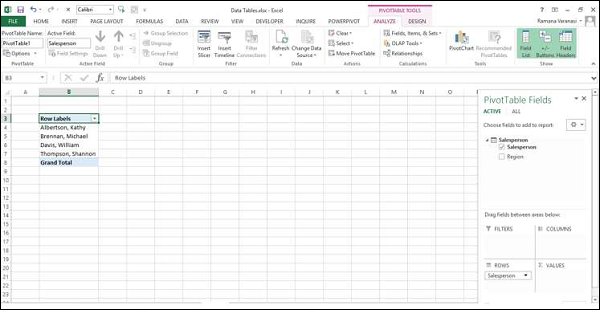
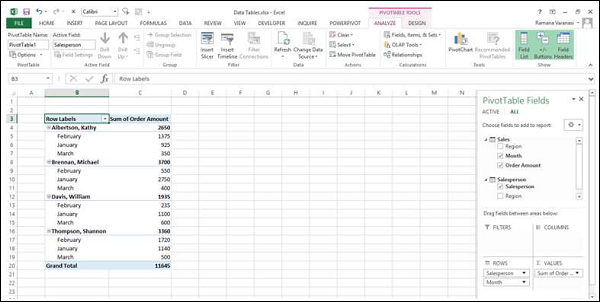
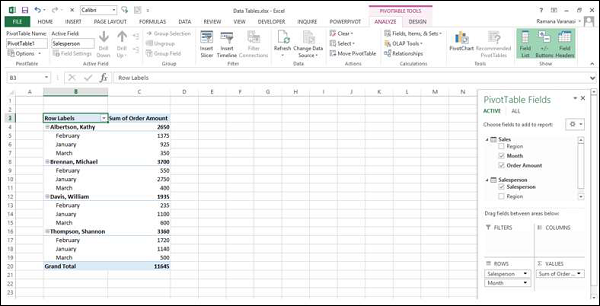
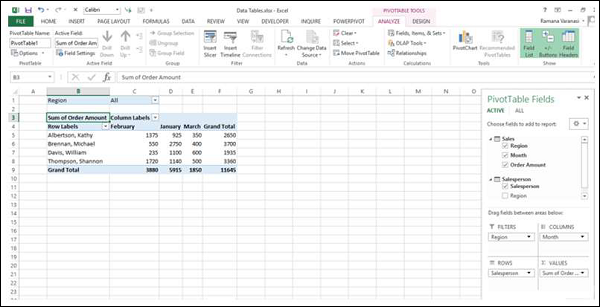
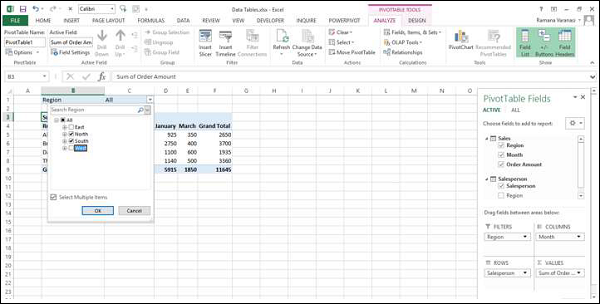
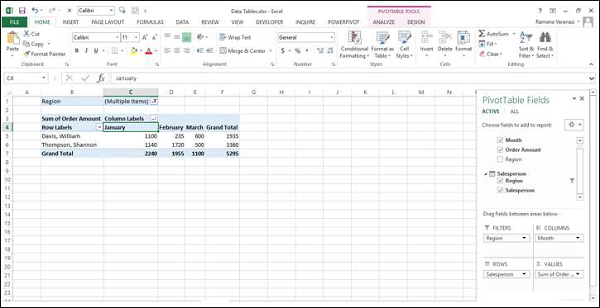
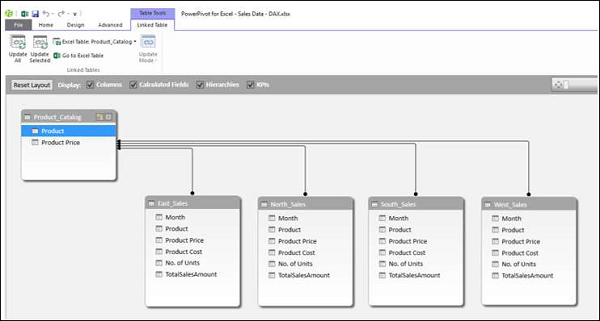

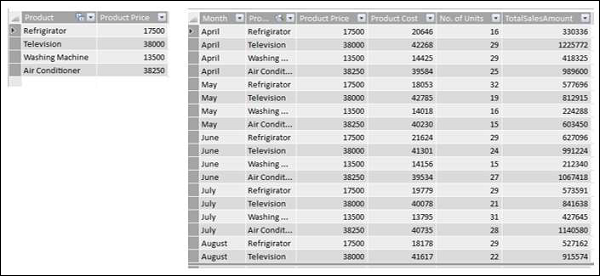
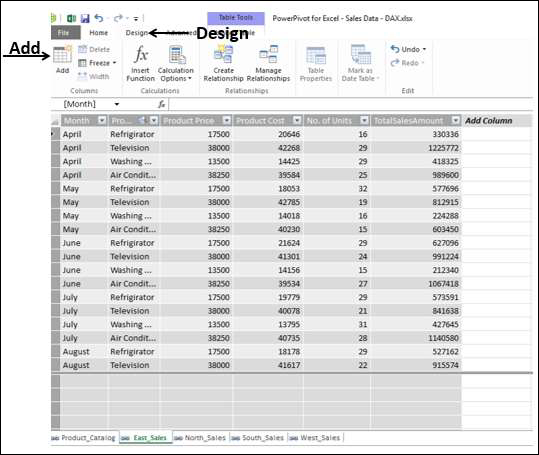
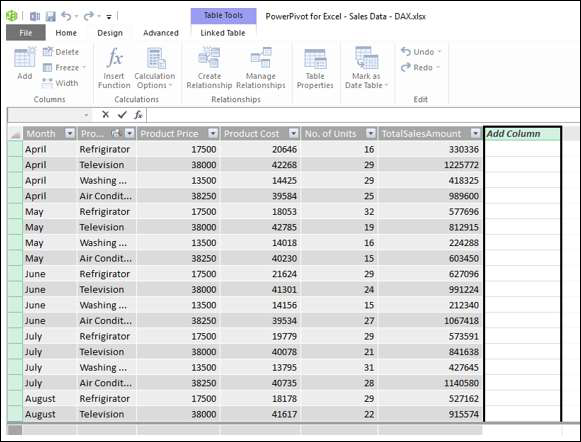
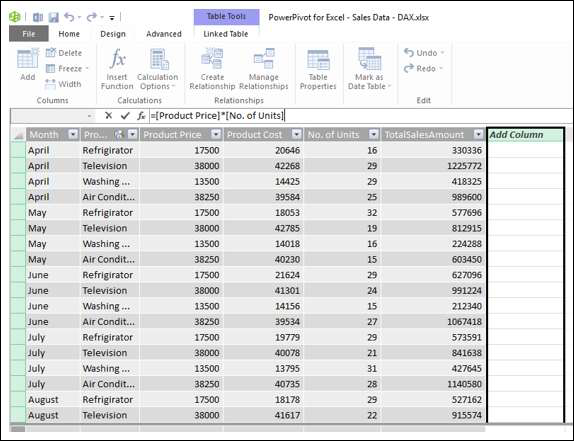
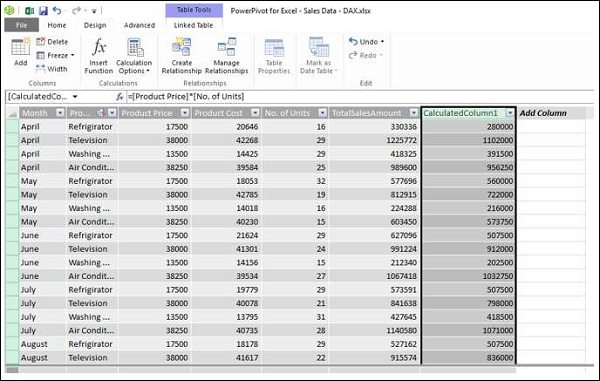
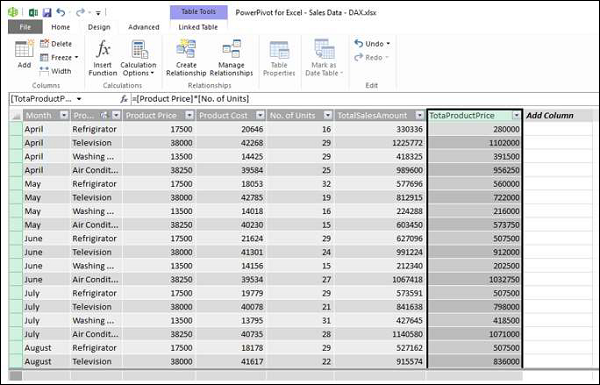
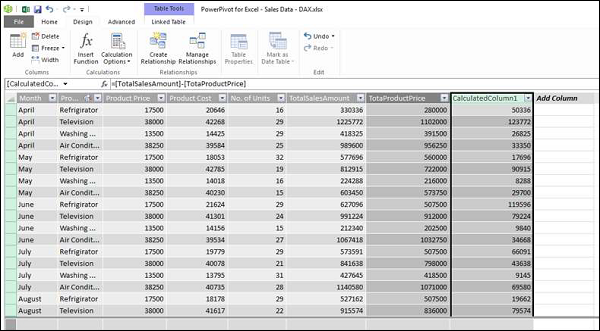
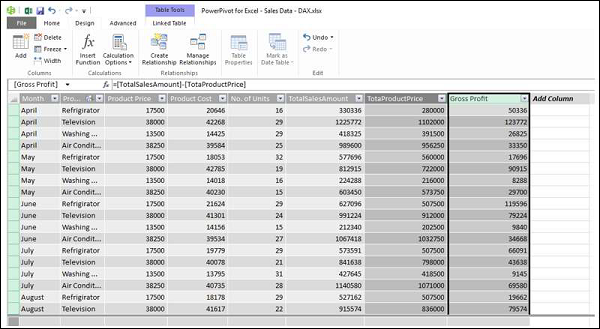
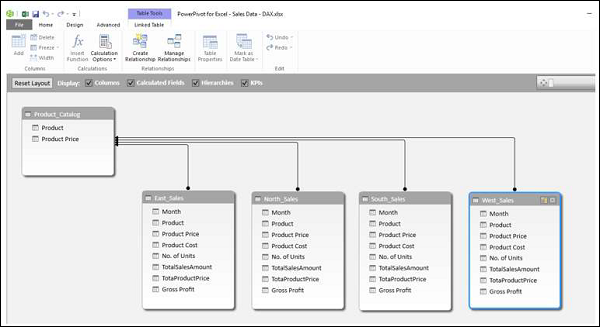
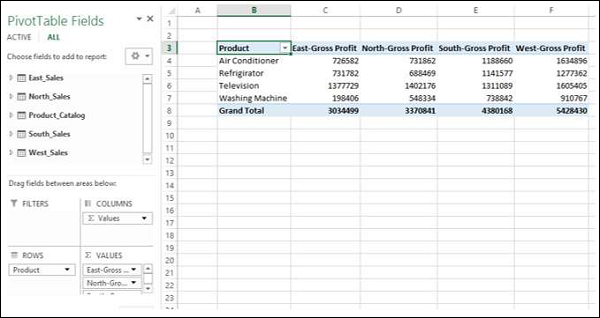
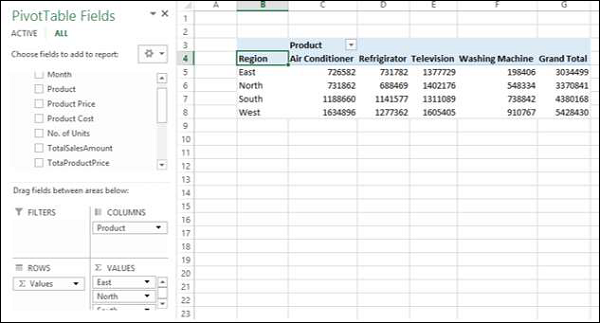
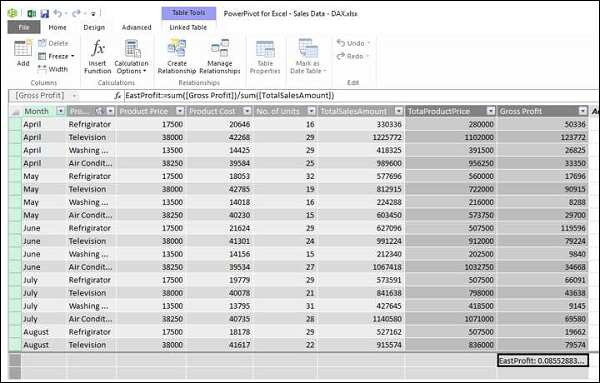
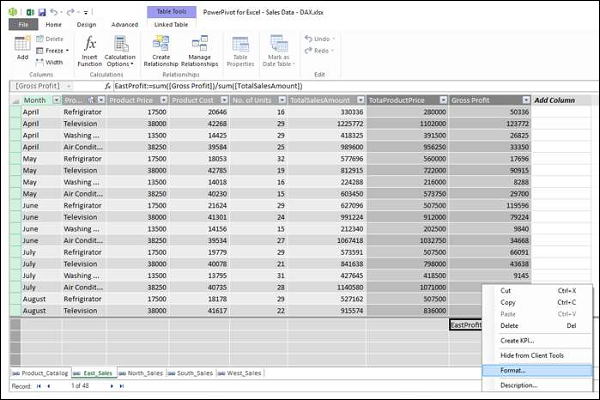
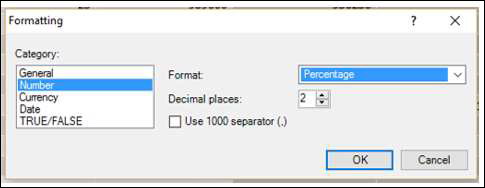
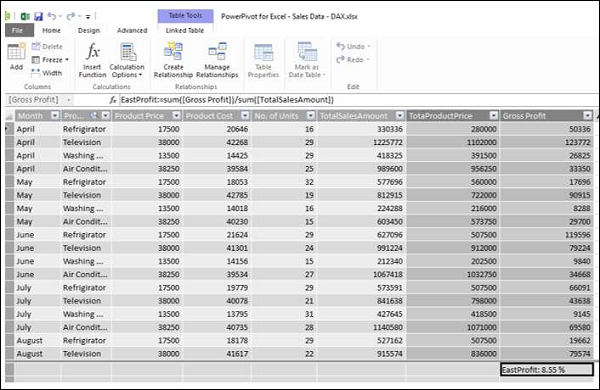
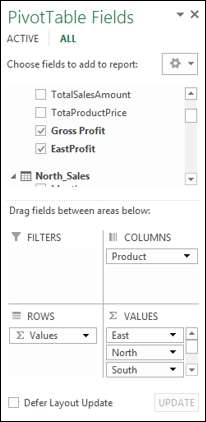
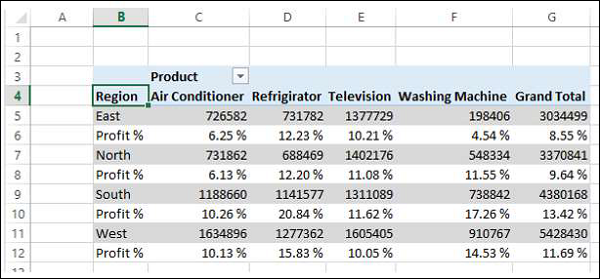
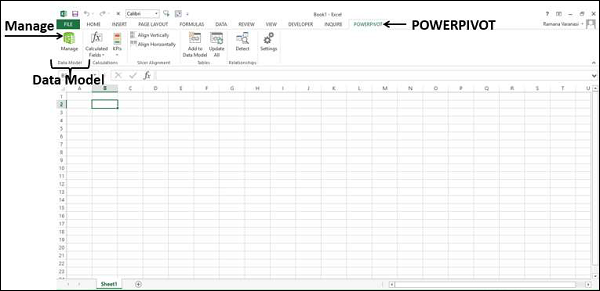


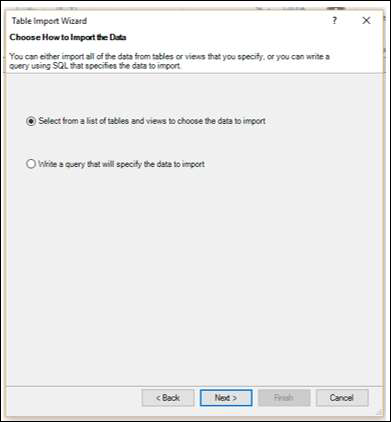
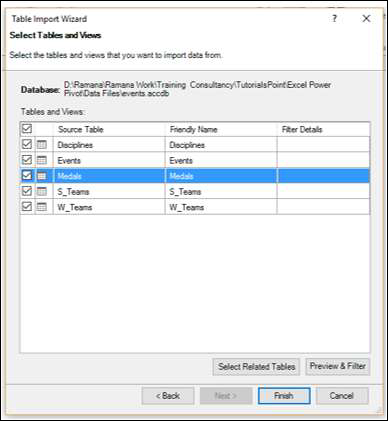

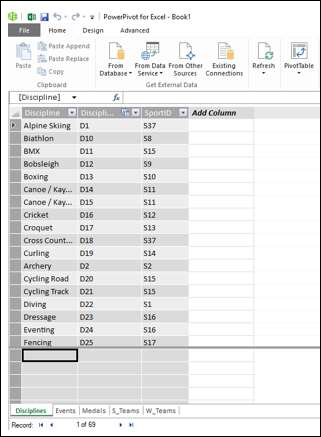
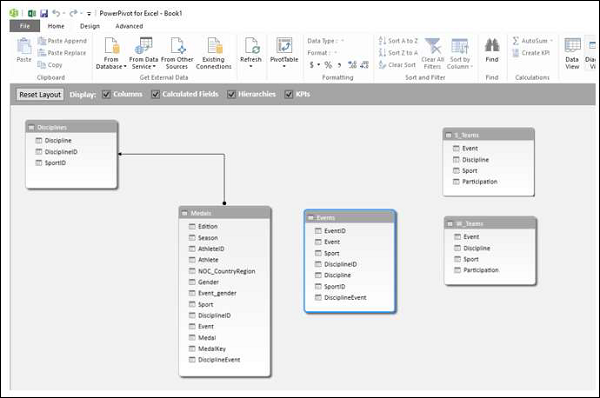

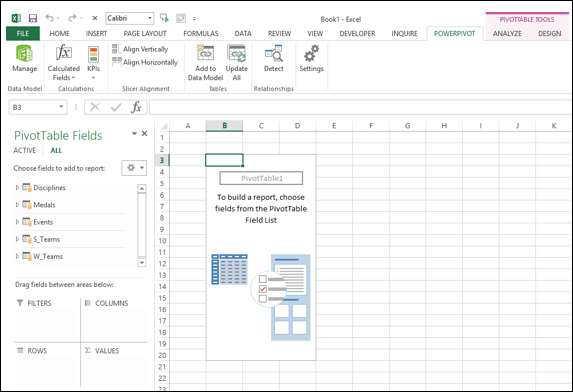
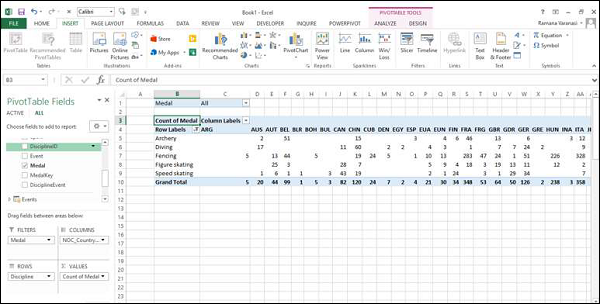
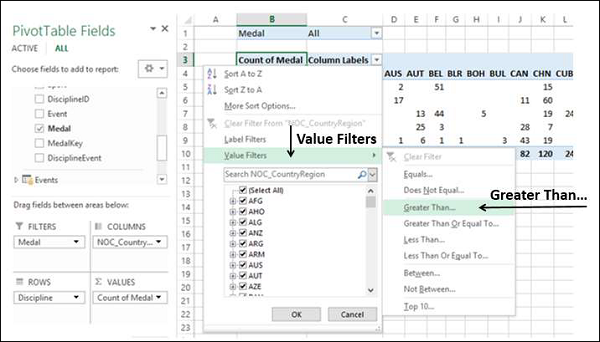


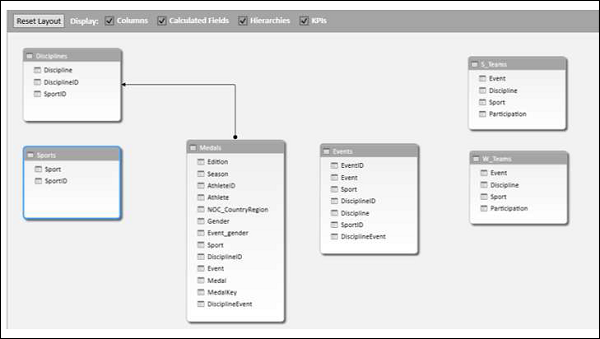
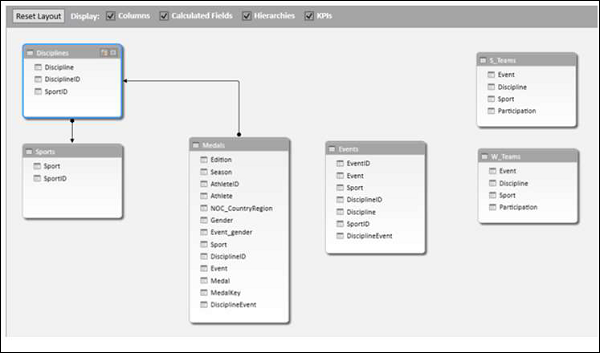
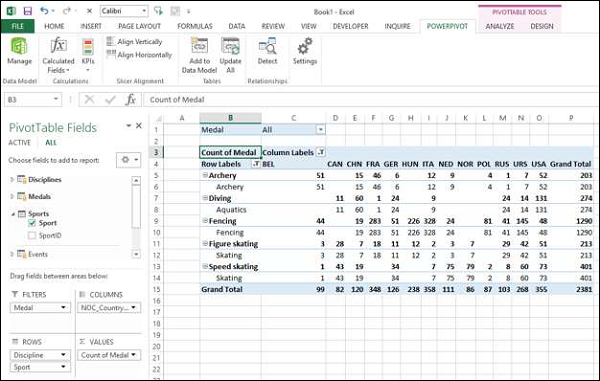
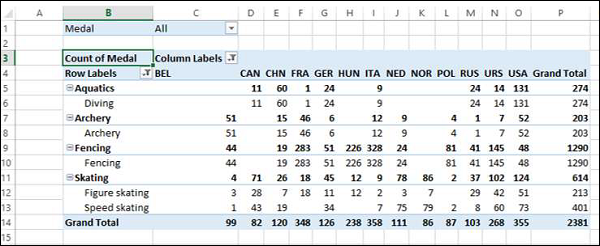
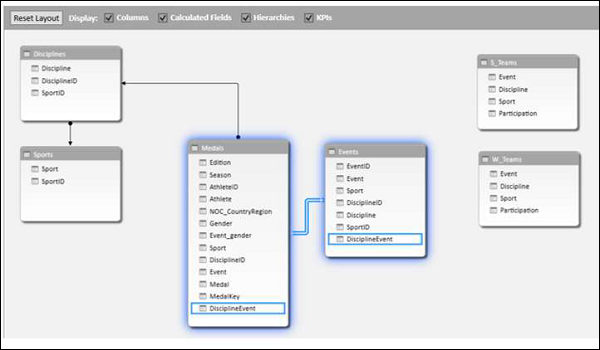
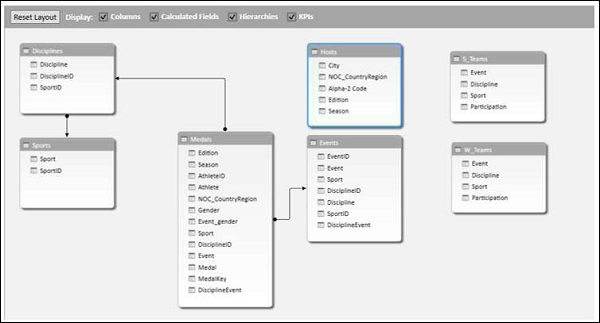
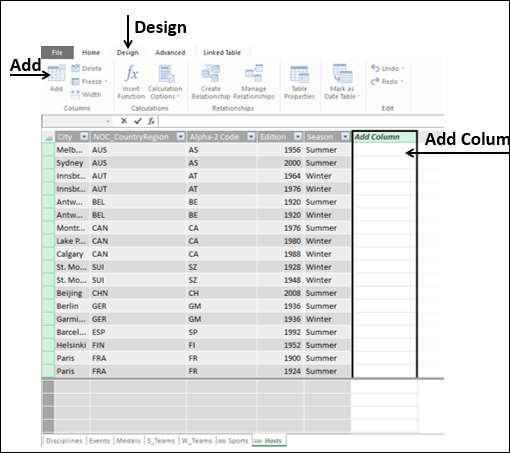
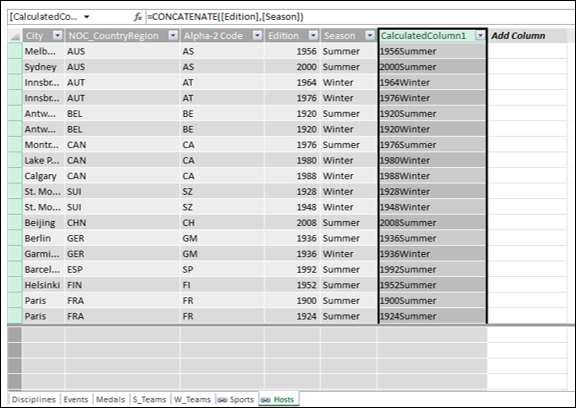


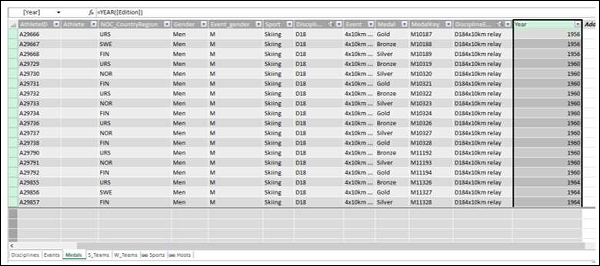
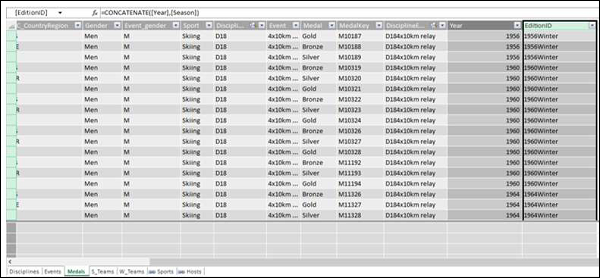
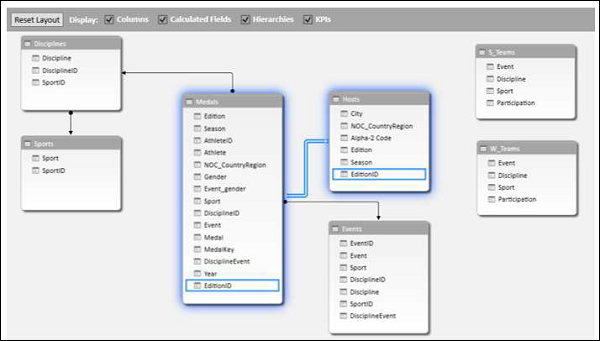
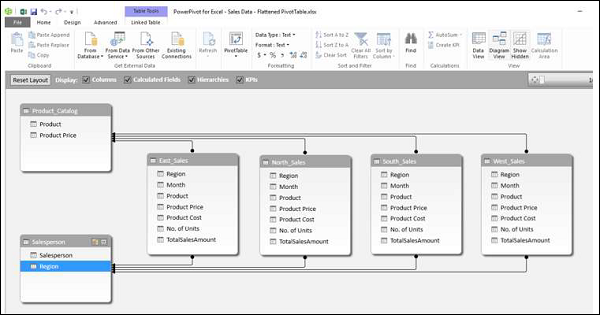
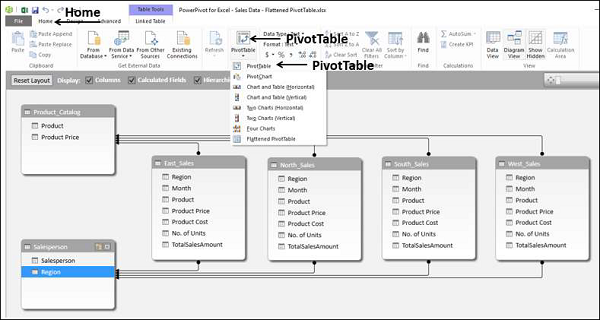
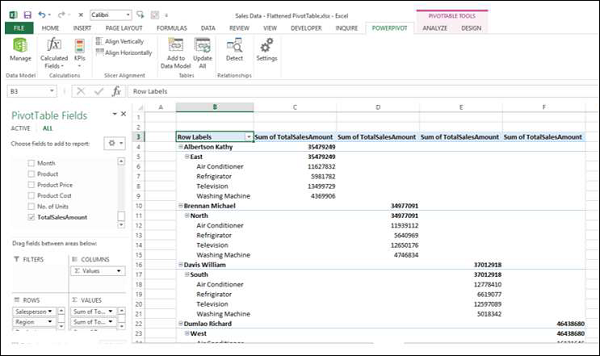
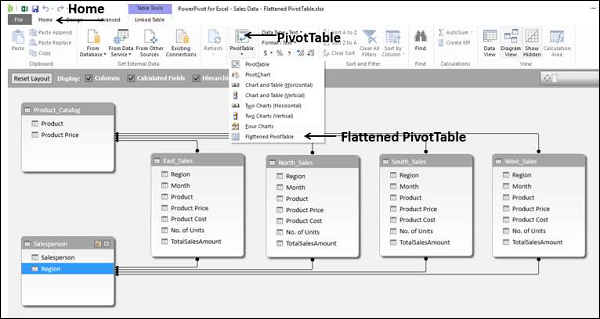
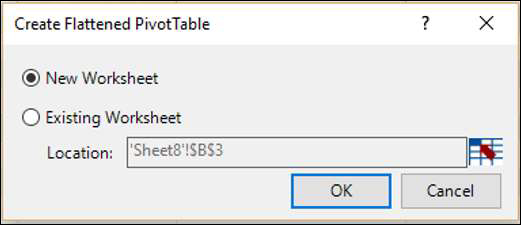
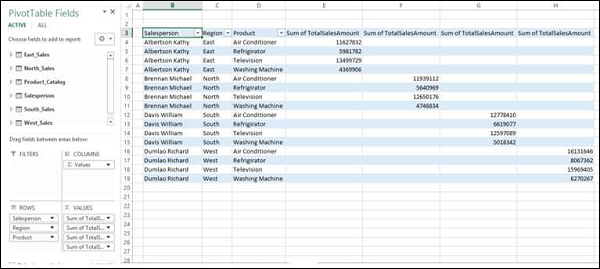
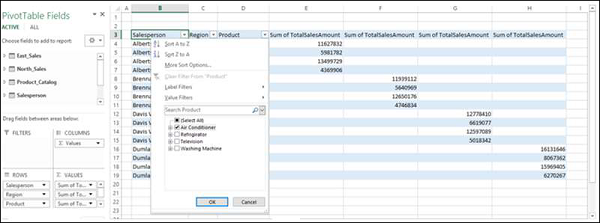
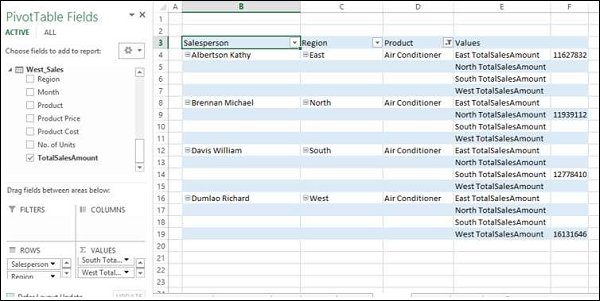
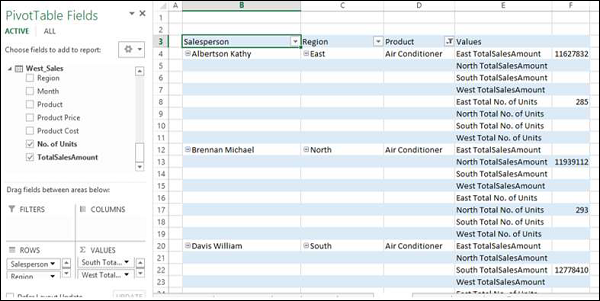
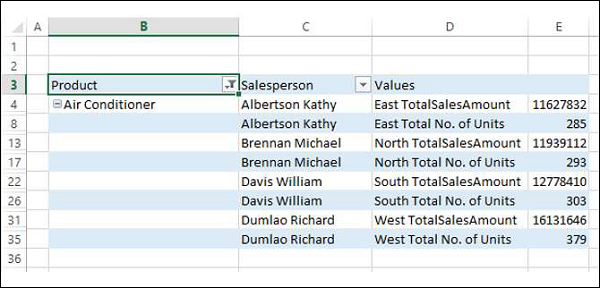
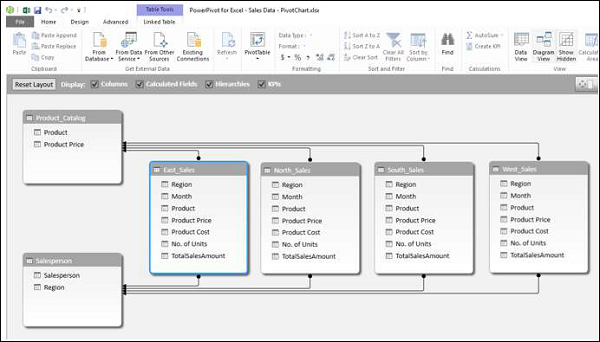
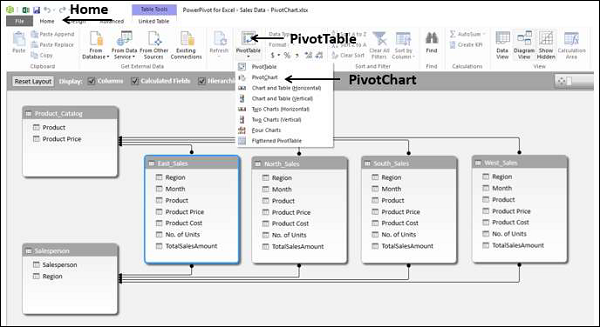
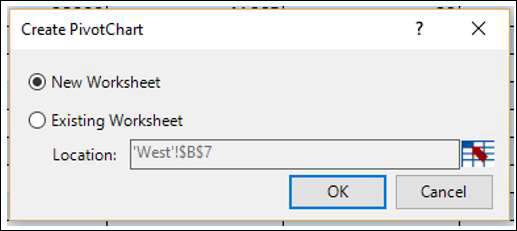
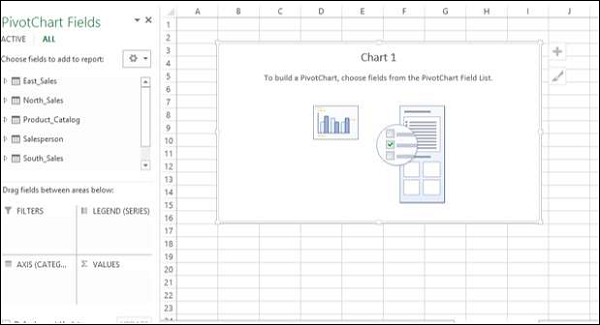

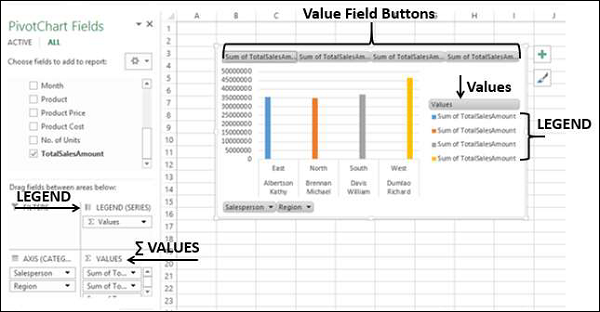
 button at the top right corner of the PivotChart. The Chart Elements dropdown list appears.
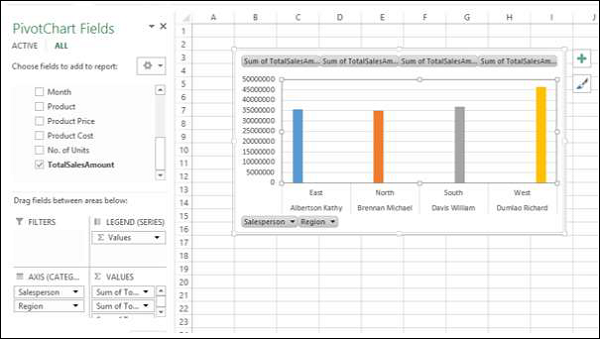
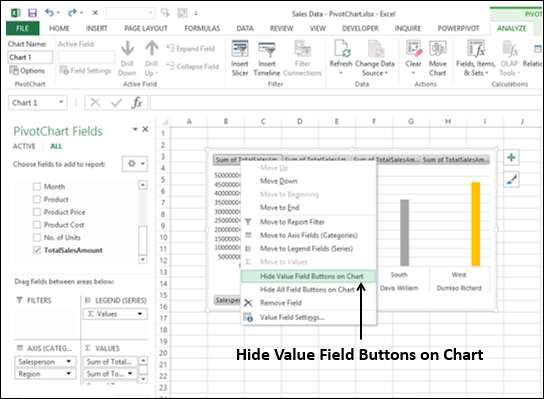
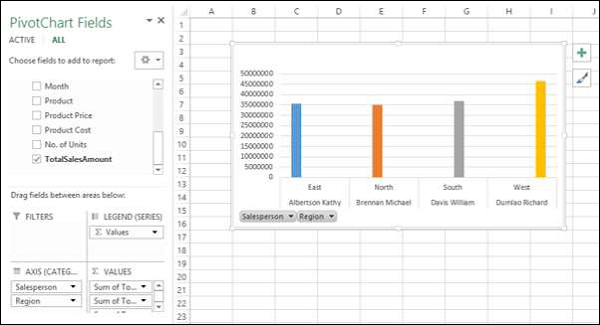
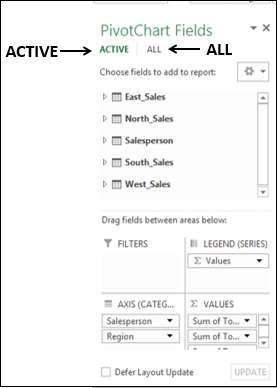
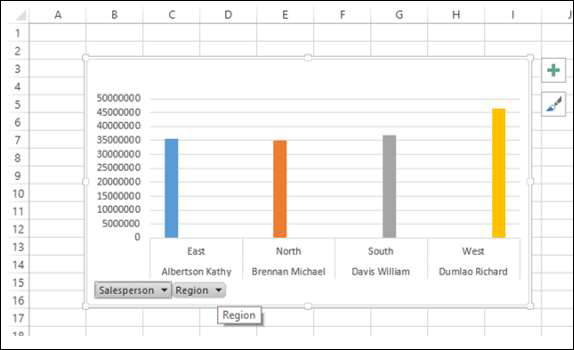
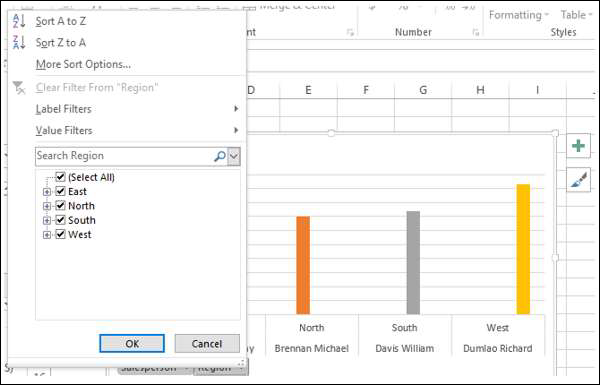
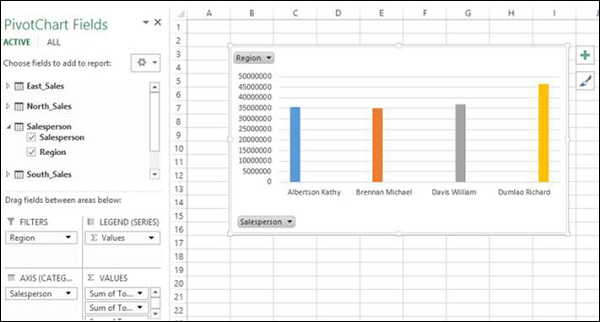
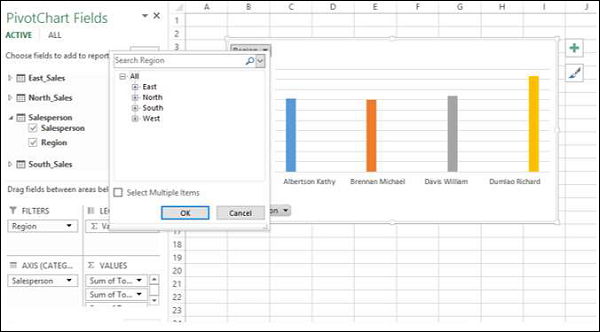
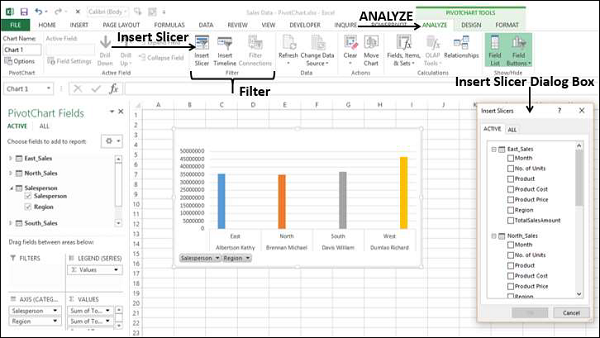
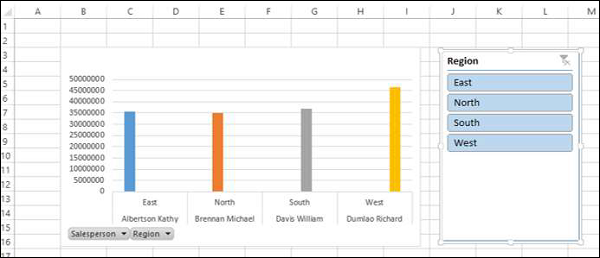


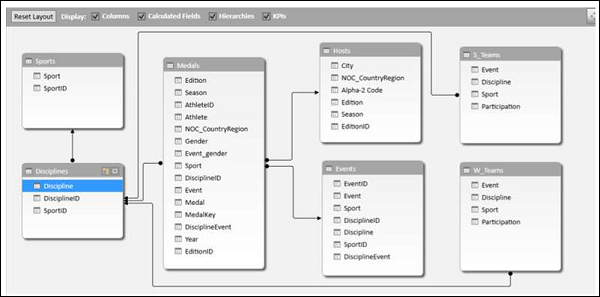
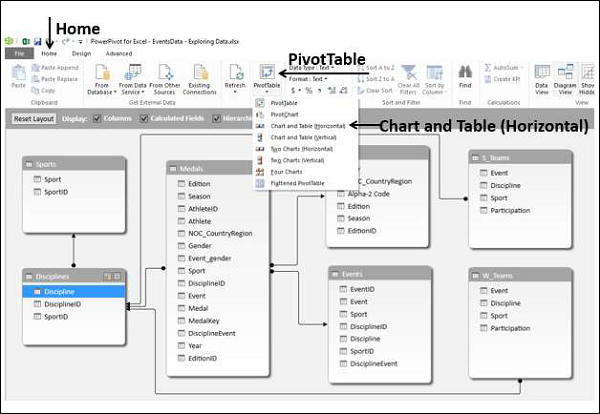
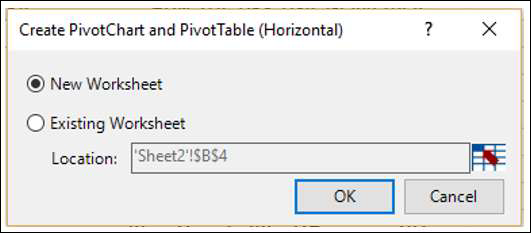
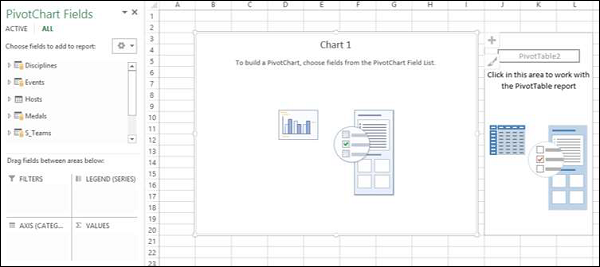
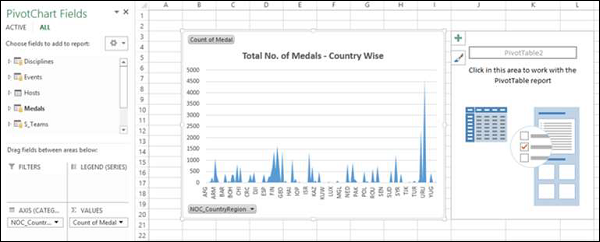
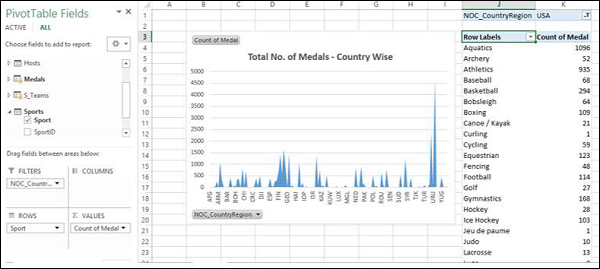

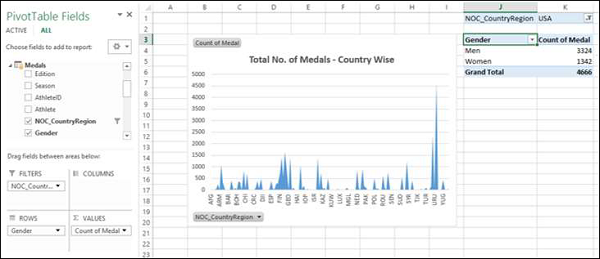
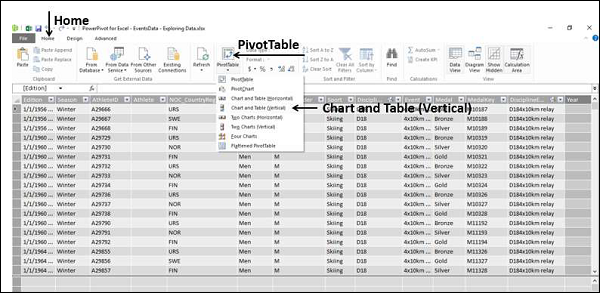
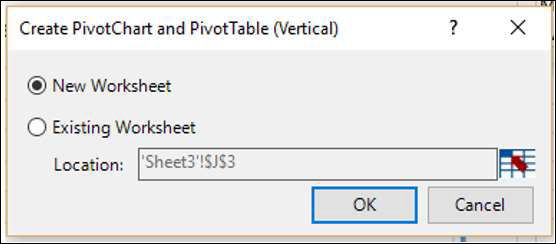
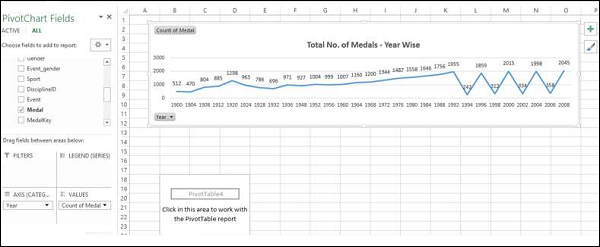
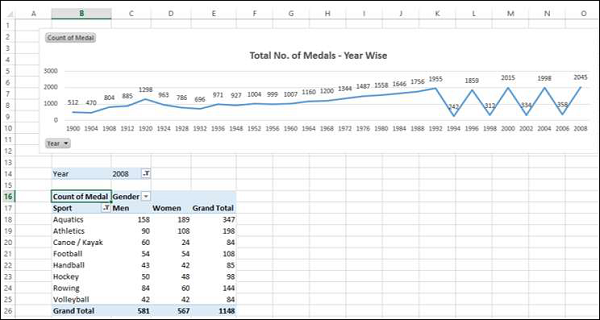
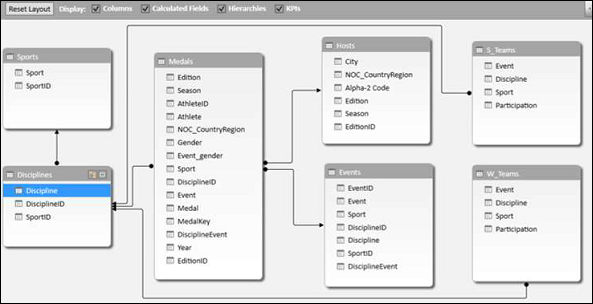
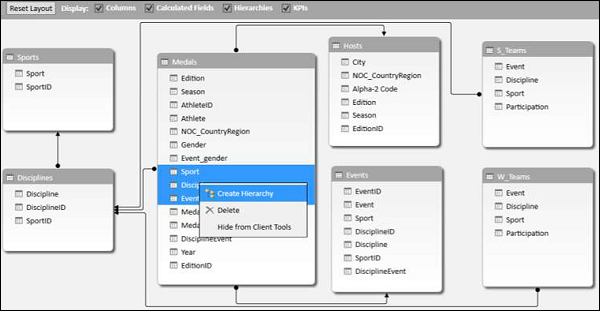
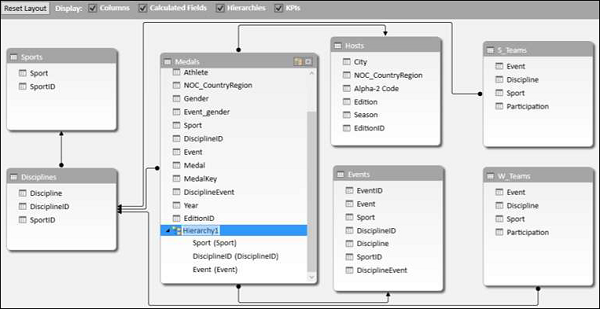
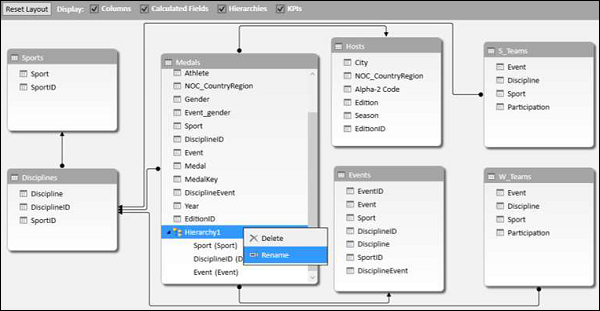
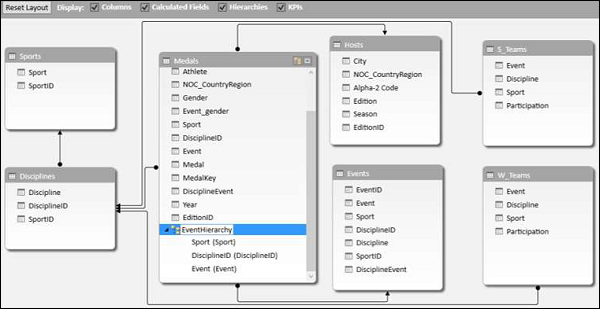
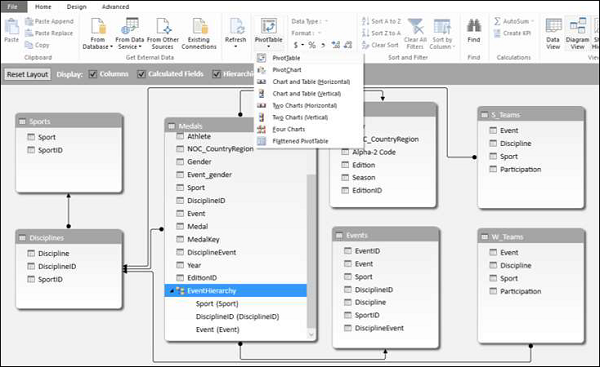
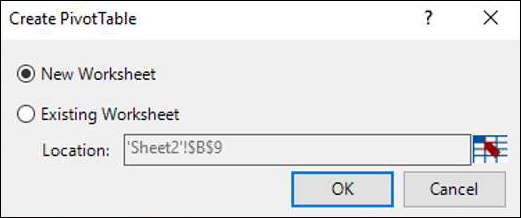
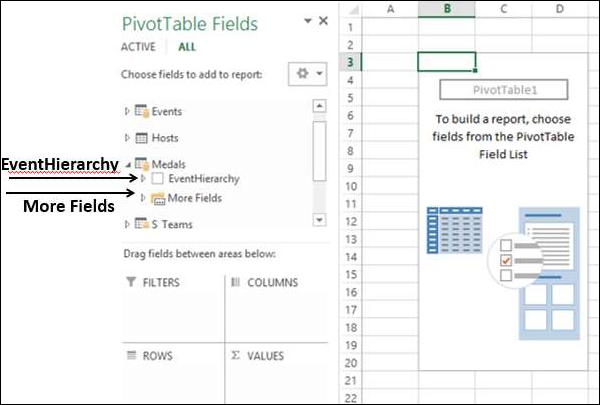
 in front of EventHierarchy.
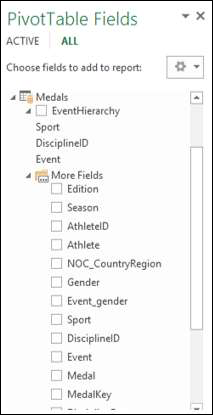
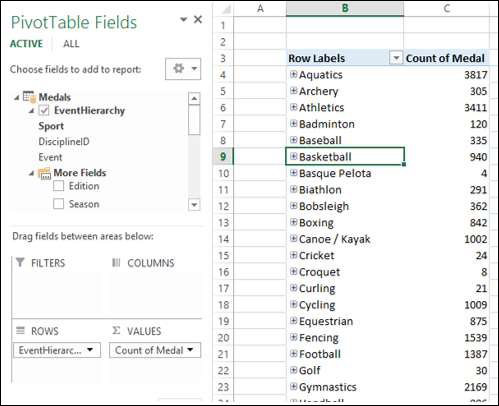
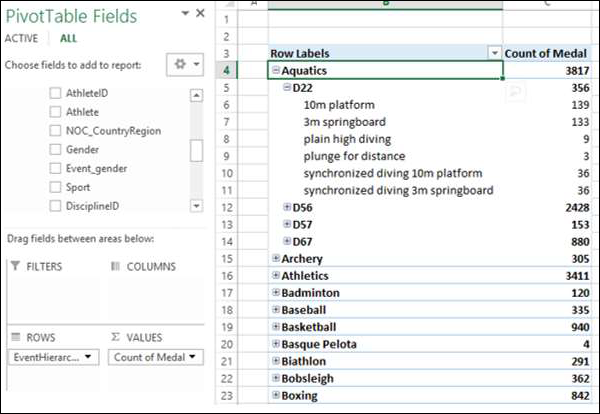
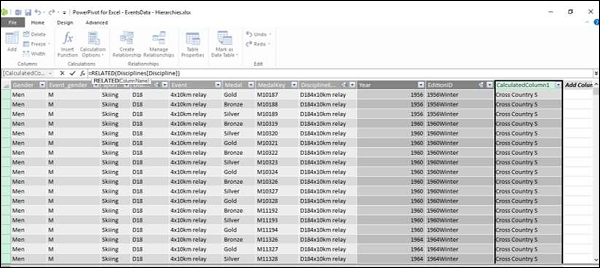
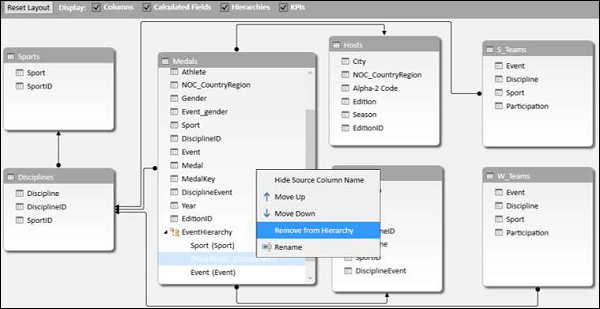

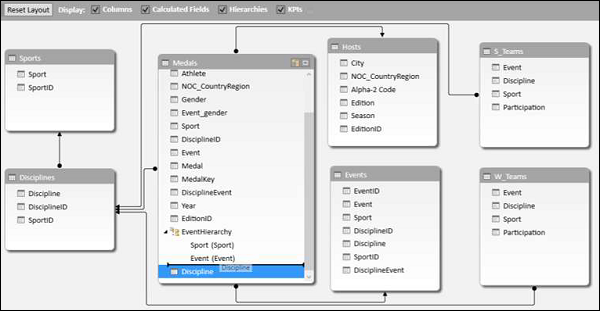
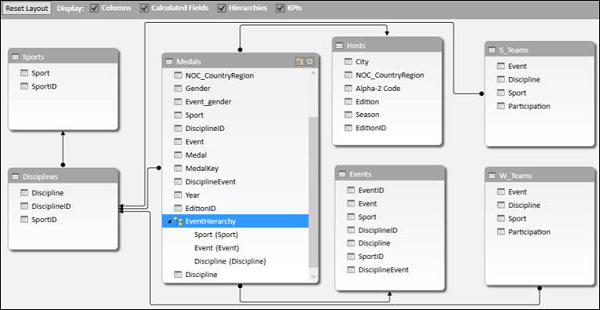
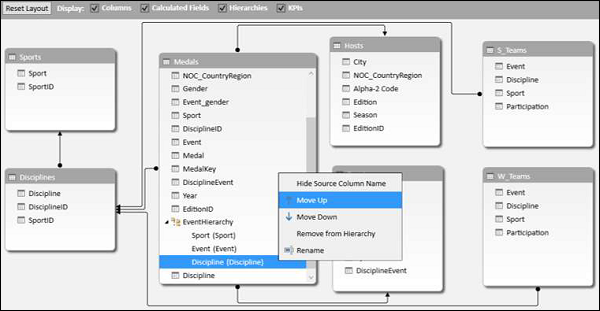
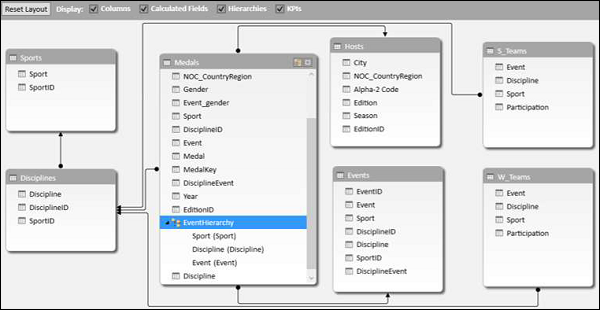
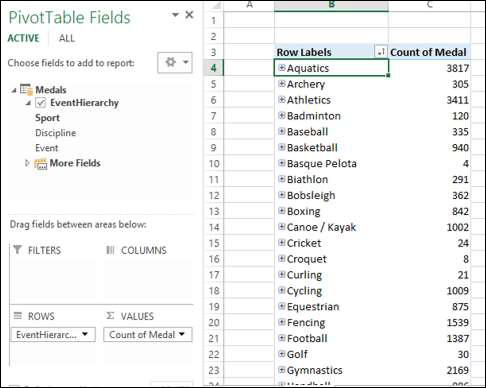
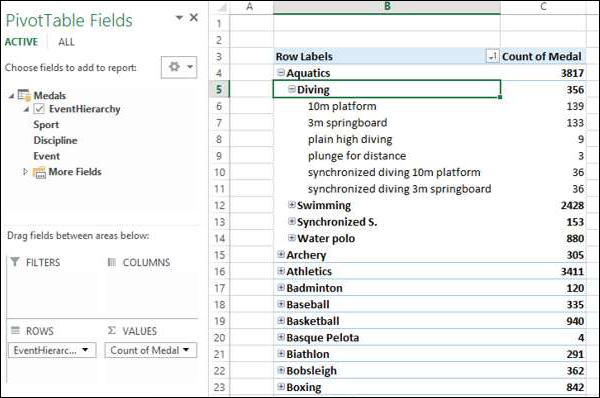

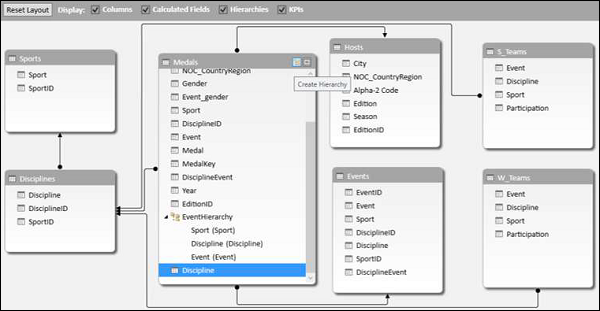
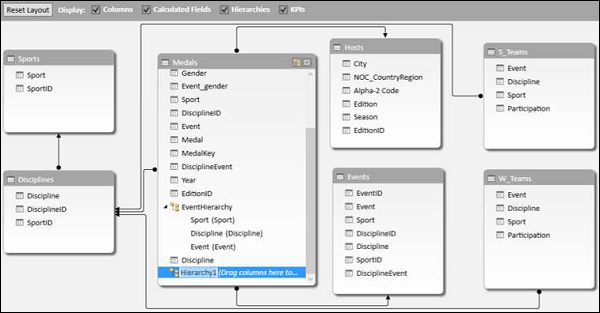
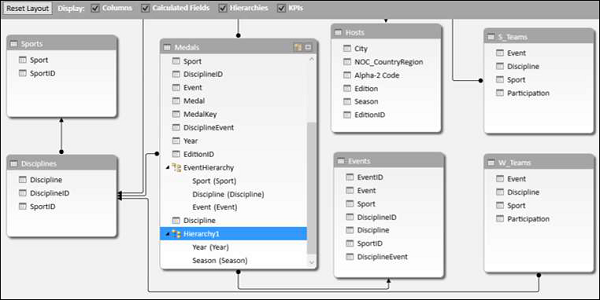
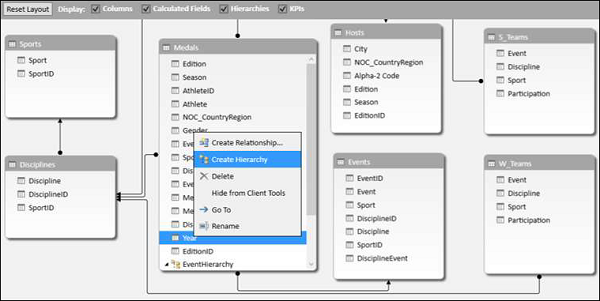
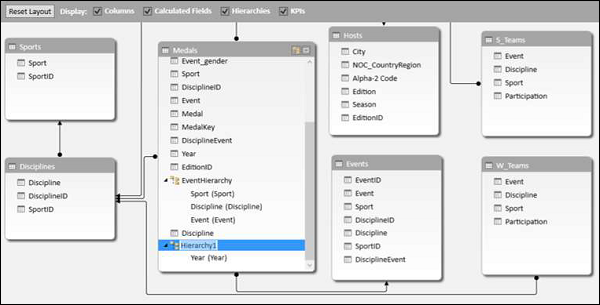
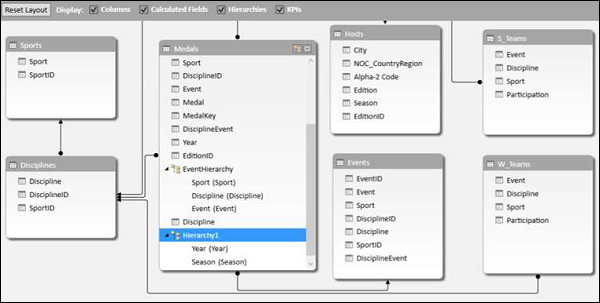
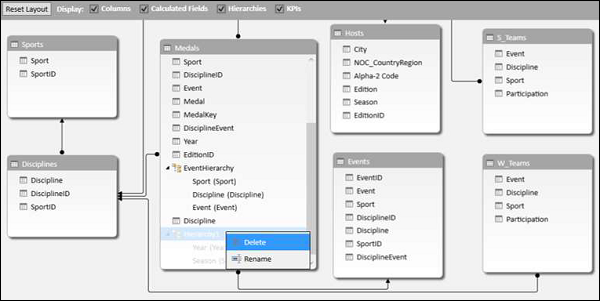

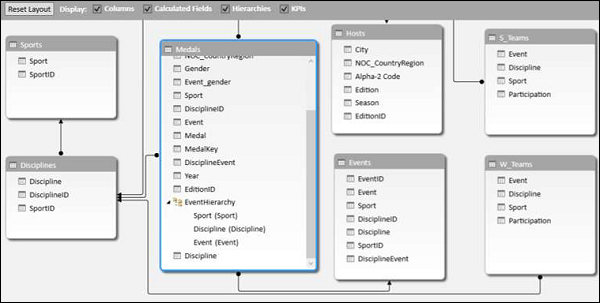
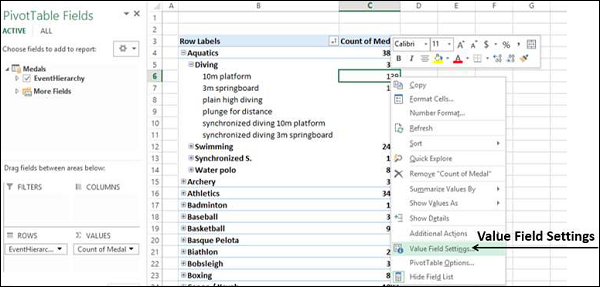
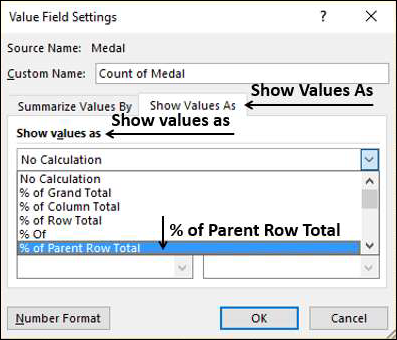
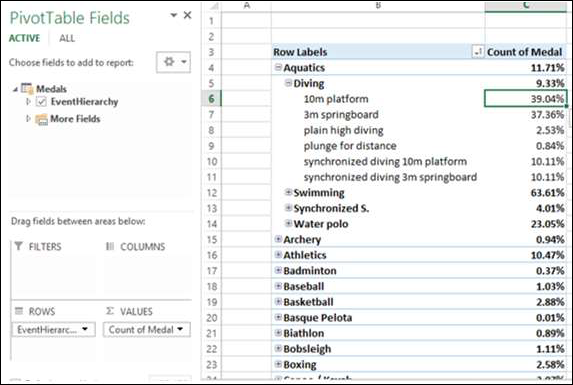
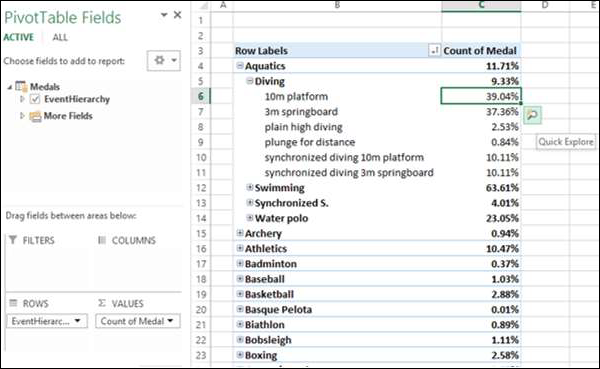
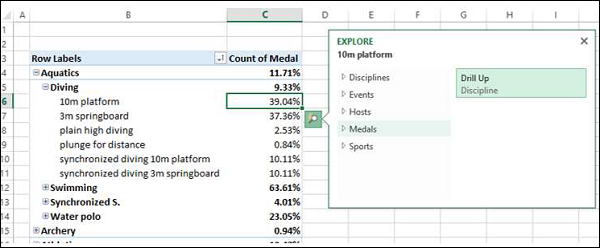
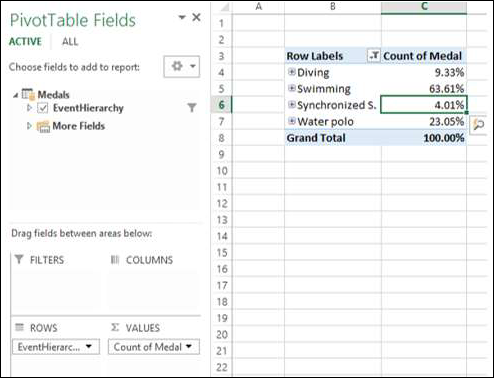
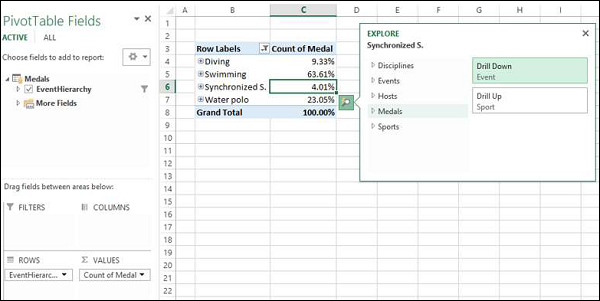
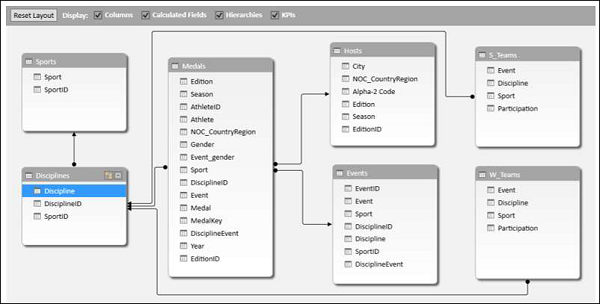
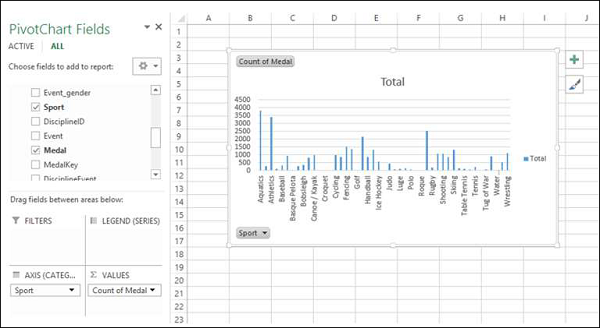
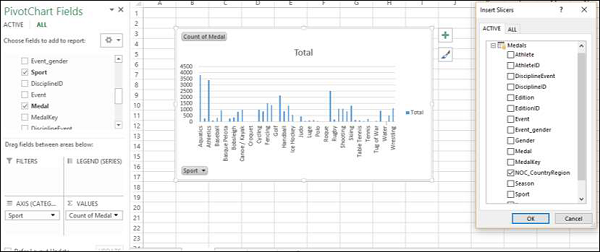
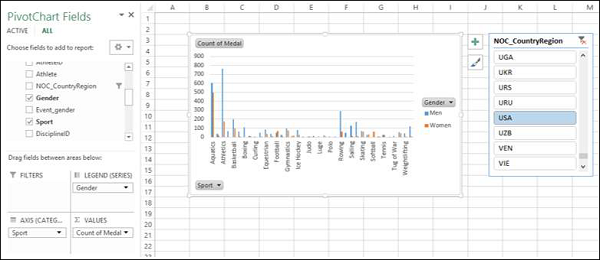

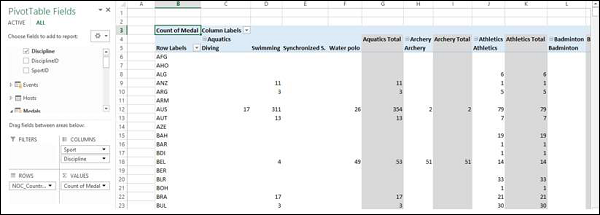
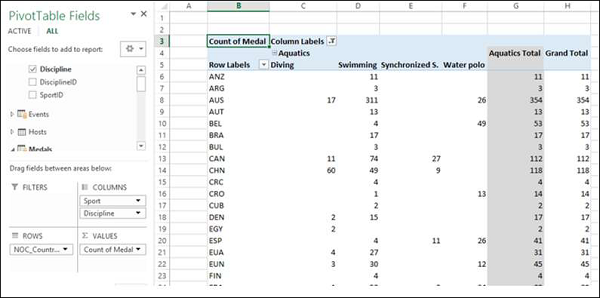
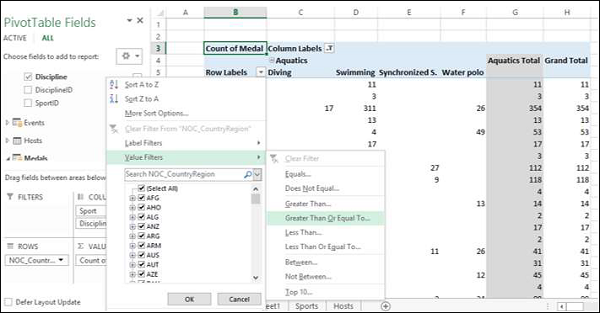
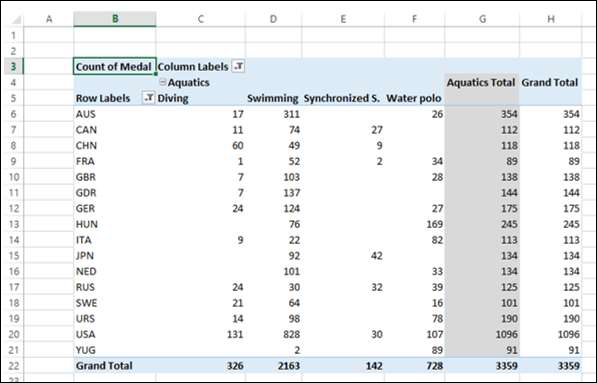
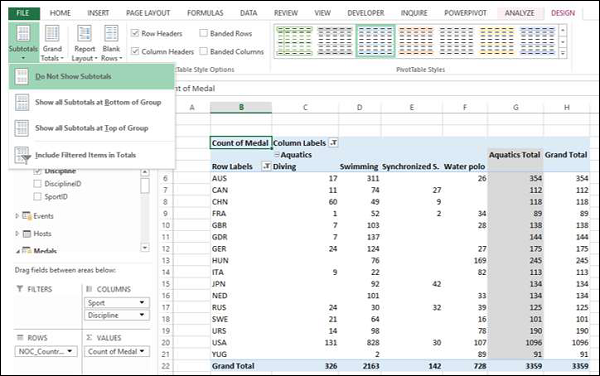
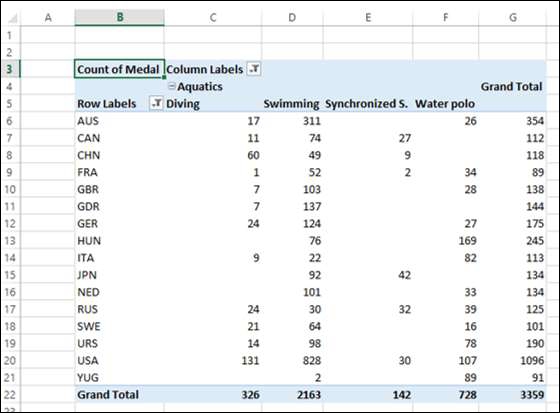
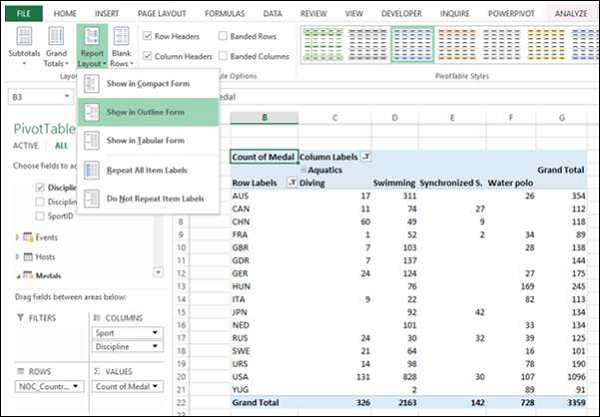
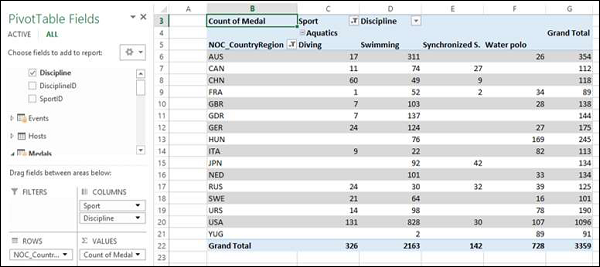
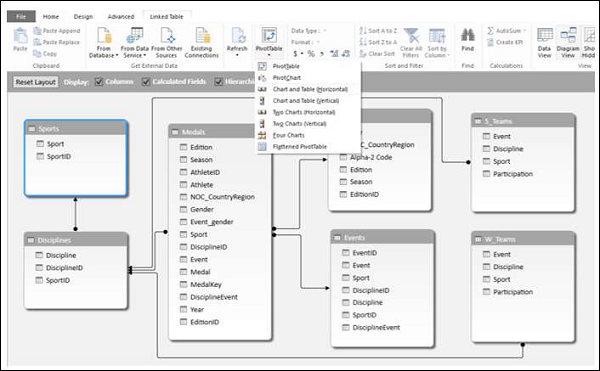
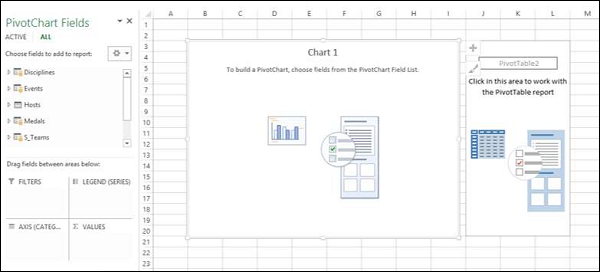
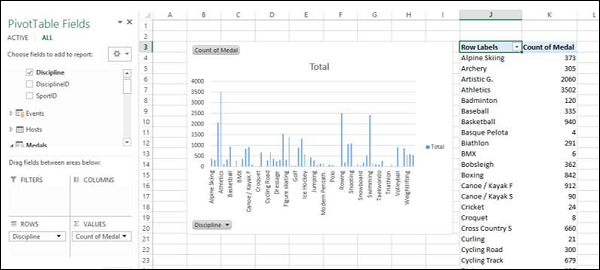
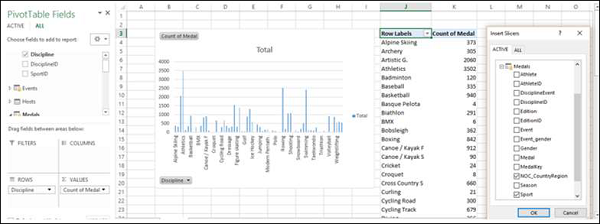
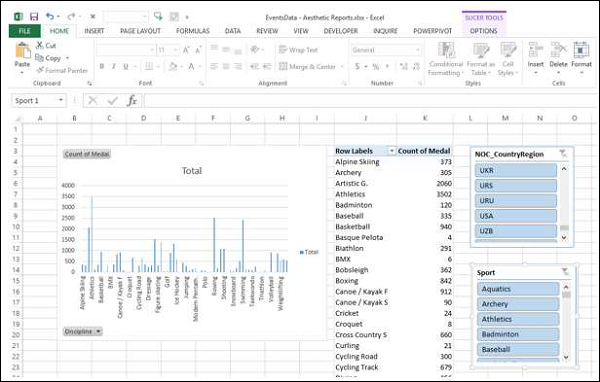
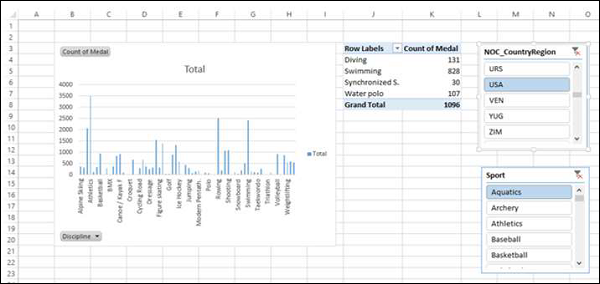
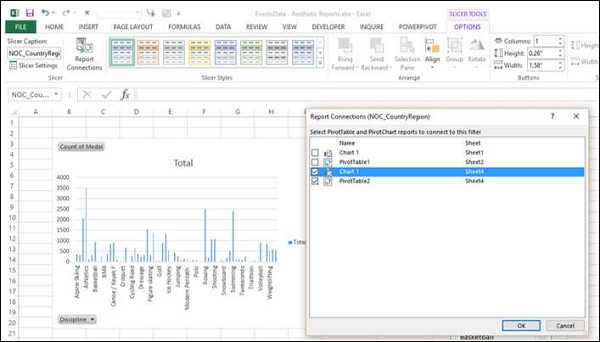
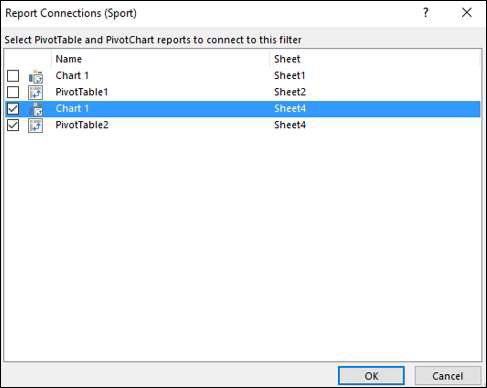

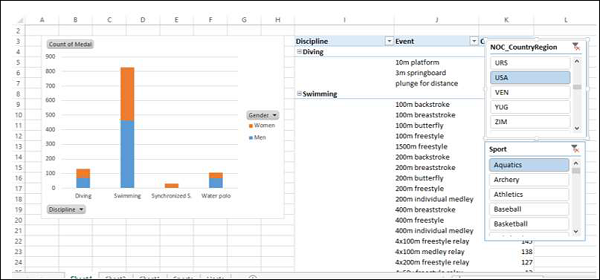
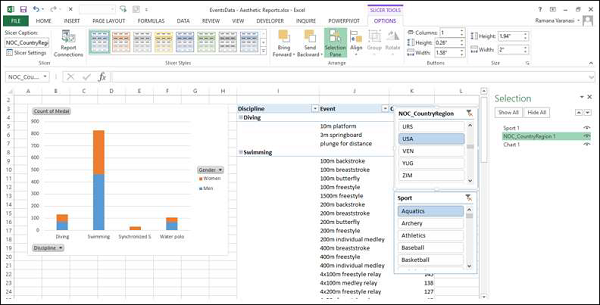
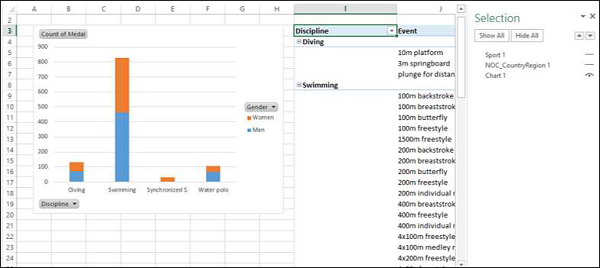
 for both. This means the visibility for the two Slicers is off.
