
Table of Contents ( Chi-Square Test in Excel )
- Chi Square Test in Excel
- How to do Chi Square Test in Excel?
Chi Square Test in Excel
Chi Square Test in Excel is one such statistical function used to calculate the expected value from a dataset with observed values. Excel is a versatile tool to analyze data visually as well as statistically. It is one of the few spreadsheet tools around which supports advanced statistical functions. Using these functions, we can gain insights from a dataset that may not be possible by just visually analyzing them. In this article, we will learn how to calculate the Chi Square from a database using excel. Before going into detail with the Chi Square Test, let us go through a few examples.
Chi Square Test is a test of the validity of a hypothesis. The Chi Square P Value tells us if our observed results are statistically significant or not. A statistically significant result means that we reject the null hypothesis (the null hypothesis in statistics is a statement or hypothesis which is likely to be incorrect). A Chi-Square P-Value is a number between 0 and 1. A Chi-Square P-Value less than 0.05 usually lead to rejection of the null hypothesis.
How to do Chi Square Test in Excel?
Let’s understand how to do the Chi Square Test in Excel with some examples.
You can download this Chi Square Test Excel Template here – Chi Square Test Excel Template
Example #1
Chi Square test can tell us whether the proportion of a given number of items is in one place based on a random sample are statistically independent of each other or not.
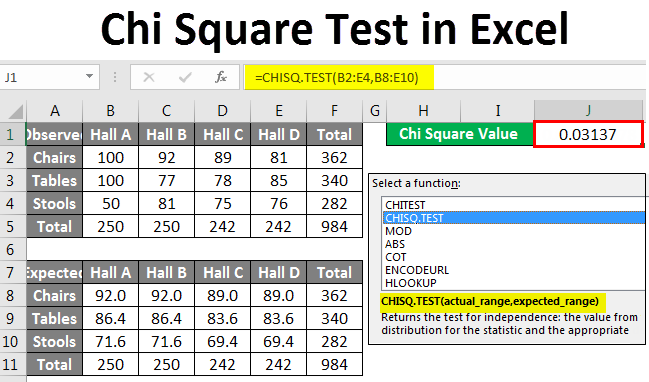
Suppose your company has 10000 pieces of furniture. About one by a tenth of them are distributed over four halls. We can find out what proportion of the total furniture is in one hall as shown below:

Observe that we have about 250 pieces of furniture in each hall. If we want to get the expected number of furniture by type, we will calculate it as follows:
Expected Value =Category Column Total X (Category Row Total/Total Sample Size)
Using this formula, we get an expected number of about 92 Chairs in Hall A as follows:
Expected Number of Chairs in Hall A = 250 X (362/984)
We will check the difference using the following formula:
((Observed Value-Expected Value)ⁿ)/expected value
In the case of the Chi Square test, n = 2
Which would give us the value 0.713928183. Similarly, we will find the values for each quantity and the sum of these values is the test statistic. This statistic has an approximate Chi-Squared distribution if each quantity is independent of the other. The following formula would determine the degree of freedom for each quantity:
(number of rows – 1)(number of columns – 1)
Which, in this case, is 6.
We find the Chi-Square P-value for the first value that is the number of chairs. The null hypothesis is that the location of the furniture is independent of the type of furniture.
The Chi Square P-value for the chairs would be calculated as:
The sum of all the Chi Square P values should be 1 if the null hypothesis is true.
If the test statistic is too large in the present dataset, then we reject the null hypothesis.
As is clear from the above example, calculating Chi Square and testing for significance of hypothesized data in statistics is a painstaking process and demands high accuracy. The above example can be analyzed using the CHISQ.TEST Function to get the Chi-Square value directly and check if our assumption that the location of the furniture is independent of the type of furniture is correct r not. In this case:
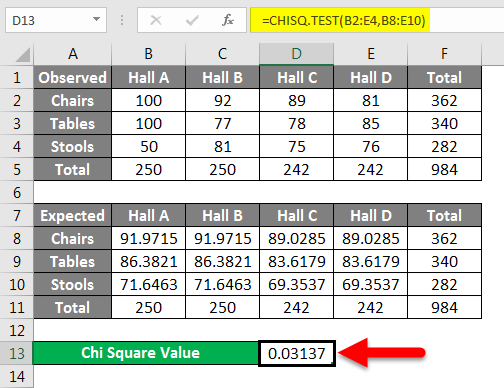
The Chi Square value is approximately 0.03. From our earlier discussion, we now know that this rejects the null hypothesis.
Example #2
To calculate the p-value in excel, we need to perform the following steps:
- Calculate your expected value. The expected value in chi-square is normally a simple average or mean for normally distributed datasets. For more complicated data, please check the example above.
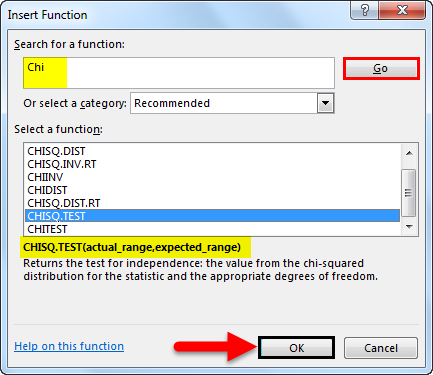
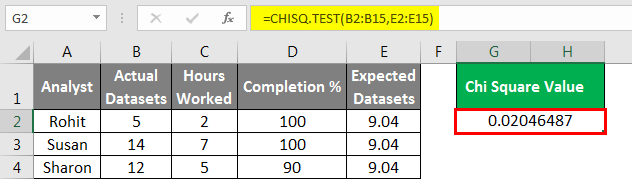
- Type your data into columns and click a blank cell where you want to show the results on the worksheet and then click the “Insert Function” button on the toolbar, a pop up would appear. Type chi in the Search for a Function box and then click “Go”.then select “CHITEST” from the list and then click “OK.”
- Select the observed and expected ranges and click “OK”.
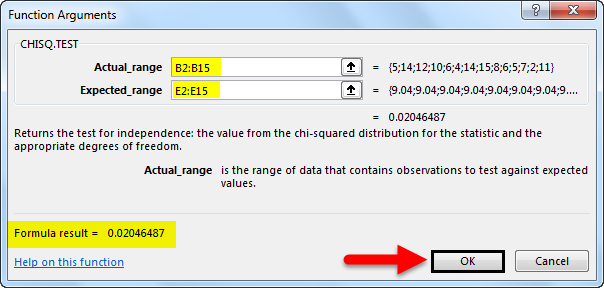
We will get the result as follows.
Things to Remember
- The CHISQ.TEST is not the only Chi Square function available in excel. All the variations of Chi-Square are available and can be used depending on your proficiency in statistics.
- The CHISQ functions can also be directly typed into a cell-like any other function. This would save time if you already know the data ranges you are working with.
- The CHISQ function’s reliability is directly dependent on the structure and distribution of the data and the clarity of the hypotheses being tested. Particular care should be used while employing a Chi Square Test to check significance.
Recommended Articles
This has been a guide to Chi Square Testin excel. Here we discuss How to do the Chi Square Test in excel along with practical examples and a downloadable excel template. You can also go through our other suggested articles –
- VLOOKUP Function in Excel
- Excel STDEV Function
- Substring in Excel
- Excel Square Root Function
Excel for Microsoft 365 Excel for Microsoft 365 for Mac Excel for the web Excel 2021 Excel 2021 for Mac Excel 2019 Excel 2019 for Mac Excel 2016 Excel 2016 for Mac Excel 2013 Excel 2010 Excel for Mac 2011 Excel Starter 2010 More…Less
Returns the test for independence. CHISQ.TEST returns the value from the chi-squared (χ2) distribution for the statistic and the appropriate degrees of freedom. You can use χ2 tests to determine whether hypothesized results are verified by an experiment.
Syntax
CHISQ.TEST(actual_range,expected_range)
The CHISQ.TEST function syntax has the following arguments:
-
Actual_range Required. The range of data that contains observations to test against expected values.
-
Expected_range Required. The range of data that contains the ratio of the product of row totals and column totals to the grand total.
Remarks
-
If actual_range and expected_range have a different number of data points, CHISQ.TEST returns the #N/A error value.
-
The χ2 test first calculates a χ2 statistic using the formula:

where:
Aij = actual frequency in the i-th row, j-th column
Eij = expected frequency in the i-th row, j-th column
r = number or rows
c = number of columns
-
A low value of χ2 is an indicator of independence. As can be seen from the formula, χ2 is always positive or 0, and is 0 only if Aij = Eij for every i,j.
-
CHISQ.TEST returns the probability that a value of the χ2 statistic at least as high as the value calculated by the above formula could have happened by chance under the assumption of independence. In computing this probability, CHISQ.TEST uses the χ2 distribution with an appropriate number of degrees of freedom, df. If r > 1 and c > 1, then df = (r — 1)(c — 1). If r = 1 and c > 1, then df = c — 1 or if r > 1 and c = 1, then df = r — 1. r = c= 1 is not allowed and #N/A is returned.
-
Use of CHISQ.TEST is most appropriate when Eij’s are not too small. Some statisticians suggest that each Eij should be greater than or equal to 5.
Example
Copy the example data in the following table, and paste it in cell A1 of a new Excel worksheet. For formulas to show results, select them, press F2, and then press Enter. If you need to, you can adjust the column widths to see all the data.
|
Men (Actual) |
Women (Actual) |
Description |
|
58 |
35 |
Agree |
|
11 |
25 |
Neutral |
|
10 |
23 |
Disagree |
|
Men (Expected) |
Women (Expected) |
Description |
|
45.35 |
47.65 |
Agree |
|
17.56 |
18.44 |
Neutral |
|
16.09 |
16.91 |
Disagree |
|
Formula |
Description |
Result |
|
=CHISQ.TEST(A2:B4,A6:B8) |
The χ2 statistic for the data above is 16.16957 with 2 degrees of freedom |
0.0003082 |
Need more help?
A Chi-Square Goodness of Fit Test is used to determine whether or not a categorical variable follows a hypothesized distribution.
This tutorial explains how to perform a Chi-Square Goodness of Fit Test in Excel.
Example: Chi-Square Goodness of Fit Test in Excel
A shop owner claims that an equal number of customers come into his shop each weekday. To test this hypothesis, an independent researcher records the number of customers that come into the shop on a given week and finds the following:
- Monday: 50 customers
- Tuesday: 60 customers
- Wednesday: 40 customers
- Thursday: 47 customers
- Friday: 53 customers
We will use the following steps to perform a Chi-Square goodness of fit test to determine if the data is consistent with the shop owner’s claim.
Step 1: Input the data.
First, we will input the data values for the expected number of customers each day in one column and the observed number of customers each day in another column:

Note: There were 250 customers total. Thus, if the shop owner expects an equal number to come into the shop each day then he would expect 50 customers per day.
Step 2: Find the difference between the observed and expected values.
The Chi-Square test statistic for the Goodness of Fit test is X2 = Σ(O-E)2 / E
where:
- Σ: is a fancy symbol that means “sum”
- O: observed value
- E: expected value
The following formula shows how to calculate (O-E)2 / E for each row:

Step 3: Calculate the Chi-Square test statistic and the corresponding p-value.
Lastly, we will calculate the Chi-Square test statistic along with the corresponding p-value using the following formulas:

Note: The Excel function CHISQ.DIST.RT(x, deg_freedom) returns the right-tailed probability of the Chi-Square distribution associated with a test statistic x and a certain degrees of freedom. The degrees of freedom is calculated as n-1. In this case, deg_freedom = 5 – 1 = 4.
Step 4: Interpret the results.
The X2 test statistic for the test is 4.36 and the corresponding p-value is 0.3595. Since this p-value is not less than 0.05, we fail to reject the null hypothesis. This means we do not have sufficient evidence to say that the true distribution of customers is different from the distribution that the shop owner claimed.
The chi-square test is a non-parametric test that compares two or more variables from randomly selected data. It helps find the relationship between two or more variables. In Excel, we calculate the chi-square p-value. Since Excel does not have an inbuilt function, mathematical formulas are used to perform the chi-square test.
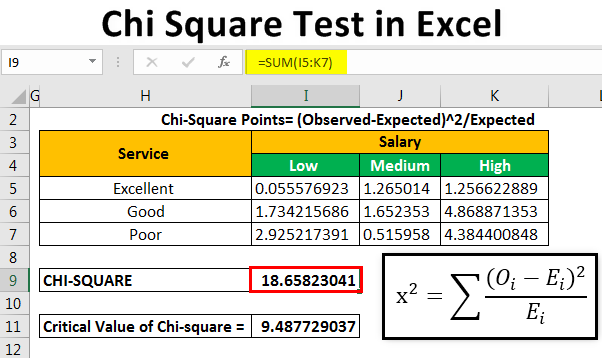
Table of contents
- Chi-Square Test in Excel
- #1 – Chi-Square Goodness of Fit Test
- The Uses of the Goodness of Fit Test
- #2 – Chi-Square Test for Independence
- The Uses of the Chi-Square Test for Independence
- The Characteristics of the Chi-Square Test
- How to Perform the Chi-Square Test in Excel? (With Example)
- Frequently Asked Questions
- Recommended Articles
- #1 – Chi-Square Goodness of Fit Test
There are two types of chi-square tests which are listed as follows:
- Chi-square goodness of fit test
- Chi-square test for independence
#1 – Chi-Square Goodness of Fit Test
The goodness of fit test helps determine whether the sample data matches the population or not. In other words, it shows how well the sample data fits a set of observations.
The symbol of the chi-square test is “x2” (i.e., “x” raised to the power 2). “x2” is the summation of the (observed count–expected count)2/expected count.
The formula of the chi-square goodness of fit test is given as follows:

Where,
- “x2” is the chi-square statistic
- “Oi” is the observed frequency
- “Ei” is the expected frequency
- “i” is the “ith” position in the contingency table
- “k” is the category
- Degrees of freedom (df)=k-1
The Uses of the Goodness of Fit Test
The test is used in the following situations:
- To evaluate the creditworthinessCreditworthiness is a measure of judging the loan repayment history of borrowers to ascertain their worth as a debtor who should be extended a future credit or not. For instance, a defaulter’s creditworthiness is not very promising, so the lenders may avoid such a debtor out of the fear of losing their money. Creditworthiness applies to people, sovereign states, securities, and other entities whereby the creditors will analyze your creditworthiness before getting a new loan.read more of borrowers based on their age group and history of debt obligations
- To establish a relation between the performance of sales representatives and the training received by them
- To compare the returns of a single stock with the returns on stocks of the whole sector
- To evaluate the impact of a television campaign on a category of viewers
#2 – Chi-Square Test for Independence
It helps determine whether the variables are independent of one another or not. Two random variables are called independent if the probability distributionProbability distribution could be defined as the table or equations showing respective probabilities of different possible outcomes of a defined event or scenario. In simple words, its calculation shows the possible outcome of an event with the relative possibility of occurrence or non-occurrence as required.read more of one variable is not affected by the other.
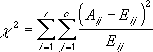
The formula of the chi-square test for independence is given as follows:

Where,
- “x2” is the chi-square statistic
- “Oij” is the observed frequency in the ith row and jth column
- “Eij”is the expected frequency in the ith row and jth column
- “r” is the number of rows
- “c” is the number of columns
- Degrees of freedom (df)=(r-1)(c-1)
The formula for calculating the expected frequency in the ith row and jth column is given as follows:

The Uses of the Chi-Square Test for Independence
The test is used in the following situations:
- There are two categorical variables and the relation between them is to be determined.
- There are cross-tabulations (two-way tables) and the relationship between various categorical variables needs to be studied.
- There are non-quantifiable variables. For example, one needs to determine the reason behind variations of health plans across age groups.
The Characteristics of the Chi-Square Test
The features of the chi-square test are listed as follows:
- It evaluates whether observed frequencies vary significantly from the expected frequencies under a given set of assumptions.
- It determines how well an assumed distribution fits the data.
- It uses the contingency tables (or crosstabs) to summarize the relationship between various categorical variables.
- It supports nominal level measurements.
Note: In the simplest form, the chi-square distribution is the square of the standard normal distribution.
How to Perform the Chi-Square Test in Excel? (With Example)
You can download this Chi Square Test Excel Template here – Chi Square Test Excel Template
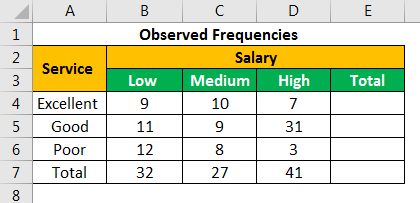
A restaurant manager wants to find the relationship between quality of service and the salary of customers waiting to be served.
She organizes the task in the following way:
- A random sample of 100 customers is considered.
- Every customer is asked to rate the service of the restaurant as “excellent,” “good,” and “poor.”
She constructs the following hypothesis:
- Null hypothesisNull hypothesis presumes that the sampled data and the population data have no difference or in simple words, it presumes that the claim made by the person on the data or population is the absolute truth and is always right. So, even if a sample is taken from the population, the result received from the study of the sample will come the same as the assumption.read more (H0)–The quality of service is not dependent on the salary of customers waiting to be served.
- Alternative hypothesis (H1)–The quality of service is dependent on the salary of customers waiting to be served.
The manager divides the customers into three categories based on their salaries–“low,” “medium,” and “high.” The level of significance (α) is 0.05.
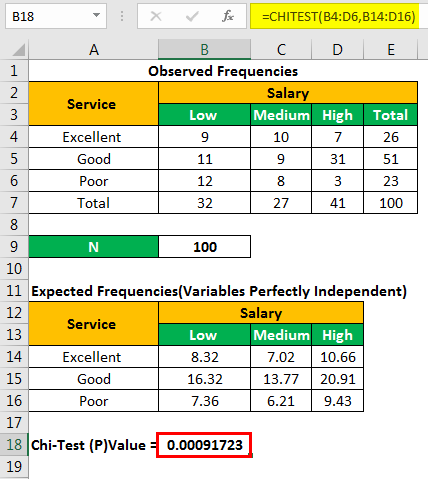
The findings are presented as nine data points shown in the following table.
Let us calculate the sum of all the rows and columns. We apply the following SUM formula to add the numbers of the fourth row.
“=SUM(B4:D4)”
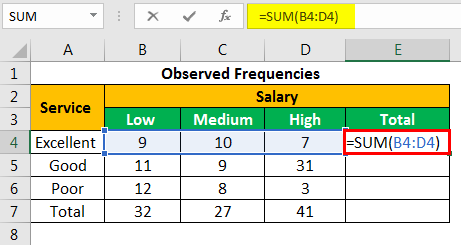
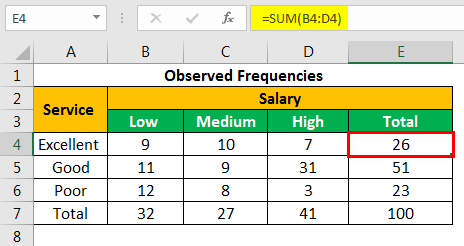
Press the “Enter” key and the sum appears in cell E4. The output is 26.
Similarly, we apply the SUM formulaThe SUM function in excel adds the numerical values in a range of cells. Being categorized under the Math and Trigonometry function, it is entered by typing “=SUM” followed by the values to be summed. The values supplied to the function can be numbers, cell references or ranges.read more to the remaining rows and columnsA cell is the intersection of rows and columns. Rows and columns make the software that is called excel. The area of excel worksheet is divided into rows and columns and at any point in time, if we want to refer a particular location of this area, we need to refer a cell.read more. There are 27 respondents with medium salary and 51 respondents who rated the service quality as “good.”
We apply the formula “(r-1)(c-1)” to calculate the degrees of freedom (df).
df=(3-1)(3-1)=2*2=4
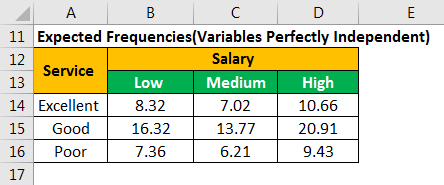
We apply the following formula to calculate the expected frequency for column B and row 4.
“(=B7*E4/B9)”
The calculation is shown in the following image.
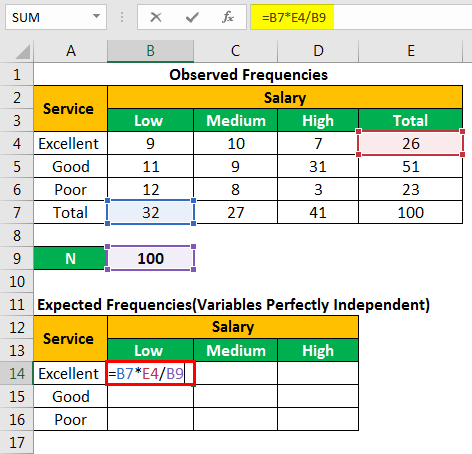
The expected number of customers who have “low” salary but rated the restaurant service as “excellent” is 8.32.
In the following calculations, E11 is the expected frequency of the first row and the first column. E12 is the expected frequency of the first row and the second column.
- E11=(26*32)/100=8.32, E12=7.02, E13=10.66
- E21=16.32, E22=13.77, E23=20.91
- E31=7.36, E32=6.21, E33=9.43
Similarly, we calculate the expected frequencies for the entire table, as shown in the succeeding image.
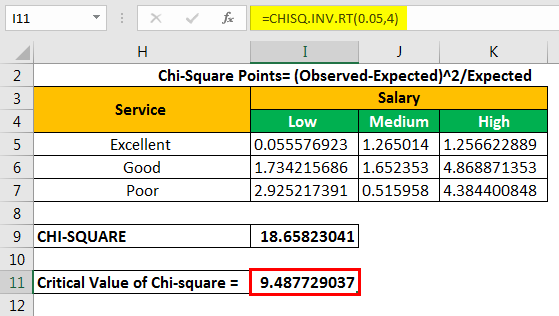
Let us calculate the chi-square data points by using the following formula.
Chi-square points=(observed-expected)^2/expected
We apply the formula “=(B4-B14)^2/B14” to calculate the first chi-square point.
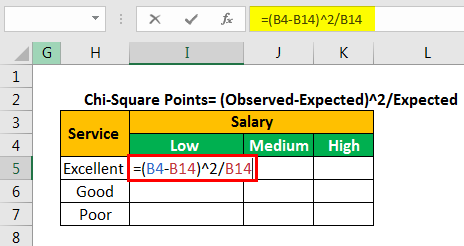
We copy and paste the formula to the remaining cells. This is done to fill values in the entire table, as shown in the following image.

Let us calculate the chi-square calculated value by adding all the values given in the succeeding table.
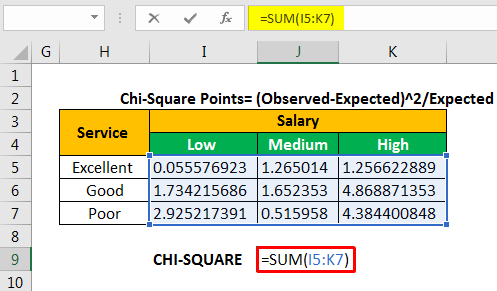
The chi-square calculated value is 18.65823.

To calculate the critical value, we use either the chi-square critical value table or the CHISQ formula. The formula “CHISQ.INV.RT” contains two parameters–the probability and the degrees of freedomDegrees of freedom (df) refers to the number of independent values (variable) in a data sample used to find the missing piece of information (fixed) without violating any constraints imposed in a dynamic system. These nominal values have the freedom to vary, making it easier for users to find the unknown or missing value in a dataset.read more.
The probability is 0.05, which is a significant value. The df is equal to 4.
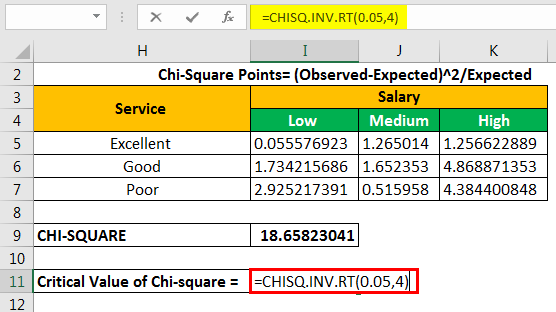
The chi-square critical value is 9.487729037.
Let us find the chi-square p-value with the help of the following formula.
“=CHITEST(actual_range,expected_range)”
We apply the formula “=CHITEST(B4:D6,B14:D16).”
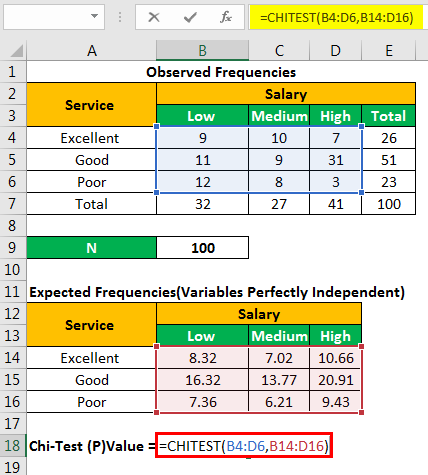
The chi-square p-value is= 0.00091723.
The chi-square calculated value is significant when equal to or more than the chi-square critical value (tabulated value). The null hypothesis (H0) is rejected if the chi-square calculated value is greater than the chi-square critical value.
Here x2 (calculated)>x2 (tabulated) or 18.65>9.48. Hence, we reject the null hypothesis and accept the alternative hypothesis.
The p-valueP-Value, or Probability Value, is the deciding factor on the null hypothesis for the probability of an assumed result to be true, being accepted or rejected, & acceptance of an alternative result in case of the assumed results rejection. read more can also determine whether the null hypothesis must be accepted or rejected. For this, the p-value is compared with alpha (α) in the following way:
- If p-value <= α, the null hypothesis is rejected.
- If p-value > α, the null hypothesis is accepted.
In this example, p-value<α or 0.0009172<0.05. So, we reject H0 and accept H1.
We conclude that the quality of service is dependent on the salary of customers waiting to be served.
Frequently Asked Questions
How should the chi-square test be interpreted?
The “x2” in the goodness of fit test determines how well the sample data matches the characteristics of the larger population. If the sample data does not match the expected properties of the population, this sample is not used for drawing conclusions related to the larger population.
The “x2” in the chi-square test for independence determines how likely the difference between actual and expected frequencies can be explained by random chance. This difference may or may not have been caused by a sampling error.
What is the p-value in a chi-square test?
The p-value, calculated in a chi-square test, represents an area in the tail of a probability distribution curve. A p-value is a number between zero and one. It is expressed in decimals.
For example, a p-value of 0.0254 implies a 2.54% probability that the results could have happened by chance. The smaller the p-value, the more important (significant) the results are. A significant result is one where the null hypothesis is rejected.
Which chi-square test should be used in Excel?
The chi-square statistic to be used depends on how the data has been collected and which hypothesis is being tested.
The goodness of fit test is used when there is one categorical variable. It is also used when there is a need to determine the consistency between the sample data and the hypothesized distribution.
On the other hand, the chi-square test for independence is used when there is a need to study the relationship between two categorical variables.
- The chi-square test is a non-parametric test that compares two or more variables from randomly selected data.
- The chi-square goodness of fit test helps determine whether the sample data matches the population or not.
- The chi-square test for independence helps determine whether the variables are independent of one another or not.
- Two random variables are said to be independent if the probability distribution of one variable is not affected by the other.
- The symbol of the chi-square test is “x2” (i.e., “x” raised to the power 2).
- If the chi-square calculated value is greater than the chi-square critical value, the null hypothesis (H0) is rejected.
- If the chi-square p-value is less than or equal to the significance level (α), the null hypothesis is rejected.
Recommended Articles
This has been a guide to Chi-Square Test in Excel. Here we learn how to perform the chi-square test along with step by step examples. Below are some useful Excel articles-
- Z Test in Excel
- Z Test vs. T-Test
- Formula of F-Test
- T-TEST in Excel
Chi-Square Test is a statistical function, which is used to compute the predicted value given a data set with observed values. In this tutorial, we’ll look at how to use Excel to calculate the Chi-Square from a database.
Let’s look at a few examples before getting into the details of the Chi-Square Test.
Also read: How to Calculate Age in Excel? – A Complete Beginner’s Guide
What Is Chi-Square?
The Chi-Square Test is a method for determining whether or not a hypothesis is valid. The Chi-Square P-Value indicates whether or not the observed results are statistically significant.
We reject the null hypothesis if the finding is statistically significant (the null hypothesis in statistics is a statement or hypothesis which is likely to be incorrect). A P-Value for Chi-Square is an integer between 0 and 1. The null hypothesis is usually rejected when the Chi-Square P-Value is less than 0.05.

Let’s look at some examples of how to do the Chi-Square Test in Excel.
Example 1
Aim: The Chi-Square test can determine whether the proportion of a certain number of items in one location is statistically independent of each other based on a random sample.
Let’s say your organization has a total of 10,000 pieces of furniture. About one-tenth of them are spread among four halls. As illustrated below, we can figure out what percentage of the entire furniture is in one hall:

Keep in mind that each hall has roughly 250 pieces of furniture. If we want to know the expected amount of furniture per type, we may use the following formula:
Expected Value = Category Column Total X (Category Row Total/Total Sample Size)
Using this calculation, we can estimate the number of chairs in Hall A to be around 92:
In Hall A, the expected number of chairs is 250 X (362/984).
We’ll use the following formula to see if there’s a difference:

((Observed Value-Expected Value)ⁿ)/expected value
In the Chi-Square test, n = 2 is used.
This gives us the number 0.713928183. Similarly, we will discover the values for each quantity, and the test statistic will be the sum of these values. If all of the variables are independent of one another, this statistic has a Chi-Squared distribution. For each quantity, the following formula would be used to determine the degree of freedom:
(number of rows – 1)(number of columns – 1)
Which is 6 in this scenario.
For the very first value, the number of chairs, we calculate the Chi-Square P-value. The null hypothesis is that the type of furniture has no bearing on where it is placed.
For the chairs, the Chi-Square P-value would be determined as follows:
If the null hypothesis is true, the sum of all Chi Square P values should be 1. We reject the null hypothesis if the test statistic is too great in the current dataset.
As the preceding example shows, computing Chi-Square and testing for the significance of hypothesized data in statistics is a time-consuming operation that necessitates extreme precision.
The CHISQ can be used to examine the scenario above.
TEST Function to directly obtain the Chi-Square value and determine whether or not our premise that the location of the furniture is independent of the type of furniture is valid. In this instance:

The value of the Chi-Square is roughly 0.03. We already know that this rejects the null hypothesis based on our previous discussion.
Example 2
The following steps must be followed in order to calculate the p-value in Excel:
Calculate the value you expect to receive. For properly distributed datasets, the predicted value in chi-square is usually a simple average or mean. Please see the example above for more intricate data.

- Enter your data into columns, then select a blank cell on the worksheet where you wish to display the results, and afterwards select the “Insert Function” option on the toolbar, which will bring up a pop-up window. In the Search for a Function box, type chi and then press “Go.” then click “OK” after selecting “CHITEST” from the list.

- Click “OK” after selecting the observed and expected ranges.

- As a result, we will have the following outcome.

Note: CHISQ functions can also be entered straight into a cell, just like every other function. If you already know the data ranges you’ll be working with, this will save you time.
Conclusion
That brings us to the end of this short article on Chi square. There’s a lot you can do by exploring this function in detail. As you uncover more opportunities to use this method, you can work out more valid use-cases for it in your work-life.