

Системная биология принимает и интегрирует многопрофильные подходы для понимания биологии человека. Быстрое развитие инструментов омики, включая геномику, транскриптомику, протеомику и метаболомику, наряду с биоинформатикой и информатикой, очень помогло нам в понимании биологических систем на молекулярном уровне, обеспечивая более глубокое понимание механизмов нашего понимания здоровья и болезней человека.
Технологии высокой пропускной способности сделали сбор данных намного проще, чем раньше. Однако анализ и интеграция больших данных становятся все более сложными. Возникает более фундаментальный вопрос: достаточно ли Microsoft Excel для анализа данных или необходимо ли изучение Python для получения более глубокого понимания данных? Чтобы ответить на этот вопрос, нам нужно расшифровать ситуации, когда использование Python превосходит Excel.
Здесь я рассмотрел 5 различных возможностей, чтобы обосновать, почему стоит рассмотреть возможность изучения Python для анализа больших наборов данных:
1. Python позволяет пользователям назначать обрабатываемые наборы данных в кодах или переменных, уменьшая необходимость в хранении нескольких файлов или электронных таблиц.
Большую часть данных необходимо будет предварительно обработать, прежде чем можно будет выполнить анализ данных. Примеры включают в себя вменение значений для отсутствующих данных, удаление строк или столбцов со слишком большим количеством отсутствующих данных и масштабирование данных, чтобы модели машинного обучения работали лучше.
Эти задачи можно легко выполнить в Microsoft Excel, если набор данных небольшой. Однако при анализе набора данных с размерами 20 переменных с 20000 генами (всего 400000 числовых значений) пользователям обычно приходится сохранять индивидуально обработанные файлы в разных таблицах и файлах Excel, чтобы уменьшить проблемы с запаздыванием.
В Python обработка этих больших наборов данных намного проще с помощью всего нескольких строк кода с использованием библиотеки pandas в Python.
2. Python более согласован и менее подвержен ошибкам по сравнению с Excel.
Использование файлов Excel для анализа небольших наборов данных удобно и, следовательно, обычно предпочтительнее. Однако с большими наборами данных функция перетаскивания не идеальна. Например, требуется много времени и усилий, чтобы перетащить ячейки, если у вас есть большое количество переменных. Функция перетаскивания также бесполезна, если в вашем наборе данных есть пустые ячейки.
Наконец, комбинирование функций «фильтрации» или «сортировки» с формулами в Excel обременительно, особенно для больших наборов данных. Однако в Python фильтрация, группировка, сортировка и управление таблицами могут быть легко выполнены в пандах.
3. Python более экономичен по времени и пространству при обработке больших наборов данных.
Максимальный предел Excel составляет 1 048 576 строк на 16 384 столбца, что означает, что вам придется хранить все свои гены с микрочипа или RNAseq в строках. Даже если вы сохранили все свои гены в строках, выполнение функций Excel в больших наборах данных может занять много времени (может занять несколько минут).
В некоторых сценариях из-за длительного времени обработки программа Excel может отключиться, что приведет к потере обновленного файла. Это означает, что вам придется регулярно сохранять файлы, и каждый раз, когда вы нажимаете «сохранить», это занимает несколько минут, а это означает, что вы тратите много времени на ожидание.
В Python коды автоматически сохраняются, а размеры DataFrame безграничны, что означает, что вы можете управлять файлами и переносить их в любое время, а обработка обычно завершается в течение нескольких секунд.
Также следует отметить, что все коды могут быть сохранены и опубликованы, что означает, что одни и те же коды можно использовать для сравнения с другим большим набором данных. Это экономит много времени и снижает потребность в управлении большим количеством файлов.
4. Поиск переменных в разных наборах данных в Python выполняется быстрее, чем в Excel.
В одном наборе данных Excel может выполнять несколько запросов генов с помощью функции ИНДЕКС. Однако для нескольких больших наборов данных это неэффективно. Сначала вам нужно будет открыть несколько электронных таблиц, а затем использовать функцию ИНДЕКС для запроса каждой таблицы. В целом, если у вас много таблиц, это может занять много времени.
В Python после назначения столбца (столбцов) индекса вы можете использовать функции iloc для выполнения конкретного запроса для каждого набора данных. Вы даже можете использовать функцию множественных запросов в Streamlit для выполнения функций запросов. Следовательно, запрос данных большого количества переменных в нескольких наборах данных обычно более эффективен с Python, чем с Excel.
5. Python может рисовать более интерактивные и сложные графики, чем Excel.
Поскольку все больше людей делятся своими кодами и разрабатывают пакеты, Python может строить более сложные графики, что важно для визуализации данных больших наборов данных. Например, Python может выполнять иерархическую кластеризацию и тепловые карты проще, чем Excel. Сложные функции, включающие неконтролируемую кластеризацию, такие как анализ главных компонентов, также легче выполнять в Python. Наконец, библиотеки Plotly и Altair в Python делают графики интерактивными, позволяя пользователям наводить курсор на точки данных для получения характеристик отдельных точек данных.
Другие причины дают Python конкурентное преимущество, в том числе простота реализации моделей машинного обучения, создания информационных панелей для клиентов и совместного использования рабочих процессов анализа данных. Я верю, что сначала нужно изучить основы, прежде чем углубляться в сложные модели и рамки. Хорошее место для начала — прочитать документацию по пандам. Другой веб-сайт с хорошей вводной частью также можно найти здесь.
Таким образом, мы можем сделать вывод, что Python лучше, чем Excel для анализа данных.
Надеюсь, это поможет вам сделать свой выбор. Спасибо за чтение!
In this tutorial, we’ll compare Excel and Python by looking at how to perform basic analysis tasks across both platforms.
Excel is the most commonly used data analysis software in the world. Why? It’s easy to get the hang of and fairly powerful once you master it. In contrast, Python’s reputation is that it’s more difficult to use, though what you can do with it is once you’ve learned it is almost unlimited.
But how do these two data analysis tools actually compare? Their reputations don’t really reflect reality. In this tutorial, we’ll take a look at some common data analysis tasks to demonstrate how accessible Python data analysis can be.
This tutorial assumes you have an intermediate-level knowledge of Excel, including using formulas and pivot tables.
We’ll be using the Python library pandas, which is designed facilitate data analysis in Python, but you don’t need any Python or pandas knowledge for this tutorial.
Why Use Python vs Excel?
Before we start, you might be wondering why Python is even worth considering. Why couldn’t you just keep using Excel?
Even though Excel is great, there are some areas that make a programming language like Python better for certain types of data analysis. Here are some reasons from our post 9 Reasons Excel Users Should Consider Learning Programming:
- You can read and work with almost any kind of data.
- Automated and repetitive tasks are easier.
- Working with large data sets is much faster and easier.
- It’s easier for others to reproduce and audit your work.
- Finding and fixing errors is easier.
- Python is open source, so you can see what’s behind the libraries you use.
- Advanced statistics and machine learning capabilities.
- Advanced data visualization capabilities.
- Cross-platform stability — your analysis can be run on any computer.
To be clear, we don’t advocate leaving Excel behind — it’s a powerful tool with many uses! But as an Excel user, being able to also leverage the power of Python can save you hours of time and open up career advancement opportunities.
It’s worth remembering the two tools can work well in tandem, and you may find that some tasks are best left in Excel, while others would benefit from the power, flexibility, and transparency that’s offered by Python.
Importing Our Data
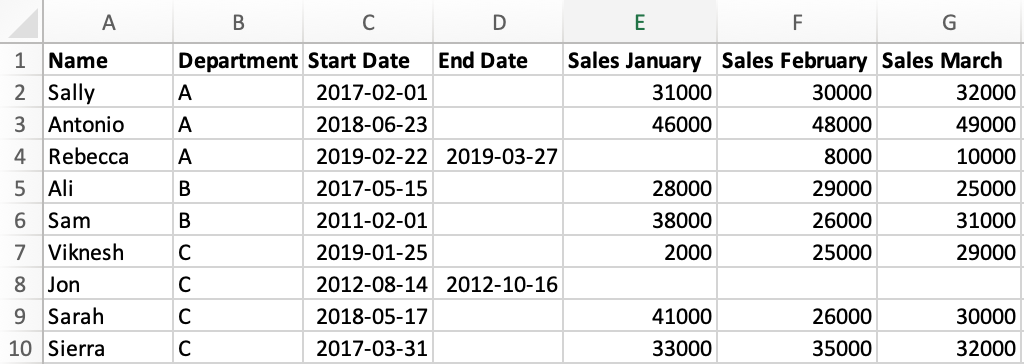
Let’s start by familiarizing ourselves with the data we’ll be working with for this tutorial. We’ll use fictional data about a company with salespeople. Here’s what our data looks like in Excel:
Our data is saved as a CSV file called sales.csv. In order to import our data in pandas, we need to start by importing the pandas library itself.
The code above imports pandas and aliases it to the syntax pd. That may sound complicated, but it’s actually just a kind of nickname — it means that in the future we can just use pd to refer to pandas so that we don’t have to type out the full word each time.
To read our file we use pd.read_csv():
We assigned the result of pd.read_csv() to a variable called sales, which we’ll use to refer to our data. We also put the variable name on its own in the last line of our code, which prints the data in a nicely formatted table.
Immediately, we can notice a few differences between how pandas represents the data vs what we saw in Excel:
- In pandas, the row numbers start at 0 versus 1 in Excel.
- The column names in pandas are taken from the data, versus Excel where columns are labelled using letters.
- Where there is a missing value in the original data, pandas has the placeholder
NaNwhich indicates that the value is missing, or null. - The sales data has a decimal point added to each value, because pandas stores numeric values that include null (
NaN) values as numeric type known as float (this doesn’t effect anything for us, but we just wanted to explain why this is).
Before we learn our first pandas operation, we’ll quickly learn a little about how our data is stored.
Let’s use the type() function to look at the type of our sales variable:
This output tells us that our sales variable is a DataFrame object, which is a specific type of object in pandas. Most of the time in pandas when we want to modify a dataframe, we’ll use special syntax called a dataframe method, which allows us to access specific functionality that relates to the dataframe objects. We’ll see an example of that in a moment when we complete our first task in pandas!
Sorting Data
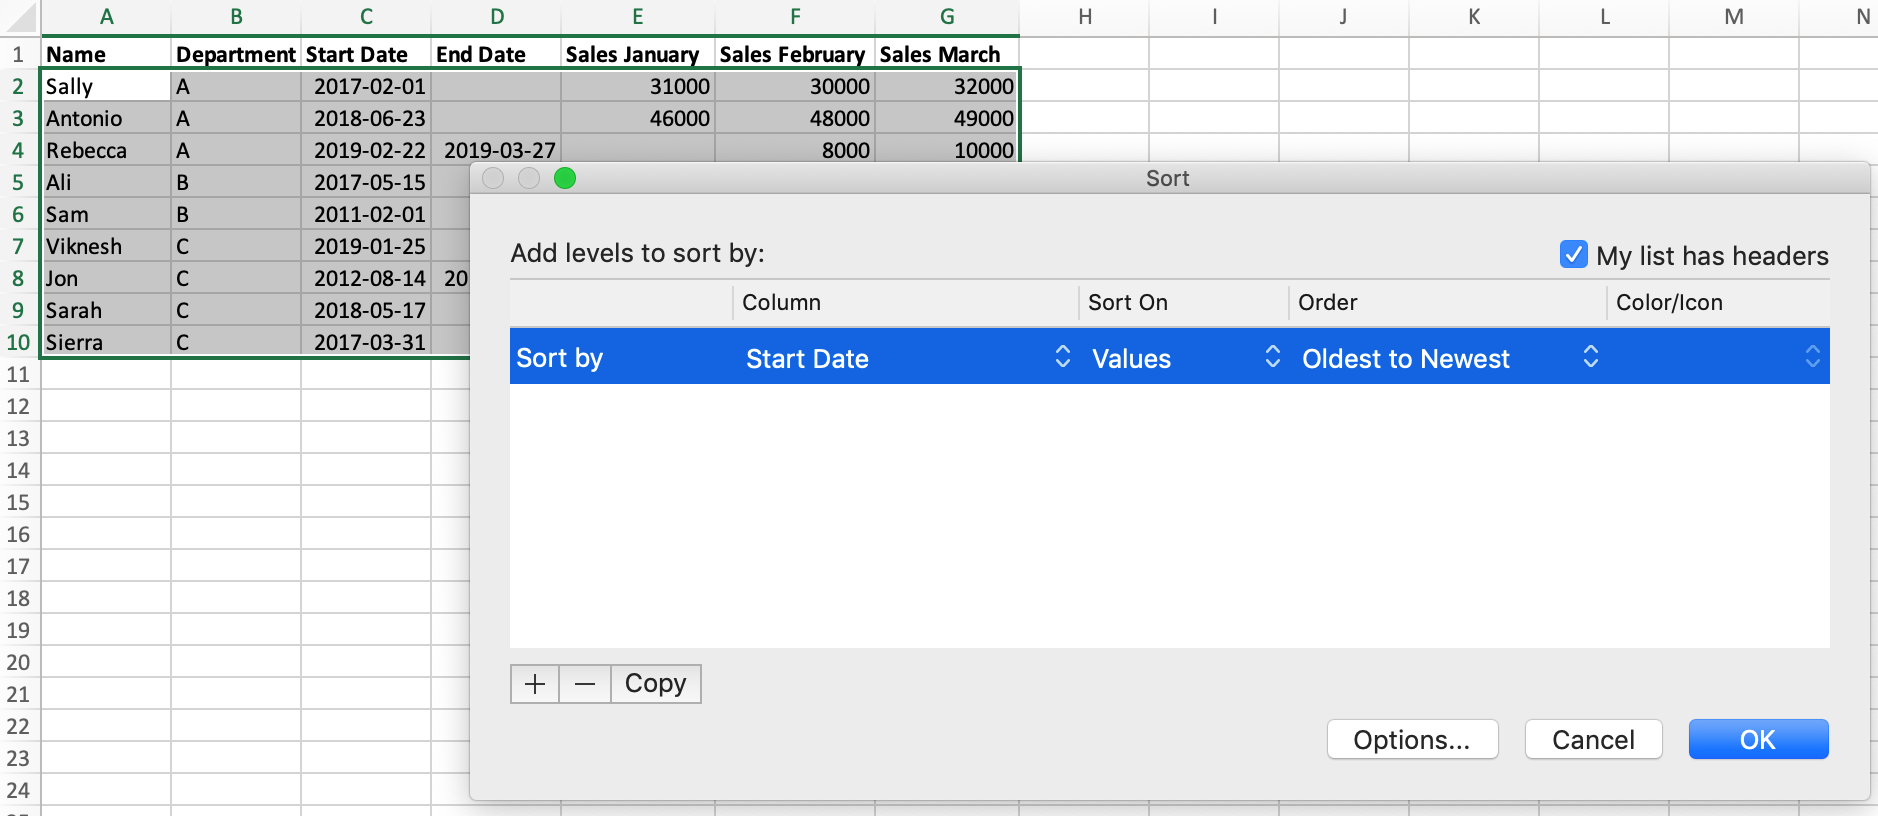
Let’s learn how to sort our data in Excel and Python. Currently, our data isn’t sorted. In Excel, if we wanted to sort our data by the "Start Date" column, we would:
- Select our data.
- Click the ‘Sort’ button on the toolbar.
- Select ‘Start Date’ in the dialog box that opens.
In pandas, we use the DataFrame.sort_values() method. We mentioned methods briefly a moment ago. In order to use them we have to replace DataFrame with the name of the dataframe we want to apply the method to — in this case sales. If you’ve worked with lists in Python, you will be familiar with this pattern from the list.append() method.
We provide the column name to the method to tell it which column to sort by:
The values in our dataframe have been sorted with one simple line of pandas code!
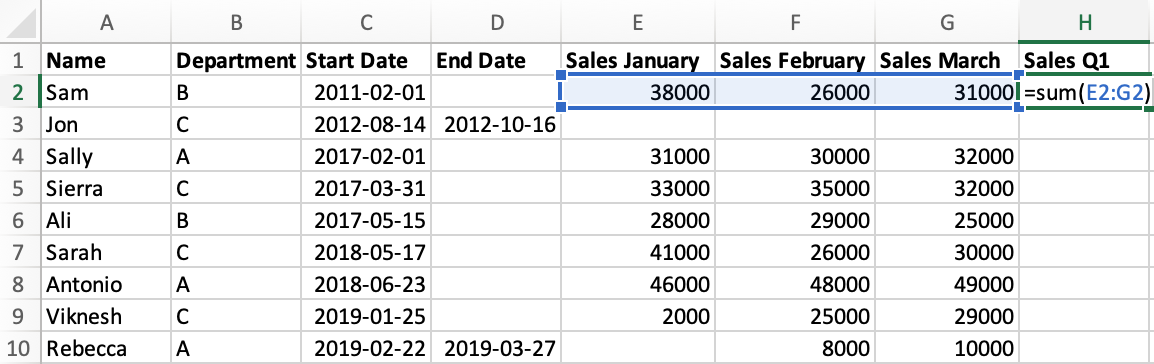
Summing the Sales Values
The last three columns of our data contain sales values for the first three months of the year, known as the first quarter. Our next task will be to sum those values in both Excel and Python.
Let’s start by looking at how we achieve this in Excel:
- Enter a new column name
"Sales Q1"in cellH1. - In cell H2, use the
SUM()formula and specify the range of cells using their coordinates. - Drag the formula down to all rows.
In pandas, when we perform an operation it automatically applies it to every row at once. We’ll start by selecting the three column by using their names in a list:
Next, we’ll use the DataFrame.sum() method and specify axis=1, which tells pandas that we want to sum the rows and not the columns. We’ll specify the new column name by providing it inside brackets:
In pandas, the «formula» we used isn’t stored. Instead the resulting values are added directly to our dataframe. If we wanted to make an adjustment to the values in our new column, we’d need to write new code to do it.
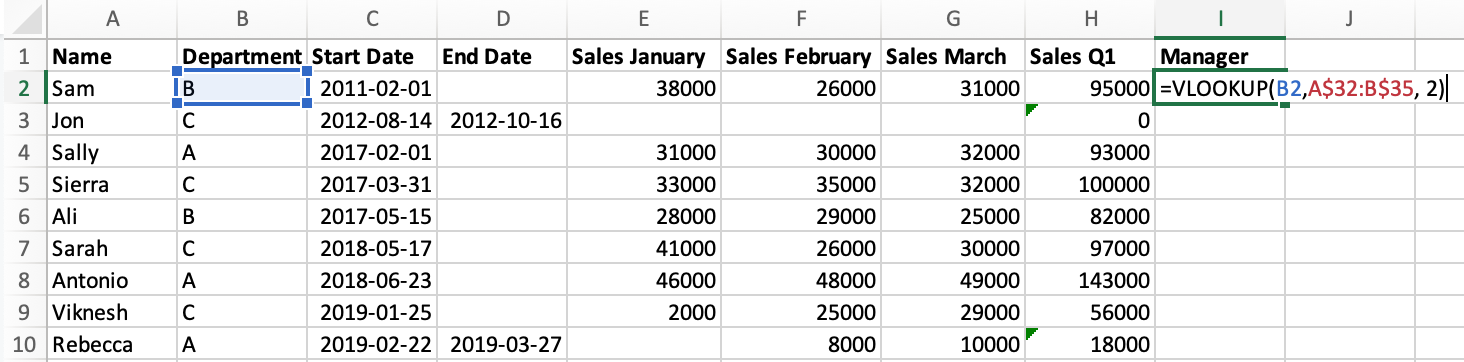
Joining Manager Data
In our spreadsheet, we also have a small table of data on who manages each team:
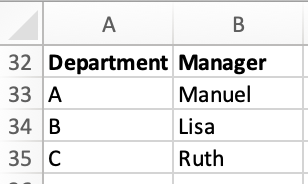
Let’s look at how to join this data in a "Manager" column in Excel and Python. In Excel, we:
- start by adding the column name to cell
I1. - use the
VLOOKUP()formula in cellI2, specifying:- to lookup the value from cell
B2(the Department) - in the selection of manager data, which we specify using coordinates
- and that we want to select the value from the second column of that data.
- to lookup the value from cell
- Click and drag the formula down to all cells.
To work with this data in pandas, first we’ll need to import it from a second CSV, managers.csv:
In order to join mangers data to sales using pandas, we’ll use the pandas.merge() function. We provide the following arguments, in order:
sales: the name of the first, or left, dataframe we want to mergemanagers: the name of the second, or right, dataframe we want to mergehow='left': the method we want to use to join the data. Theleftjoin specifies that no matter what, we want to keep all the rows from our left (first) dataframe.on='Department': The name of the column in both dataframes that we will join on.
If this seems is a bit confusing at first, that’s OK. The model for joining data in Python is different to what is used in Excel, but it’s also a lot more powerful. Note that in Python we get to specify exactly how we join our data using clear syntax and column names.
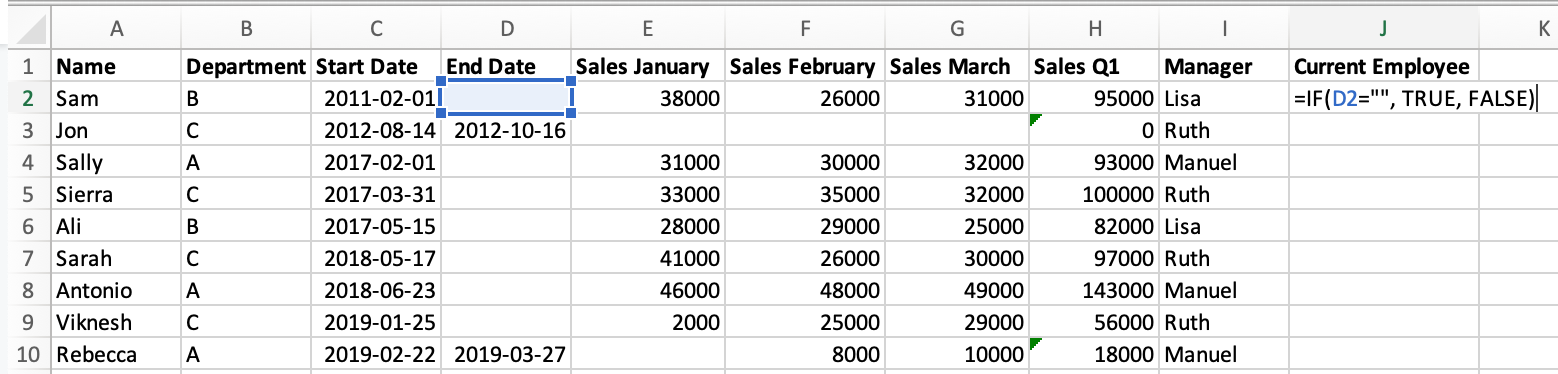
Adding a Conditional Column
If we look at the "End Date" column, we can see that not all employees are still with the company — those with a missing value are still employed but the rest have left. Our next task will be to create a column which tells us if each salesperson is a current employee. We’ll perform this in Excel and Python.
Starting with Excel, to add this column we:
- Add a new column name to cell
J1. - Use the
IF()formula to check if cellD1(End Date) is empty, and if so fillJ2withTRUE, otherwiseFALSE. - Drag the formula down to the cells below.
In pandas, we use the pandas.isnull() function to check for null values in the "End Date" column, and assign the result to a new column:
Pivot Tables
One of the most powerful Excel features is pivot tables, which facilitate data analysis using aggregation. We’re going to look at two different pivot table applications in Excel and Python.
We’ll start with a pivot table in Excel that counts the number of employees in each department:
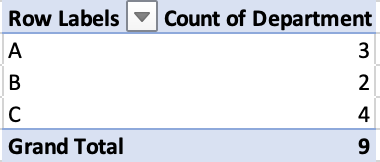
This operation — counting the number of times a value occurs in a column — is so common that in pandas it has its own syntax: Series.value_counts().
The series type is new to this tutorial, but it’s quite similar to a DataFrame, which we’ve already learned about. Series is just the pandas representation of a single row or column.
Let’s use the pandas method to calculate the number of employees in each department:
The second pivot table example also aggregates by department, but instead calculates the average Q1 sales:
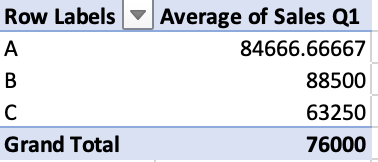
In order to calculate this in pandas, we’ll use the DataFrame.pivot_table() method. We need to specify some arguments:
index: the column to aggregate by.values: the column we want to use the values for.aggfunc: the aggregation function we want to use, in this case'mean'average.
Excel vs Python: Summary
In this tutorial we learned Python equivalents for the following Excel functionality:
- Sorting data
SUM()VLOOKUP()IF()- Pivot Tables
For each example we looked at, the pandas syntax was of similar complexity to the formulas or menu options you would use in Excel. But Python offers some advantages, like much faster processing of large data sets, more customization and complexity, and more transparency for error-checking and auditing (since everything you’ve done is clearly laid out in code, rather than hidden in cells).
Someone proficient in Excel is more than capable of making the leap to working in Python. Adding Python skills to your skill set will make you a faster and more powerful analyst in the long run, and you’ll discover new workflows that take advantage of both Excel and Python for more efficient and powerful data analysis than you could do with Excel alone.
If you’d like to learn how to analyze data in Python, our Data Analyst in Python path is design to teach you everything you need to know, even if you’ve never coded before. You’ll start with two courses that teach you the Python fundamentals before you move onto learn the pandas library that we’ve worked with in this tutorial.
Время на прочтение
5 мин
Количество просмотров 38K
Поводом для заметки послужила статья на Хабре, в которой автор описывал, как он решал на Python задачу сбора и анализа метаданных из файлов Excel.
Эта заметка более подробно раскрывает всем известный тезис: Под конкретную задачу надо выбирать наиболее подходящий инструмент применимо к офисной автоматизации.
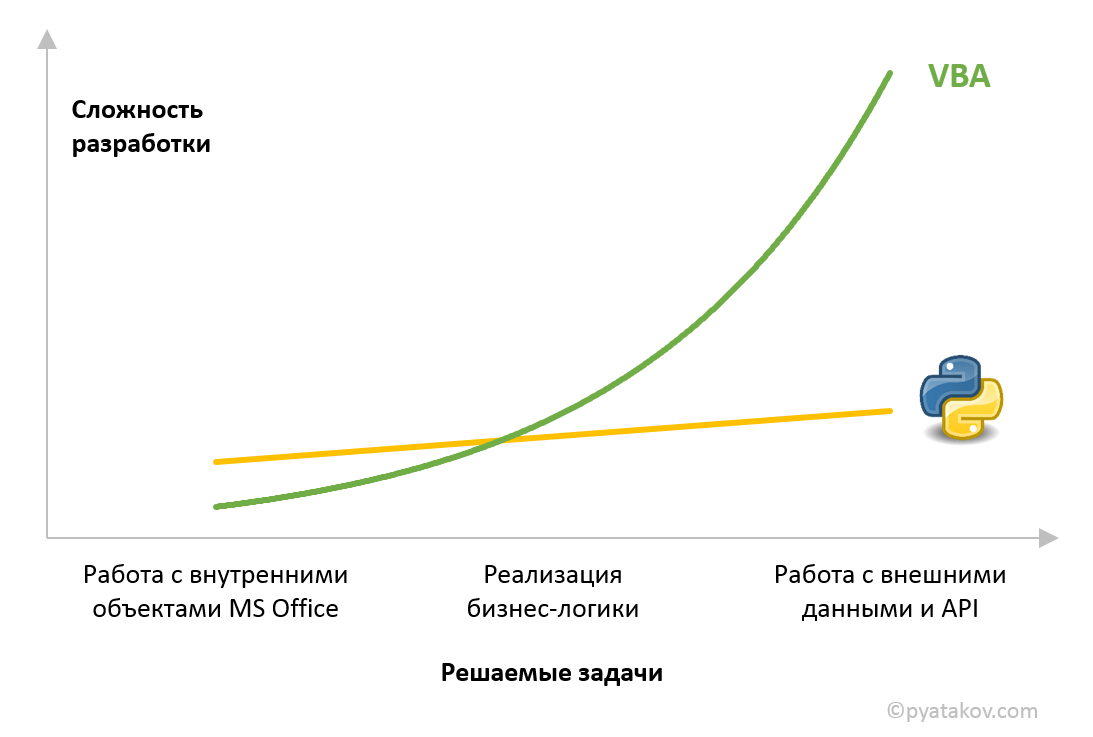
VBA и Python
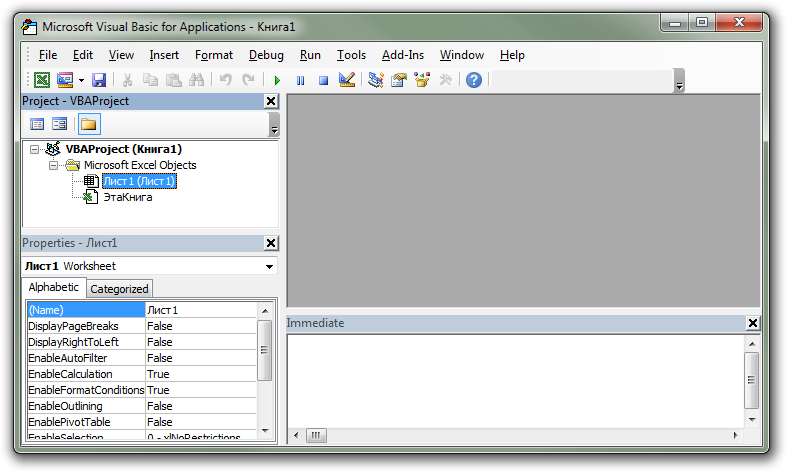
VBA (Visual Basic for Applications), де-факто, самый популярный язык для автоматизации Microsoft Office. Доступен из коробки, помимо Excel, работает в PowerPoint, Outlook, Access, Project и других приложениях.
Если задать вопрос: «Какой язык программирования выбрать первым», то где-то в 90% всех случаев будет предложен Python. На практике здесь может быть и любой другой язык, но, исходя из популярности языка и своего опыта, буду сравнивать с ним.
В общем виде можно описать ситуацию через подобный график:
Детального сравнения не будет, рассмотрим основные killer-фичи, в ситуации, когда junior-программист/офисный сотрудник хочет автоматизировать что-либо, связанное с MS Office, и у него есть возможность выбора между языками.
Если в силу разных причин возможности выбора нет, то и сравнивать нечего.
В пользу VBA
- Отличная работа с объектной моделью Excel и других приложений MS Office. Написание кода на VBA для большинства внутренних операций тривиально. У Python, в сравнении с VBA, поддержка объектной модели Office очень слабая.
- Поддержка разных форматов MS Office. Самая большая проблема для внешних языков — это работа с разными форматами файлов MS Office. Например, xls, xlsx, xlsm файлы могут требовать разных библиотек, так как каждая хорошо работает только со своим форматом файла. Для VBA — это все «файл Excel», работа с которыми в целом одинаково хороша.
- Работа с MS Exchange. Если необходимо обеспечить работу с корпоративной почтой/календарем на Exchange, то далеко не каждом языке есть нормальная библиотека для работы протоколом Exchange. В VBA это решается относительно просто через использование в макросе объектной модели MS Outlook.
- Легкая установка и дистрибуция. К уже установленному офису не надо ничего устанавливать. Чтобы коллега мог воспользоваться программой, достаточно передать ему файл с макросом. Легко сделать надстройку, которая позволит «установить» модель макроса в фон офиса.
- Интерактивность внутри приложений MS Office. Внутри офисных программ можно как просто поставить кнопки запуска макросов, так и (чуть сложнее) сделать целый отдельный UI. Сюда же относится написание своих формул в Excel и то, что макросы могут воздействовать на объекты внутри документов Office в реальном времени.
- Запись макросов. Удобный инструмент, который позволяет записать действия человека в готовый код, для последующего редактирования использования.
В пользу Python (и других внешних языков программирования)
- Приятный синтаксис и синтаксический сахар. Если коротко, то VBA не отличается выразительностью и удобством. Это вопрос личного вкуса, но для меня Python намного удобнее.
- Богатая экосистема библиотек. Огромный выбор готовых библиотек для работы с внешним миром. Пытаться сделать на VBA программу, взаимодействующую с каким-нибудь внешним API, та еще боль. Занимательно, что как раз для работы с файлами Office библиотеки того же Python — откровенно «на троечку».
- Хорошие средства разработки. Можно выбрать из огромного выбор программ, которые облегчают процесс разработки. Стандартный редактор VBA из Office предлагает очень бедный функционал и, в сравнении с альтернативами из мира Python, откровенно неудобен. Писать код VBA в внешнем редакторе, а потом копировать внутрь офиса для отладки — тоже неудобно.
- Скорость работы. Не проверял скорость однопоточной работы, но, предположу, что в случае однопоточной работы преимущество будет за Python. В любом случае, достаточно тривиально организуется многопоточная обработка данных/файлов, что позволяет говорить в большей достижимой скорости.
Кейсы

Далее приведены конкретные задачи, которые я сам решал или автоматизировал, и когда мне надо было выбрать стек: VBA или Python. Для каждой задачи указан выбранный стек и даны пояснения почему:
- Задача: Программа для проверки всех файлов Excel в директории на предмет наличия скрытых листов
- Мой выбор: VBA. Причины: простота работы с разными форматами файлов Excel и отсутствие внешних взаимодействий.
- Задача: Сервис, который должен был позволить пользователю с мобильного устройства конвертировать файлы PowerPoint в PDF для просмотра
- Сервис был реализован как почтовый бот, на адрес которого пользователь может переслать файлы Office, а в ответ пользователю по почте приходит ответ с файлами PDF.
- Мой выбор: Логика VBA + Python для мониторинга
- Во-первых, внутренние функции гарантированно сохраняли PDF, аутентичный файлу PowerPoint (внешние библиотеки плохо справляются с рендером PowerPoint).
- Во-вторых, реализация почтового бота, как макроса в MS Outlook решала проблемы работы с корпоративной Exchange почтой. Так, в Python нет нормальной библиотеки для работы с MS Exchange.
- Python использовался для организации мониторинга работы сервиса и нотификации о возможных проблемах
- Задача: Программа для объединения файлов Powerpoint с «подстрочником» (текстом для докладчика) в файл для печати
- Мой выбор: VBA. Задача решалась через конвертацию двух файлов в PDF и их объединением с Riffle Shuffle. Так как важно качество конвертации в PDF, то использовались встроенные функции офиса для экспорта в PDF.
- Задача: Дана база данных по предприятиям отрасли в виде карточек-отдельных файлов html, которые надо отфильтровать и объединить в 1 файл Excel для расчета ряда показателей.
- Мой выбор: Python.
- Чтобы вытаскивать из html карточек данные пригодилась библиотека для парсинга html BeautifulSoup.
- Excel-файл создает программа, поэтому мы сами можем решать, какую аналитику рассчитывать уже в нем, а какую еще на стадии подготовки данных в Python.
- Мой выбор: Python.
- Задача: Перевести весь текст в презентации PowerPoint на другой язык машинным переводчиком
- Мой выбор: VBA. Важно было аккуратно работать с текстом во внутренних объектах файла PowerPoint. Для перевода использовался API от Яндекса, так как он бесплатен для небольших объемов и прост в подклюении. Например, API переводчика Bing я так и не смог заставить работать в VBA, так как там для работы нужен OAuth со своими заморочками. Если бы пришлось работать с Bing, то, наверное, я бы делал сервис-посредник на Python.
- Задача: По заданным биржевым тикерам брать данные из API с финансовыми показателями (API выдает сформированный по запросу CSV файл) и считать на их основе ряд бенчмарков для анализа
- Мой выбор: Python. Хотя API — простой (не требует какой-либо подписи запросов или авторизации) и выдает данные в CSV, выбран Python, так как нет причин выбирать VBA, а на Python писать удобнее.
- Задача: Ведение базы поручений, рассылка уведомлений исполнителям, генерация отчета для печати
- Здесь я выбирал очень долго, так как есть много альтернатив:
- Сторонняя готовая система поручений
- База данных с каким-то обработчиком
- Access
- Excel
- Мой выбор: VBA
- Во-первых, Excel сам по себе является готовым UI для работы
- Во-вторых, VBA решает задачу работы с корпоративным Exchange через подключение MS Outlook
- В-третьих, это решение делалось с прицелом на коллег, которым Excel был более понятен, чем что-либо совсем новое
- Здесь я выбирал очень долго, так как есть много альтернатив:
Заключение
Надеюсь, для кого-то заметка будет полезна и позволит сэкономить время на выборе стека для решения своих задач.
После запуска нового курса «Python для анализа данных» нам стали часто задавать вопрос: «Зачем вообще нужен Python, если есть Excel?».
Содержание:
- Автоматизация и масштаб
- Воспроизводимость
- Бесконечные возможности
- Широкие возможности
- Легкость обучения Python
- Итоги
Excel является самым популярным программным обеспечением для баз данных, хотя сегодня доступно множество альтернативных и более эффективных решений. Пять лет назад у Excel было более 750 миллионов пользователей. Население Земли на тот момент — примерно 7,6 миллиарда человека. Таким образом, около 10% людей пользовались Excel, можно предположить, что основная задача — анализ данных.
Excel являлся востребованным инструментом для многих компаний, его используют ученые и аналитики данных, однако для большей части их работы есть более эффективный софт — Python. И я вам это докажу.
Если вы еще не начали изучать Python и не вывели свои скилы по визуализации и анализу данных на новый уровень, я расскажу вам о пяти причинах, по которым вам необходимо начать изучать его прямо сейчас. Не сомневаюсь, что к концу статьи вы точно захотите перенести большую часть своей работы из Excel в Python.
Автоматизация и масштаб
В вопросе автоматизации Python становится действительно удивительным языком программирования. Вы сможете решить следующие задачи:
- подключить Python к любому источнику данных;
- составлять отчеты;
- запланировать задание, повторно извлекающее ваши данные с любыми обновлениями;
- выполнять необходимые расчеты;
- создавать динамическую панель мониторинга.
Python поможет вам сэкономить массу времени. Excel, напротив, требует слишком большого количества ручного труда, а также в нем не доступны автоматические обновления [комментарий HOCK Training: возможно, здесь речь идет о сложности обновлений данных стандартными инструментами Excel. Периодические обновления в Excel легко можно выполнять при помощи VBA (макросами)].

Python способен напрямую подключаться к вашей базе данных для проведения автоматических обновлений. Изображение: NobleDesktop.
Excel подходит для выполнения быстрого специального анализа небольших данных, однако, когда вы решите перейти к более крупному масштабу, он не будет работать. Общее количество строк на странице Excel — до 1 048 576, столбцов — до 16 384. Python же масштабируется до любых размеров и ограничен только памятью вашего устройства, а также для него доступно множество инструментов, которые поддерживают вычисления за ее пределами.
Пример — библиотека Dask. Она позволяет масштабировать вычисления не только на ПК, но и для запуска на кластере. Для тех, кто знаком с Pandas, это похожий код для чтения в CSV:

Это только строчка кода, однако благодаря ней вы сможете читать данные, чей объем намного больше объема памяти вашего компьютера. Я бы с удовольствием показал, как сделать то же самое в Excel, если бы это было возможно.
Если этот код показался вам сложным, начните учиться с помощью нашего курса. В нем есть все необходимое для начала работы с Python.
Python также масштабируется для нескольких источников данных. Excel — это хранилище и в то же время — механизм вычислений. Python же абсолютно не зависит от данных. Если вы нашли метод чтения имеющихся данных в Python, это значит, что вы сможете работать с ними. В Python есть множество библиотек, поэтому процесс считывания данных из целого ряда источников (например — базы данных CSV, Excel, JSON и SQL) является обычным.
Воспроизводимость
Воспроизводимость является концепцией, согласно которой любые созданные вами аналитические данные и визуализации могут быть без проблем воспроизведены кем-нибудь еще. Важны обе составляющие процесса:
Конечный результат. Кто-то другой должен суметь повторно запустить ваш процесс, чтобы получить такой же результат.
Путь достижения цели. Кто-то другой должен суметь пройти через ваши шаги. Только так можно обеспечить точность результата.
Важность этой концепции обусловлена тем, что она позволяет полагаться на автоматические процессы. Автоматизация полезна, когда работает правильно. Если же она неверна, автоматические отчеты могут стать настоящим кошмаром.
В Excel воспроизводимость крайне сложна. Результаты вычислений в ячейках практически не поддаются проверке при любом масштабировании. Типы данных очень запутаны. Картина, которую видит пользователь, часто не соответствует необработанным данным. VBA лишь делает воспроизводимость чуть лучше, поэтому вам гораздо выгоднее инвестировать в освоение Python.
Давайте обратимся к этому Excel-документу:

Нам известно, что столбец Sum — это сумма значений из колонок a и b, как нам подтвердить это? Можно проверить любую формулу, чтобы убедиться, что перед нами действительно сумма. Однако каждая ячейка может содержать отдельную формулу, что будет, если все они неверны? Если бы я не обратил ваше внимание на шестую строку, вы бы заметили что в ней другая формула?
Но в Python ваша сумма будет выглядеть так:

Простой и понятный код с легкостью подтверждает, что сумма всегда будет рассчитываться верно.
Python открывает доступ ко всем инструментам, необходимым для улучшения воспроизводимости и совместной работы разработчиков программного обеспечения. Python позволяет анализировать данные в облаке, мгновенно повторяя процесс, поэтому он лучше всего подходит для подключения к данным.
В сообществе Python широко распространены:
- Git;
- документация и стандарты форматирования кода;
- модульное тестирование.
В Python 3 есть функция статической типизации, облегчающая чтение кода. Такие инструменты упрощают правильное написание кода. Если в дальнейшем его будет использовать кто-то другой, ему будет легко воспроизвести и понять каждую строку.
Бесконечные возможности
Если пользователь умеет работать в Excel, эти навыки полезны, но больше их нигде нельзя применить. Пожалуй, в этом заключается существенное отличие и главный плюс Python. Это удобный инструмент для анализа и визуализации данных, он также является надежным языком программирования, подходящим для других целей.
Python поможет вам:
- заняться машинным или глубоким обучением;
- создать сайт;
- настроить автоматизацию системы умного дома и многое другое.
Python больше похож на другие языки программирования, с которыми вы можете столкнуться, чем Excel. Это значительно упрощает их изучение. Python более перспективен, чем Excel.
Спрос на специалистов, владеющих Python, очень высок. Согласно StackOverflow, в 2019 году этот язык программирования — четвертый по уровню популярности в мире среди разработчиков ПО. По информации Indeed от 2020 года, в США средняя годовая заработная плата разработчиков Python — 120 000 долларов.
Широкие возможности
Одно из преимуществ Excel — большое число встроенных формул, но возможности Python намного шире. В Python доступно множество библиотек, которые значительно упрощают расширенную статистику и аналитику. Визуализация выведена на новый уровень. При помощи Matplotlib, Seaborn, Plotly, Streamlit можно создавать:
- интерактивные информационные панели;
- необычные визуализации данных;
- графики.
Scikit-learn помогает обучать алгоритмы машинного обучения: машины повышения градиента, деоевья решений и т. д. Scipy и Numpy полезны для векторных и научных вычислений, а также для линейной алгебры. Xkcd отлично выразил мои мысли:

У Python при сравнении с Excel намного больше возможностей, но значит ли это, что его трудно освоить? К счастью, нет! Это Java-версия Hello World самой простой программы:

Python — это буквально одна строка: print(“Hello World!”). Что может быть проще? Python входит в группу самых простых языков программирования. Также у него одно из самых активных сообществ, особенно — в сфере аналитики данных.
Язык программирования Python можно понять интуитивно. Его легко освоит даже человек с минимальным опытом работы в области программирования. Кому-то кривая обучения Excel, возможно, кажется более предпочтительной, но от нее намного меньше отдачи. Обучение Python стоит затраченного времени и приложенных усилий, а его универсальный дизайн оставляет Excel далеко позади.
Простой в использовании, Python имеет большое сообщество поддержки. Обучение никогда не было более простым.
Итоги
Время перейти на Python настало. Хватит придумывать оправдания! Я надеюсь, что в статье мне удалось показать вам плюсы изучения Python и помочь обойти некоторые препятствия на пути к обучению.
Учитесь и развивайте свои навыки владения Python!
Оригинал статьи:
https://towardsdatascience.com/stop-using-excel-for-data-analytics-upgrade-to-python

Excel has been a firm favourite for working professionals for many years and for good reason. Its wide capabilities and ease of use have made it critical in all manners of business, education, finance and research.
Enter Python. This programming language has gained traction over recent years. One report states that the demand for Python skills, as a requisite in job postings, has increased by 27.6 percent in the last year and shows no signs of slowing down. Initially built as a way to write scripts that ‘automate the boring stuff’, Python has become a leader in web development, data analysis and infrastructure management.
Demand for Excel
Microsoft Excel skills are still in high demand. After 34 years in this fast-changing tech world, the spreadsheet software is still going strong. The seasoned data analysis tool is still used often in the financial sector to organise and present large amounts of data. Excel has been developed and updated recently, which means it boasts more user-friendly features and more effective functionalities for all businesses.
According to Microsoft, there are 1.2 billion people that own Excel, of which 800 million people currently use it. In comparison, it’s been estimated that the number of people that use Python is around 8.2 million people. The odds are if someone you work with sends you a report, it will be in Excel, so it’s useful to know how to use it.
The limitations of Excel
However, consultants and IT experts have voiced their concerns over how fragile the spreadsheet software can be. Excel is working to overcome challenges such as:
- Data Volume: Companies, small and large, have most likely used Excel at some point in their development. However, as organisations continue to generate data, they find themselves dealing with an increasing number of spreadsheets, resulting in complex analytical issues.
- Syntax Errors: Excel has been considered notorious when copying and pasting data in specific cell ranges. This can create lots of errors when inputting formulas manually.
- Security Risks: Companies have to be cautious about the kind of information that is stored in Excel sheets, in case of misuse and cyber attacks. Excel has some security policies that need to be addressed.
Python says, (“Hello, World!”).
First released in 1991, Python has become one of the most ubiquitous programming languages out there. Although Python and Excel technically have different functionalities, Python has developed a strong following as people have realised its capabilities and potential. It’s been deemed a better data analysis tool by many developers and the wider data science community.
While Python needs basic programming skills, it has been looked upon as a prerequisite for many quantitative roles. Companies are looking to hire new candidates with at least beginner-level proficiency in Python.
Its avid practitioners, known as Pythonistas, have uploaded 145,000 custom-built software packages to an online repository. These cover everything from game development, to astronomy and can be installed and inserted into a Python program in a matter of seconds. This versatility explains why the Central Intelligence Agency has used it for hacking, Google for crawling web pages, Pixar for producing movies and Spotify for recommending songs. Some of the most popular packages harness “machine learning”, by crunching large quantities of data to pick out patterns that would otherwise be imperceptible.
How popular is Python?
According to the ‘Popularity of Programming Language’ index, Python is the world’s most popular computing language. It’s grown 11.4 percent in the last five years. With a popularity share of 28 percent, Python beats its closest competitor, Java, by 10 percent. Whilst these numbers might not be an accurate metric to measure value, consider that Uber, PayPal, Google, Facebook, Instagram, Netflix, Dropbox and Reddit all use Python in their development and testing. Moreover, Python is also used extensively in robotics and embedded systems.
In 2012, Stack Overflow, the largest and most trusted online community for developers, saw questions relating to Python account for less than 4 percent. According to Stack Overflow’s latest Developer Survey, Python is now the 3rd most popular language amongst the 80,000 respondents of the survey.
Higher incomes for jobs with Python skills
Not only can learning Python increase your productivity, it can also grow your personal income. According to IT jobs website CWJobs, the average salary in the UK for jobs requiring Python skills is £67,500 compared to just £37,500 for jobs requiring Excel skills. Aside from growing your salary by learning Python, it’s also a great way to future-proof your career by keeping your skillset up-to-date and relevant.

Who can benefit from learning Python?
Python is such a diverse tool that can be used in multiple applications in plenty of jobs. Some of the most interesting things that you can do with Python are:
- Automate the boring stuff: Updating spreadsheets, renaming files, gathering and formatting data, checking spelling, automating Excel reports using Python, fixing grammar mistakes and compiling reports. These are just a few examples.
- Build a Bitcoin notification service to see when might be a good time to purchase the highly talked about cryptocurrency. If Ethereum is more your thing, the code can be replicated for other currencies.
- Mine data from Twitter to build a sentiment analysis tool. This project would lead nicely into learning more about text processing and speech recognition.
- Build a Blockchain to use for almost any financial transaction.
Learn and apply Python skills at work with one of our government-funded apprenticeships. Find out more here.
Jobs that Python can benefit:
Account managers, accountants and anyone working with large datasets can benefit from learning and using Python. Programming knowledge will allow you to extract and manipulate data from multiple reports to then filter and detect any inconsistencies in the data on a very large scale, which would take you a long time if using Excel.
Data analysts can benefit from learning Python, as the majority of their work involves trawling through data, and Python can help automate that process, saving time and effort. As Zhivitov, Data Analyst at TransferWise, says: «with Python, you can do so much more because of its general-purpose. It gives you the freedom to build tools for yourself, and you can easily cover the entire pipeline of data analytics work from start to finish.»
👉RELATED READING: 
Good news if you work in marketing: Python can help you too. It can help by automating data collection (SEO indexation, email and SMS responses and trend information), automate SEO processes, monitor campaigns more effectively and automate customised error checks. The jobs you would generally go to Excel for, you can automate by writing simple Python code.
Journalism: Python is particularly relevant within journalism that uses data to tell stories. Those who know Python are in demand, as they can rapidly sort through information, making them much more efficient when it comes to writing to meet deadlines. Learn about Cambridge Spark’s Data-Driven Journalism Programme.
👉RELATED READING: 

What makes Python a better option than Excel?
There are many things that Excel can do. And it’s a great tool for basic data analysis. But Python allows you to do more in terms of analysis. Here are a few reasons:
Python for data analysis
Python can handle much larger volumes of data, and therefore, more analysis. It also forms a basic requirement for most data science teams. It can easily replace mundane tasks with automation. Python also offers greater efficiency and scalability. It’s faster than Excel for data pipelines, automation and calculating complex equations and algorithms.
Python is free!
Although no programming language costs money to use, Python is free in another sense: it’s open-source. This means the code can be inspected and modified by anyone. Python is a progressive language that is constantly being developed, collaboratively, by a group of volunteers. Whereas Microsoft Excel costs around £150 to download for one license. The cost for businesses (dependant on the number of employees) could be in the thousands, and Excel is developed solely by Microsoft employees.
👉RELATED READING: 
Leveraging the latest research
Excel has a large user base that offers a wide variety of tips and tricks in an open forum. But the Python community does the same and more. With its strong ethos of collaboration, academics and data scientists often publish and share their code. This means that the latest techniques developed in Python are available for free to the community.
Python libraries
A Python library is a collection of functions and methods that allows you to perform many actions without writing your code from scratch. This makes a data analyst’s work more efficient because they don’t have to waste time writing new code. Instead, they can just import a library. Different libraries have different functionalities. For example, TensorFlow (developed by Google) is used for machine learning projects. And SciKit Learn is a library used when working with complex datasets.
Integrations
Python is referred to as a ‘glue’ language, which means that it’s particularly useful for connecting different scripts together and interacting with different systems, including different forms of databases (e.g. SQL and NoSQL databases), data formats (JSON, Parquet, etc.) and web services. The Python community also contributes to many packages that allow you to interact with a range of public APIs. This is often useful for data scientists given their need to read data from different places and process it.
Deep learning and machine learning
Python is the de facto language of machine learning. Researchers and academics are all using Python for deep learning to create predictive and simulative models that find new insights into their data. Most notably, Google’s TensorFlow works mostly with Python.
Python is widely supported
Python is backed by a large community of developers (8.2 million), and therefore, has a strong support system. There are many tutorials covering Python concepts all over the web. Even Python programming experts can find guidance, if necessary, when working on complex problems. As mentioned earlier, Excel does have many more people using the software, and it’s well supported online in tutorials and guides.
Python is not only supported online but offline, too, at conferences, meetups, hackathons and events around the world. For example, PyCon is an international set of conferences, held at multiple locations around the world. Organisers aim to unite developers and data science enthusiasts to discuss and promote the Python programming language.
Another leading conference is PyData, which focuses on the community of users and developers of data analysis tools to share and learn together with chapters in cities all over the world.
In the business world, Python proficiency has been on the rise. Cambridge Spark CEO Dr Raoul-Gabriel Urma participated in an interview with eFinancialCareers about the future for traders if they don’t learn Python. He said: «If you want to get an edge today, you need to create new strategies with Python. This is why all the traders at trading companies are increasing their Python proficiency.»
Excel vs Python: Who wins?
The evidence suggests that both Excel and Python have their place with certain applications. Excel is a great entry-level tool and is a quick-and-easy way to analyse a dataset.
But for the modern era, with large datasets and more complex analytics and automation, Python provides the tools, techniques and processing power that Excel, in many instances, lacks. After all, Python is more powerful, faster, capable of better data analysis and it benefits from a more inclusive, collaborative support system.
Python is a must-have skill for data analysts, and now is the time to learn. According to Zhivotov: “You can be a good data analyst without knowing Python. But if you want to stand out above the rest, be a star data analyst and progress, then you need to learn Python».
If you want to reap the benefits, such as a higher salary, better career opportunities and keeping your skills relevant for the fourth industrial revolution, then learn Python.
Learn Python with Cambridge Spark
At Cambridge Spark, we offer a Level 4 Data Analyst Apprenticeship. If you’re working full time, you could join the L4 apprenticeship where you’ll learn:
- Advanced Python programming
- Data analysis with Numpy and Pandas
- Processing big data
- Building and implementing machine learning models; and
- Working with different types and databases, such as SQL
You’ll learn advanced data analytics, whilst remaining in full-time work. And England-based apprentices are eligible to have their course fully paid for by the UK Apprenticeship Levy.
Don’t have the time to commit to a long-term apprenticeship?
We also offer commercial training courses including our Data Analysis Foundations Certificate where you’ll learn how to build data analytics capabilities using Python and Pandas over 8 half-days of live interactive expert-led workshops.
Fill out the form below and one of our team will get back to you with more information about Cambridge Spark’s apprenticeships and courses.