
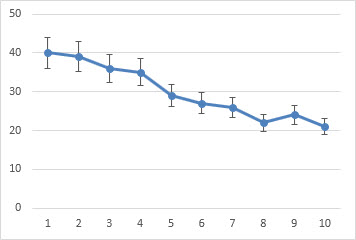
Error bars in charts you create can help you see margins of error and standard deviations at a glance. They can be shown on all data points or data markers in a data series as a standard error amount, a percentage, or a standard deviation. You can set your own values to display the exact error amounts you want. For example, you can show a 10 percent positive and negative error amount in the results of a scientific experiment like this:
You can use error bars in 2-D area, bar, column, line, xy (scatter), and bubble charts. In scatter and bubble charts, you can show error bars for x and y values.
Note: The following procedures apply to Office 2013 and newer versions. Looking for Office 2010 steps?
Add or remove error bars
-
Click anywhere in the chart.
-
Click the Chart Elements button
 next to the chart, and then check the Error Bars box. (Clear the box to remove error bars.)
 -
To change the error amount shown, click the arrow next to Error Bars, and then pick an option.
-
Pick a predefined error bar option like Standard Error, Percentage or Standard Deviation.
-
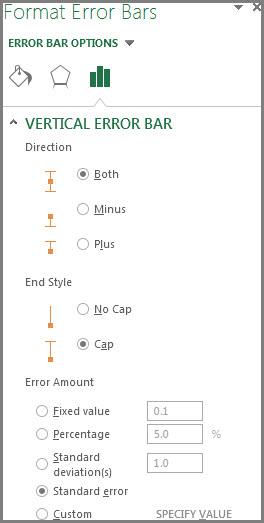
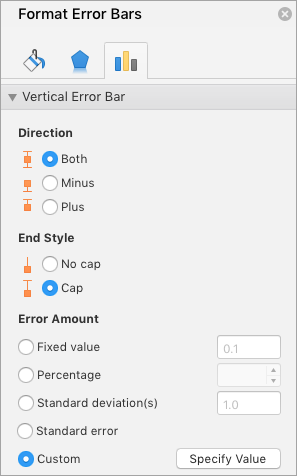
Pick More Options to set your own error bar amounts, and then under Vertical Error Bar or Horizontal Error Bar, choose the options you want. This is also where you can change the direction, end style of the error bars, or create custom error bars.
-
 next to the chart, and then check the Error Bars box. (Clear the box to remove error bars.)
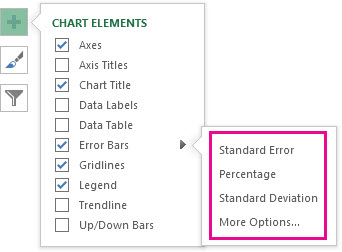
Note: The direction of the error bars depends on the type of chart you’re using. Scatter charts can show both horizontal and vertical error bars. You can remove either of these error bars by selecting them, and then pressing Delete.
Review equations for calculating error amounts
People often ask how Excel calculates error amounts. Excel uses the following equations to calculate the Standard Error and Standard Deviation amounts that are shown on the chart.
|
This option |
Uses this equation |
|---|---|
|
Standard Error |
Where: s = series number i = point number in series s m = number of series for point y in chart n = number of points in each series yis = data value of series s and the ith point ny = total number of data values in all series |
|
Standard Deviation |
Where: s = series number i = point number in series s m = number of series for point y in chart n = number of points in each series yis = data value of series s and the ith point ny = total number of data values in all series M = arithmetic mean |
Add, change, or remove errors bars in a chart in Office 2010
In Excel, you can display error bars that use a standard error amount, a percentage of the value (5%), or a standard deviation.
Standard Error and Standard Deviation use the following equations to calculate the error amounts that are shown on the chart.
|
This option |
Uses this equation |
Where |
|---|---|---|
|
Standard Error |
|
s = series number i = point number in series s m = number of series for point y in chart n = number of points in each series yis = data value of series s and the ith point ny = total number of data values in all series |
|
Standard Deviation |
|
s = series number i = point number in series s m = number of series for point y in chart n = number of points in each series yis = data value of series s and the ith point ny = total number of data values in all series M = arithmetic mean |
-
On 2-D area, bar, column, line, xy (scatter), or bubble chart, do one of the following:
-
To add error bars to all data series in the chart, click the chart area.
-
To add error bars to a selected data point or data series, click the data point or data series that you want, or do the following to select it from a list of chart elements:
-
Click anywhere in the chart.
This displays the Chart Tools, adding the Design, Layout, and Format tabs.
-
On the Format tab, in the Current Selection group, click the arrow next to the Chart Elements box, and then click the chart element that you want.
-
-
-
On the Layout tab, in the Analysis group, click Error Bars.
-
Do one of the following:
-
Click a predefined error bar option, such as Error Bars with Standard Error, Error Bars with Percentage, or Error Bars with Standard Deviation.
-
Click More Error Bar Options, and then under Vertical Error Bars or Horizontal Error Bars, click the display and error amount options that you want to use.
Note: The direction of the error bars depends on the chart type of your chart. For scatter charts, both horizontal and vertical error bars are displayed by default. You can remove either of these error bars by selecting them, and then pressing DELETE.
-
-
On a 2-D area, bar, column, line, xy (scatter), or bubble chart, click the error bars, the data point, or the data series that has the error bars that you want to change, or do the following to select them from a list of chart elements:
-
Click anywhere in the chart.
This displays the Chart Tools, adding the Design, Layout, and Format tabs.
-
On the Format tab, in the Current Selection group, click the arrow next to the Chart Elements box, and then click the chart element that you want.
-
-
On the Layout tab, in the Analysis group, click Error Bars, and then click More Error Bar Options.
-
Under Display, click the error bar direction and end style that you want to use.
-
On a 2-D area, bar, column, line, xy (scatter), or bubble chart, click the error bars, the data point, or the data series that has the error bars that you want to change, or do the following to select them from a list of chart elements:
-
Click anywhere in the chart.
This displays the Chart Tools, adding the Design, Layout, and Format tabs.
-
On the Format tab, in the Current Selection group, click the arrow next to the Chart Elements box, and then click the chart element that you want.
-
-
On the Layout tab, in the Analysis group, click Error Bars, and then click More Error Bar Options.
-
Under Error Amount, do one or more of the following:
-
To use a different method to determine the error amount, click the method that you want to use, and then specify the error amount.
-
To use custom values to determine the error amount, click Custom, and then do the following:
-
Click Specify Value.
-
In the Positive Error Value and Negative Error Value boxes, specify the worksheet range that you want to use as error amount values, or type the values that you want to use, separated by commas. For example, type 0.4, 0.3, 0.8.
Tip: To specify the worksheet range, you can click the Collapse Dialog button
, and then select the data that you want to use in the worksheet. Click the Collapse Dialog button again to return to the dialog box.Note: In Microsoft Office Word 2007 or Microsoft Office PowerPoint 2007, the Custom Error Bars dialog box may not show the Collapse Dialog button, and you can only type the error amount values that you want to use.
-
-
 , and then select the data that you want to use in the worksheet. Click the Collapse Dialog button again to return to the dialog box.
-
On a 2-D area, bar, column, line, xy (scatter), or bubble chart, click the error bars, the data point, or the data series that has the error bars that you want to remove, or do the following to select them from a list of chart elements:
-
Click anywhere in the chart.
This displays the Chart Tools, adding the Design, Layout, and Format tabs.
-
On the Format tab, in the Current Selection group, click the arrow next to the Chart Elements box, and then click the chart element that you want.
-
-
Do one of the following:
-
On the Layout tab, in the Analysis group, click Error Bars, and then click None.
-
Press DELETE.
-
Tip: You can remove error bars immediately after you add them to the chart by clicking Undo on the Quick Access Toolbar or by pressing CTRL+Z.
Do any of the following:
Express errors as a percentage, standard deviation, or standard error
-
In the chart, select the data series that you want to add error bars to.
For example, in a line chart, click one of the lines in the chart, and all the data marker of that data series become selected.
-
On the Chart Design tab, click Add Chart Element.
-
Point to Error Bars, and then do one of the following:

|
Click |
To |
|---|---|
|
Standard Error |
Apply the standard error, using the following formula:
s = series number |
|
Percentage |
Apply a percentage of the value for each data point in the data series |
|
Standard Deviation |
Apply a multiple of the standard deviation, using the following formula:
s = series number |


Express errors as custom values
-
In the chart, select the data series that you want to add error bars to.
-
On the Chart Design tab, click Add Chart Element, and then click More Error Bars Options.
-
In the Format Error Bars pane, on the Error Bar Options tab, under Error Amount, click Custom, and then click Specify Value.
-
Under Error amount, click Custom, and then click Specify Value.
-
In the Positive Error Value and Negative Error Value boxes, type the values that you want for each data point, separated by commas (for example, 0.4, 0.3, 0.8), and then click OK.
Note: You can also define error values as a range of cells from the same Excel workbook. To select the range of cells, in the Custom Error Bars dialog box, clear the contents of the Positive Error Value or Negative Error Value box, and then select the range of cells that you want to use.
Add up/down bars
-
In the chart, select the data series that you want to add up/down bars to.
-
On the Chart Design tab, click Add Chart Element, point to Up/Down Bars, and then click Up/down Bars.
Depending on the chart type, some options may not be available.
See Also
Create a chart
Change the chart type of an existing chart
 Please Note:
This article is written for users of the following Microsoft Word versions: 2007, 2010, 2013, 2016, 2019, and Word in Microsoft 365. If you are using an earlier version (Word 2003 or earlier), this tip may not work for you. For a version of this tip written specifically for earlier versions of Word, click here: Turning Off Track Changes Change Bars.
![]()
Written by Allen Wyatt (last updated September 14, 2019)
This tip applies to Word 2007, 2010, 2013, 2016, 2019, and Word in Microsoft 365
Word includes a feature that allows you to track changes made to a document. One of the ways in which Word marks your changes on a document is to include a change bar at the side of a line in which a change was made. This is fairly common in editing, but it may not be to your liking. You can turn off the change bars by following these steps if you are using Word 2013 or a later version:
- Display the Review tab of the ribbon.
- Click the icon at the bottom-right of the Tracking group. Word displays the Track Changes Options dialog box. (See Figure 1.)
- Click on the Advanced Options button. Word displays the Advanced Track Changes Options dialog box. (See Figure 2.)
- In the Markup section use the Changed Lines drop-down list to choose (None).
- Click on OK to close the dialog box.
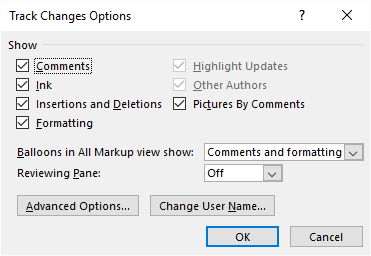
Figure 1. The Track Changes Options dialog box.
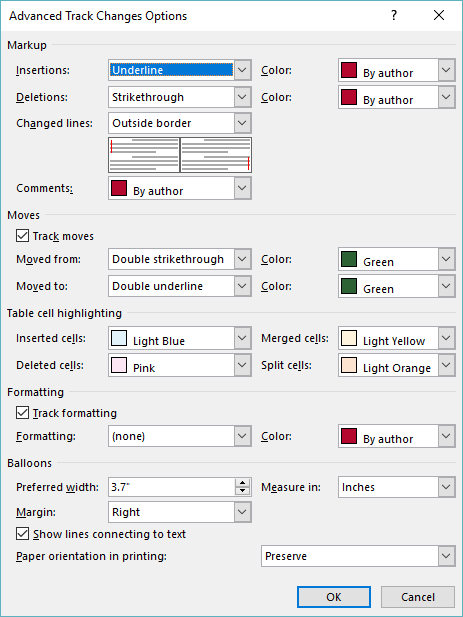
Figure 2. The Advanced Track Changes Options dialog box.
If you are using Word 2007 or Word 2010 the steps are just a little different.
- Display the Review tab of the ribbon.
- Click the down-arrow just under the Track Changes tool (in the Tracking group).
- Choose Change Tracking Options. Word displays the Track Changes Options dialog box.
- In the Markup section use the Changed Lines drop-down list to choose (None).
- Click on OK to close the dialog box.
Note that making this setting change hides the appearance of the change bars. Rest assured they are still there and can be redisplayed by choosing to display them again.
WordTips is your source for cost-effective Microsoft Word training.
(Microsoft Word is the most popular word processing software in the world.)
This tip (8765) applies to Microsoft Word 2007, 2010, 2013, 2016, 2019, and Word in Microsoft 365. You can find a version of this tip for the older menu interface of Word here: Turning Off Track Changes Change Bars.
Author Bio
With more than 50 non-fiction books and numerous magazine articles to his credit, Allen Wyatt is an internationally recognized author. He is president of Sharon Parq Associates, a computer and publishing services company. Learn more about Allen…
MORE FROM ALLEN
Limiting a Spelling Check
When you perform a spelling check, Word typically checks everything in your document. If you want to limit what is …
Discover More
Changing the Default Font for Envelopes
When you create an envelope, Word assumes you want to use the font it has decided should be used for the envelope. If you …
Discover More
Creating a Printer Pool
If you work in an office with many users, your system may have access to a group of printers. Here’s how you can set up …
Discover More
More WordTips (ribbon)
Track Changes Thinks the Editor Has Changed
Track changes is a great feature to use when you want to show what has changed in a document. Word should note which …
Discover More
Accepting All Deletions in a Document
When you use Track Changes in a document, it is easy to amass quite a few edits that you need to accept of reject. If you …
Discover More
Getting a Change and Comment Count by Author
Track Changes can be a great tool when you have multiple editors working on a document. If you want to know the names of …
Discover More
I have a love/hate relationship with Word. On the one hand, it’s bloated and annoying. But on the other hand, it has a number of great features that I rely on heavily. One of those features is Track Changes.
So, I want to quickly offer two of my favorite Word Track Changes tips (plus a bonus one for InDesign!), in case they can help you like they’ve helped me. Before you read this, I’m assuming that you already basically know how to use Track Changes in Word.
Keyboard Shortcut for Show/Hide Changes
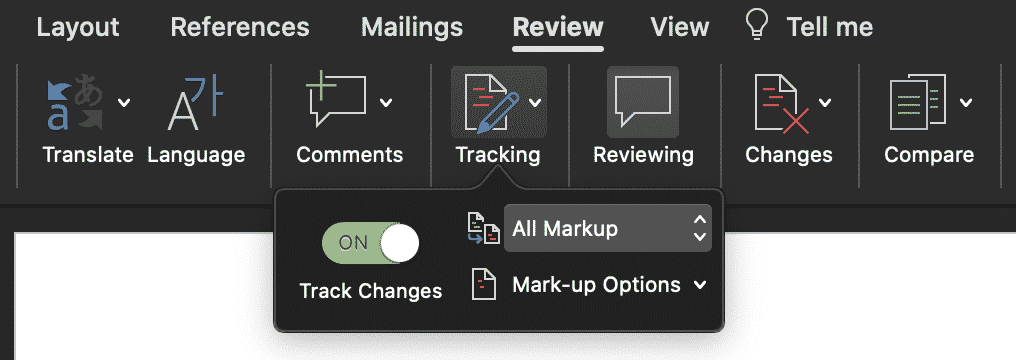
First, a keyboard shortcut I use daily… you know that in the Review tab in Word, there is a popup menu that shows “All Markup,” right?
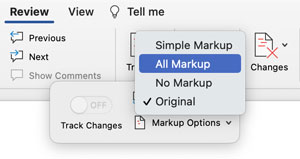
There are three other choices in the menu: “Simple Markup,” “No Markup,” and “Original.”
I find that I am forever switching between two of these:
- All Markup: I need to see the text that has been changed.
- No Markup: I need to see how the final document will look, without any strikethroughs and underlines.
The problem is that it’s a major pain to choose from the menu each time you want to switch! I’d rather use a keyboard shortcut. And fortunately, after quite a bit of searching, I found one. First, choose Tools > Customize Keyboard, then choose All Commands from the Categories list and then, in the list of Commands on the right, choose View Changes. You can use the search field to quickly locate any command instead of scrolling to find it.
Now give it a shortcut in the “Press new keyboard shortcut” field and click Assign. (I use Control+R on the Mac.)

That’s it! The shortcut you assign now toggles between these two common settings. Simple but awesome!
There’s also a nifty shortcut (though not of the keyboard variety) that you can use to toggle between All Markup and Simple Markup. Just click one of the change bars on the left side of the text.
Accept/Reject All by Author
We sometimes have four or more people editing a single document, and trying to figure out who did what can get crazy. Often we need to accept all the changes by one author or editor but leave the rest, and Word doesn’t make it obvious how to do that. Fortunately, the solution is pretty simple.
First, you need to realize that Word lets you show (or hide!) comments from individual reviewers. To find that, look inside the Reviewers submenu, in the Markup Options menu:
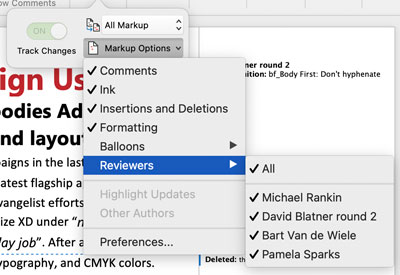
If you choose All, it toggles them all on or off. Make sure the checkmark is on only next to the reviewers that you want to accept (or reject).

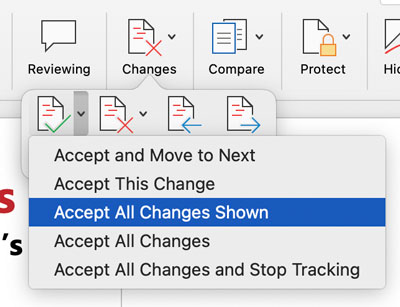
Now, go to the Changes menu and choose Accept (or Reject) > All Changes Shown:
Now you can select All Reviewers from the Markup Options menu again, so you can see the changes the other reviewers have made.
Targeting Changes by Specific Users in InDesign
By the way, targeting changes by specific users is one of the few Track Changes features that’s easier to accomplish in InDesign. If you use Track Changes in InDesign and you want to accept or reject just one person’s edits, just place your cursor in one of their edits and then choose Accept/Reject All Changes by This User from the Track Changes menu:

These little tricks aren’t going to save you hours, but they will shave off seconds and minutes here and there (and they certainly make the process of working with tracked changes easier).
![]()
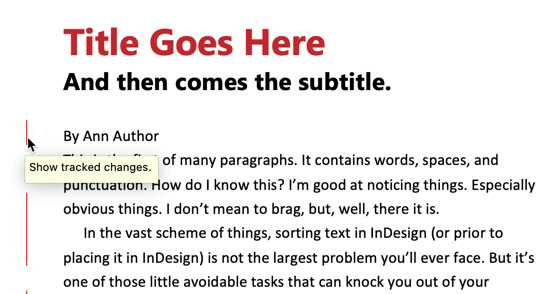
The Change Bar is the column that automatically appears on the right-hand side of your document when you turn on tracked changes in Microsoft Word. In the change bar, you can clearly see all tracked changes and their author, the information in the change bar will show any changes in line with where the change was made in your Word file.
As you scroll down your document, the change bar will scroll through the tracked changes.
Some authors find the change bar to be distracting and would prefer it not to be visible why they are marking up their document or reviewing it.

Turning off the change bar, removing it or making it invisible is possible in all versions of Microsoft Word.
In this post, we will show you how to hide the change bar and leave you to mark up or review your document without the distraction of tracked changes on the right-hand side.
How to Hide the Change Bar in Microsoft Word
- Open Microsoft Word
- Click Review in the toolbar
- Under Review, Click Tracking
- Find and Click Mark-up Options
- Within the Mark-up Options drop-down, press Balloons
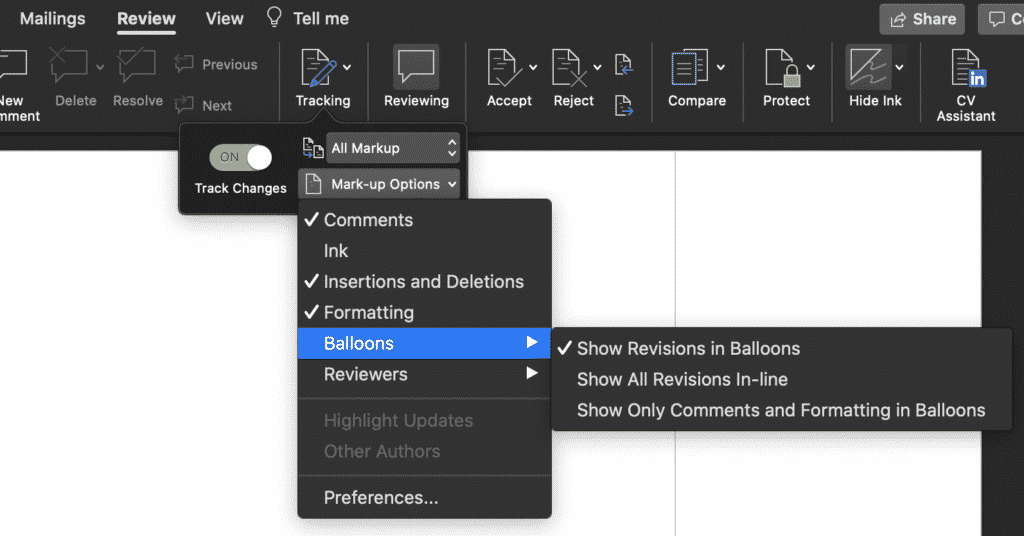
- Find and Click Show All Revisions in-line
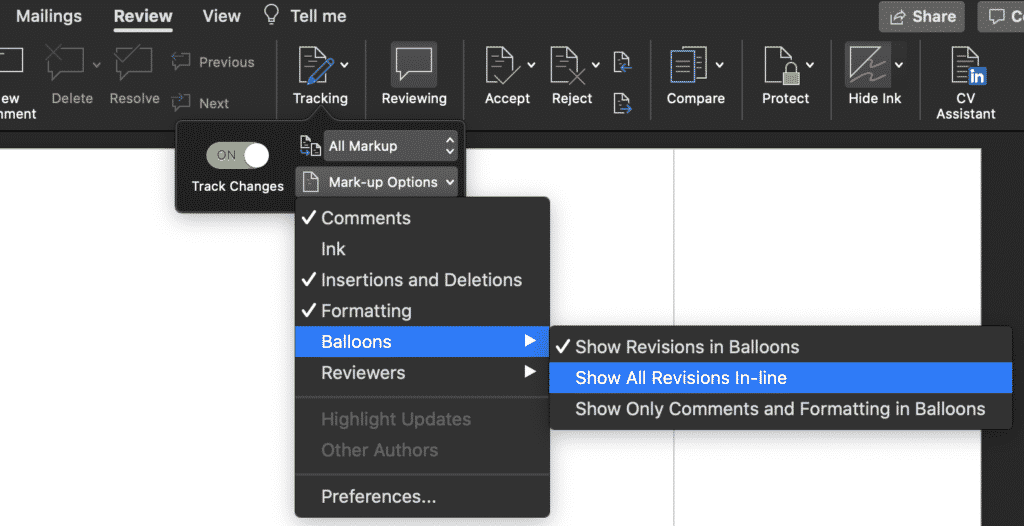
By selecting Show All Revisions in-line under tracking, you have now removed the mark-up area also know as the change bar and all tracked changes will be shown in the document, underlined in red.
Searching for a better way to manage Tracked Changes in Word?
If you are collaborating in Microsoft Word, chances are you have sent a document around your team for review. Receiving back a file, covered in tracked changes, red marks and what feels like a million comments to review.
It can be a daunting task to begin reviewing each change, one-by-one, or sorting through the changes and only reviewing the ones that are marked by your team members or relevant to your area of expertise.
It’s overwhelming and a very manual process, but lucky for you there is a better way.
Introducing Simul Docs.
A purpose-built tool, that was created for you – the team that like to collaborate, edit and track changes but just want it to be a whole lot simpler.

First things first, you don’t even have to remember to turn on tracked changes when working with Simul Docs on your side.
If you start making a change to your shared Word Document, Simul knows you want that edit tracked so it does it for you, every, single, time, you can make changes in peace while Simul does the hard work for you.

What about managing multiple users edits in the same document, is it that messy with Simul Docs?
You guessed it, it’s not, Simul has a solution for that too.
Each users document will be saved as a neat new version, stored to the side of your dashboard in an easy to use versions list. You can then open each version at your leisure and accept or reject each author’s changes individually.
This doesn’t mean that you will then end up with 5 different versions, Simul will make sure that the documents all stay up to date, if Aaron is making changes in the file, the rest of the team can see them, live.

They can make changes at the same time, or even make a change over Aaron’s change and all of this will be saved in their own version. So collaboration becomes simple. Once you have approved or rejected everyone’s changes you will be left with a clean, fresh, new version ready to continue the process or finalise the document.

To make things even easier, Simul marks who made which changes and when. At a glance, you know which document was updated by who, its a simple feature that makes a world of difference when you are collaborating with more than one or two other people.
Finally, Simul will keep every single version on file for you, saved in that nifty versions list we mentioned earlier.
So, Simul ends up making your collaboration process easier and helps you manage version control as you’ve never seen before. Each version is saved in the versions list, with the version number, authors name and any changes made visible to make it easy for you to refer back to an old version, or find an old change at any time.

Gosh, how much easier did redlining, tracking changes and version control just become?
Its a fantastic tool, that has your back and is here to simplify collaboration.
If you haven’t tried it already, head over to www.simuldocs.com and start with the free trial option. Your team will love you.
You are here: Home / Office 2010 / Show or hide scroll bars in Word
In this tutorial we are going to see how to show or hide scrollbars in Word 2016, 2013 & 2010. Microsoft Word users can use the settings available as Word Options to show or hide vertical and horizontal bars.

Display Settings – Horizontal and Vertical Scroll bars
Click the File menu –> Options, this would display the Word Options window.

In the Word Options window, click Advanced tab and scroll down to Display section. Now you can show or hide scroll bars using the check boxes with label as “Show horizontal scroll bar” and “Show vertical scroll bar”. After making changes to the required check boxes, click OK button to confirm and save the changes.
Reader Interactions