
Отчет о движении денежных средств
С помощью этого шаблона можно проанализировать или продемонстрировать движение денежных средств бизнеса за последние двенадцать месяцев. Спарклайны, условное форматирование и четкий дизайн делают его одновременно красочным и практичным.
Excel
Скачать
Поделиться
![]()
![]()
![]()
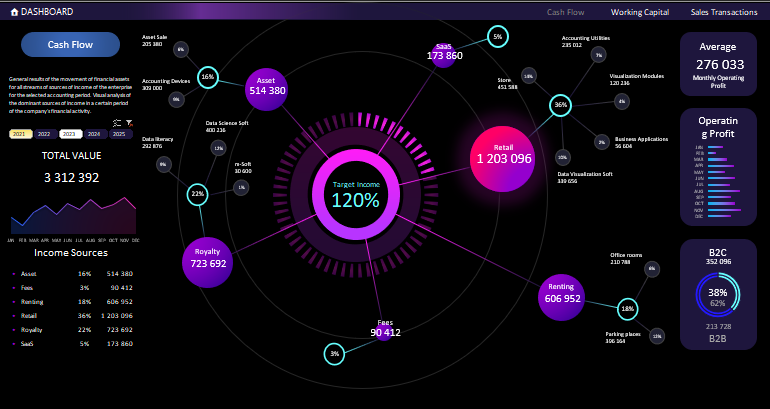
Отчет Cash Flow позволяет спрогнозировать финансовые показатели в будущем и предотвратить кассовые разрывы. Поэтому он очень важен и так популярен. Но среди стандартных диаграмм Excel нет подходящих инструментов для визуализации данных по отчету Cash Flow. Вашему вниманию предлагается необычный пример создания комбинированной диаграммы для визуального анализа циркуляции денежного потока на предприятии.
Комбинированная диаграмма для визуального анализа Cash Flow в Excel
Так как в арсенале стандартных диаграмм Excel нет подходящего инструмента для анализа отчета по Cash Flow, будем комбинировать свой график из уже имеющихся средств. В данном примере используется комбинация из трех отдельных диаграмм:
- Пузырьковой (Bubble).
- Круговой (Pie)
- Комбинированной из двух Кольцевых (Doughnut).
Подробное описание предназначения и стратегии использования по каждому пункту:
- Пузырьковая диаграмма – предназначена для визуального сравнения величины более двух значений.
- Круговая – отображает отношение нескольких частей к целому общему значению. В этике дизайнеров и разработчиков визуальных отчетов не рекомендуется использовать круговую диаграмму для сравнения более чем 2 значения. Но в нашей творческой комбинации ее мы будем использовать для отображения экспонированного значения перевыполнения финансового плана больше 100% на одной и той же диаграмме. Хотя по сути все сохраняется в рамках этики дизайна визуализации, так как используется 2 значения: 1– процент доли перевыполнения плана по отношению к 2 – общего целого значения 100%.
- Кольцевая – так же, как и круговая предназначена для отображения нескольких долей по отношению к целому общему значению. Но в отличии от круговой диаграммы может содержать несколько рядов данных. Это отличие нам сильно пригодится в разработке дизайна визуализации данных для интерактивной презентации.
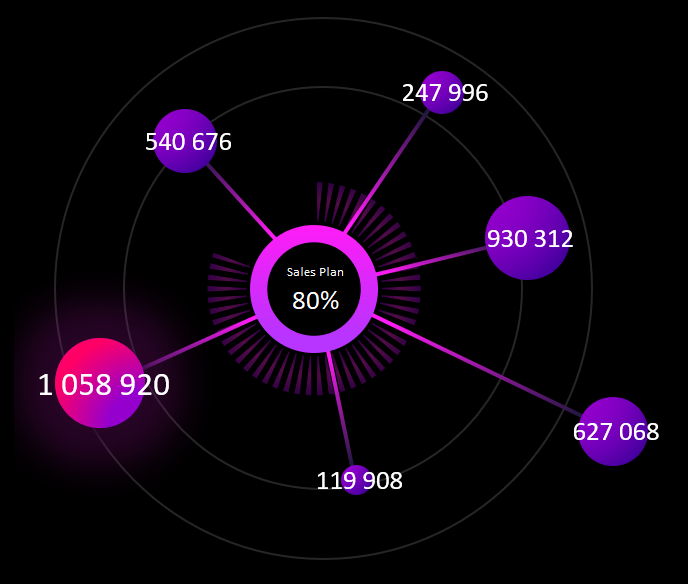
Одно из важнейших предназначений отчета по Cash Flow – это предотвращение кассовых разрывов. Поэтому наш комбинированный график будет содержат в центре большую комбинированную диаграмму, информирующую о проценте выполнения плана продаж. Чем выше этот показатель, тем меньше вероятность кассового разрыва. Схема как будет выглядеть будущий дизайн визуализации:
Техническое задание для разработчика определено, показано и описано. Теперь можно переходить к процессу реализации задачи.
Сборка комбинированной диаграммы в Excel пошагово
Разберем данный пример в стиле пошаговой инструкции:
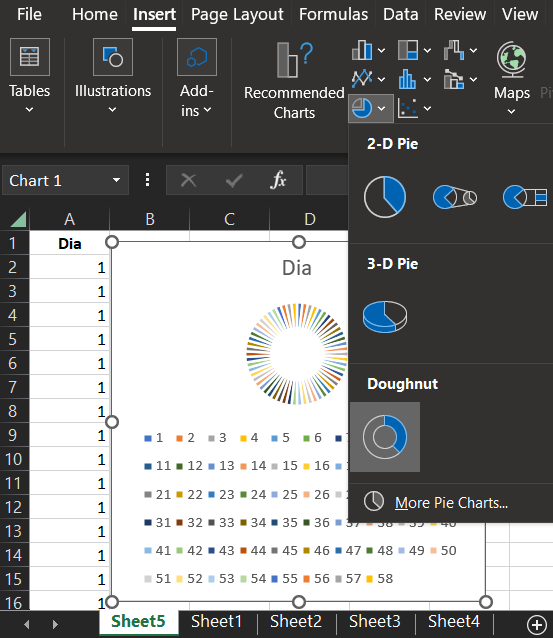
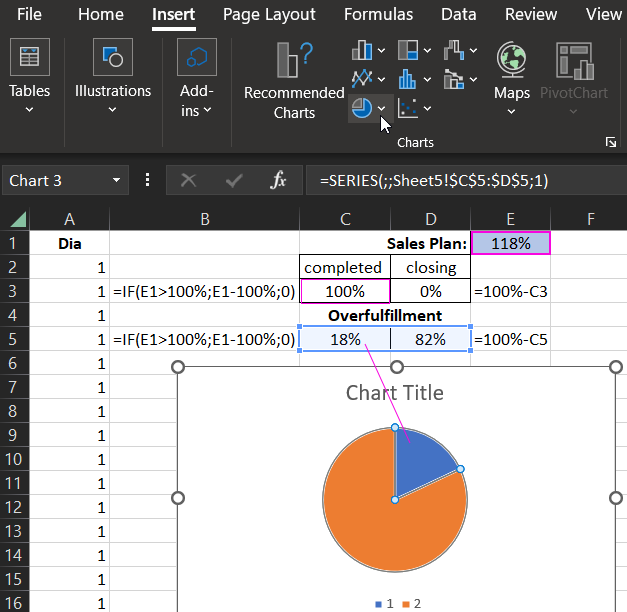
- Создадим кольцевую шкалу из 58-ми делений:
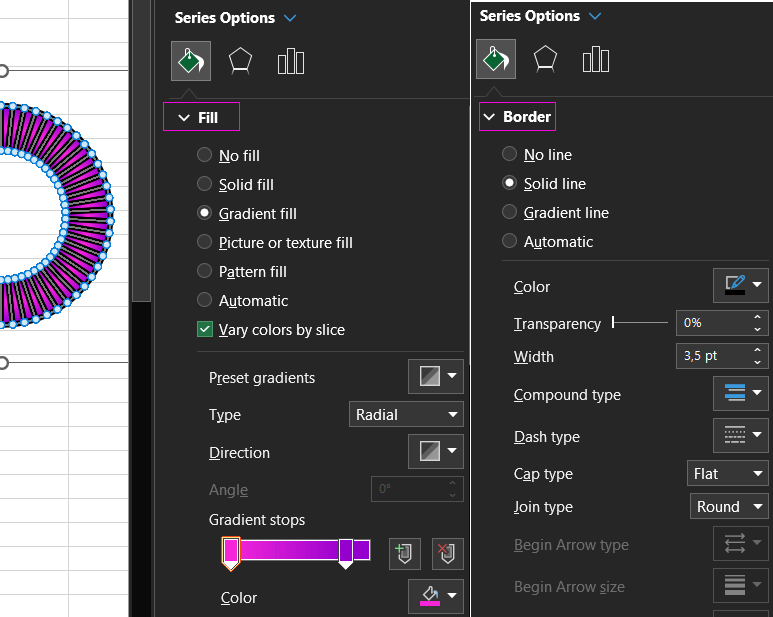
- Проектируем дизайн для делений на кольцевой шкале:
- Добавляем новую серию значений для комбинирования диаграммы:
- Настраиваем комбинацию в окне изменения типа. Обратите внимание на то, что нужно указать для второй серии значений расположение по вспомогательной оси координат. Таким образом две кольцевые диаграммы будут наложены как на разных слоях:
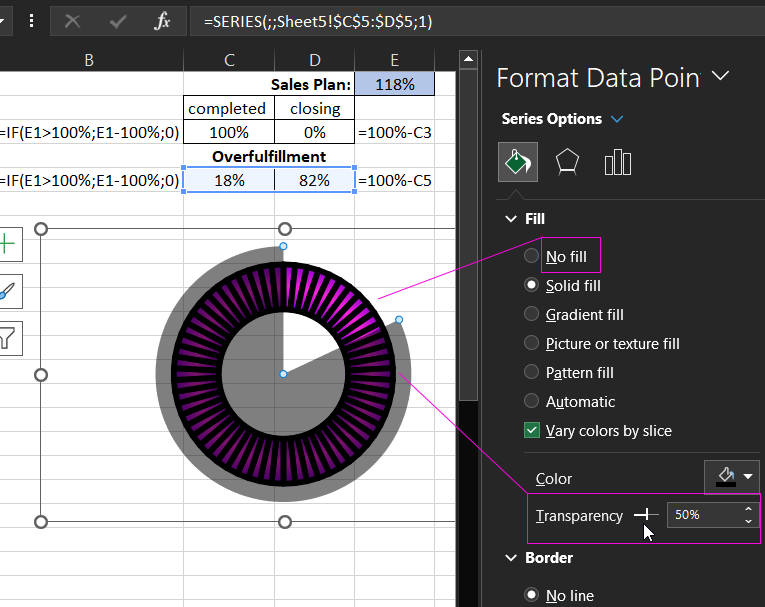
- Изменяем дизайн для второй кольцевой диаграммы, дополнительно наложенной сверху с помощью комбинирования типов в Excel. Синею заливку изменяем на прозрачную, а оранжевую на черную. И не забудем убрать контуры. Комбинированная диаграмма из двух кольцевых – готова:
- Изменяем значения на формулы в таблице показателей выполнения плана продаж. А также создаем еще одну табличку с формулами для исходных значений круговой диаграммы:
- На основе второй таблички создаем круговую диаграмму, которая будет экспонировать на шкале долю соответственной значениям при превышении выполнения плана продаж:
- Изменяем цвета заливок круговой диаграммы и накладываем ее на комбинированную состоящую из двух кольцевых. Незабываем подровнять размеры. Синий цвет меняем на прозрачный, а оранжевый делаем черной, но полупрозрачной заливкой и удаляем все контуры:
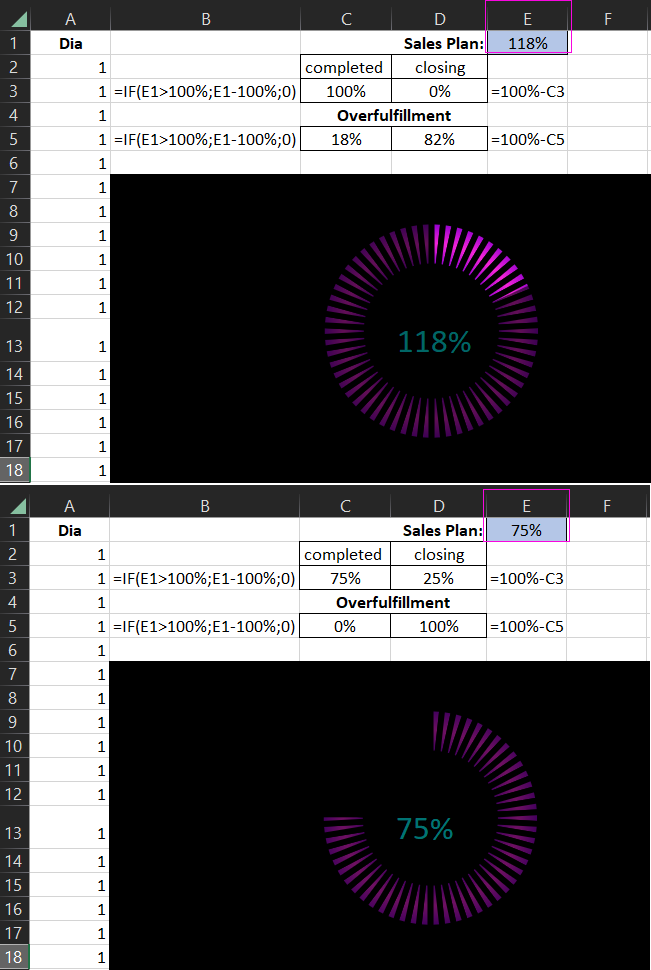
- Тестируем и наслаждаемся готовым результатом на черном фоне и проверяем как все работает при изменении исходного значения в ячейке E1:
- Добавляем пузырьковый график как последнюю комбинацию в общей композиции презентации отчета по циркуляции движения денежных средств:
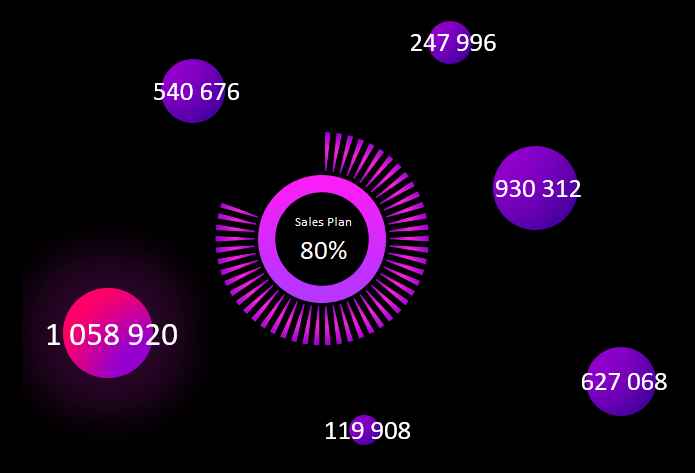
Дальше все красиво и талантливо оформляем для создания профессиональной инфографики с интерактивными возможностями. Все зависит от вашего воображение, а оно зависит от вдохновения:
 Скачать анализ Cash Flow в комбинированной диаграмме Excel
В широком ассортименте инструментов для визуализации данных в Excel есть все и даже больше, чем кажется на первый взгляд. Необходимо лишь немного опыта, а воображение придет с творческим вдохновением. Смело скачивайте данный шаблон и вдохновляйтесь, изменяйте под свои потребности и улучшайте. Нет предела совершенству, не существует границ между душой и творчеством.
A cash flow statement, also referred to as a statement of cash flows, shows the flow of funds to and from a business, organization, or individual. It is often prepared using the indirect method of accounting to calculate net cash flows. The statement is useful for analyzing business performance, making projections about future cash flows, influencing business planning, and informing important decisions. The term “cash” refers to both income and expenditures and may include investments and assets that you can easily convert to cash. By conducting a cash flow analysis, a business can evaluate its liquidity and solvency, compare performance among accounting periods, identify cash flow drivers to support growth, and plan ahead to maintain a positive cash position.
Below you’ll find a collection of easy-to-use Excel templates for accounting and cash flow management, all of which are fully customizable and can be downloaded for free.
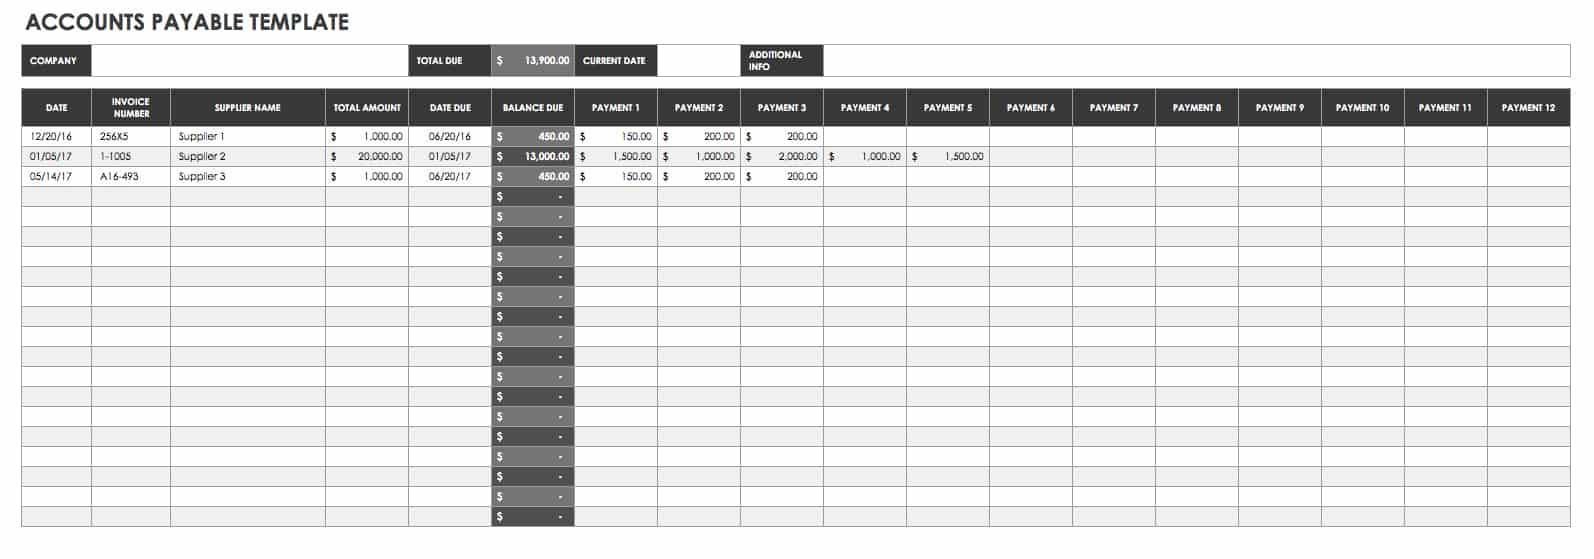
Accounts Payable Template
Download Accounts Payable Template
Excel | Smartsheet
This accounts payable template tracks suppliers, order numbers, and amounts due to help you manage payments and due dates. Easily organize ordering stock or supplies from multiple vendors with this template for greater efficiency and fewer errors.
Accounts Receivable Template

Download Accounts Receivable Template
Excel | Smartsheet
Don’t let balances owed to your business slip through the cracks. This template accounts receivable template lists customers, invoice tracking details, amounts due, and outstanding balances. Keeping track of these accounts can inform your collections process by helping you quickly identify which overdue payments have aged significantly.
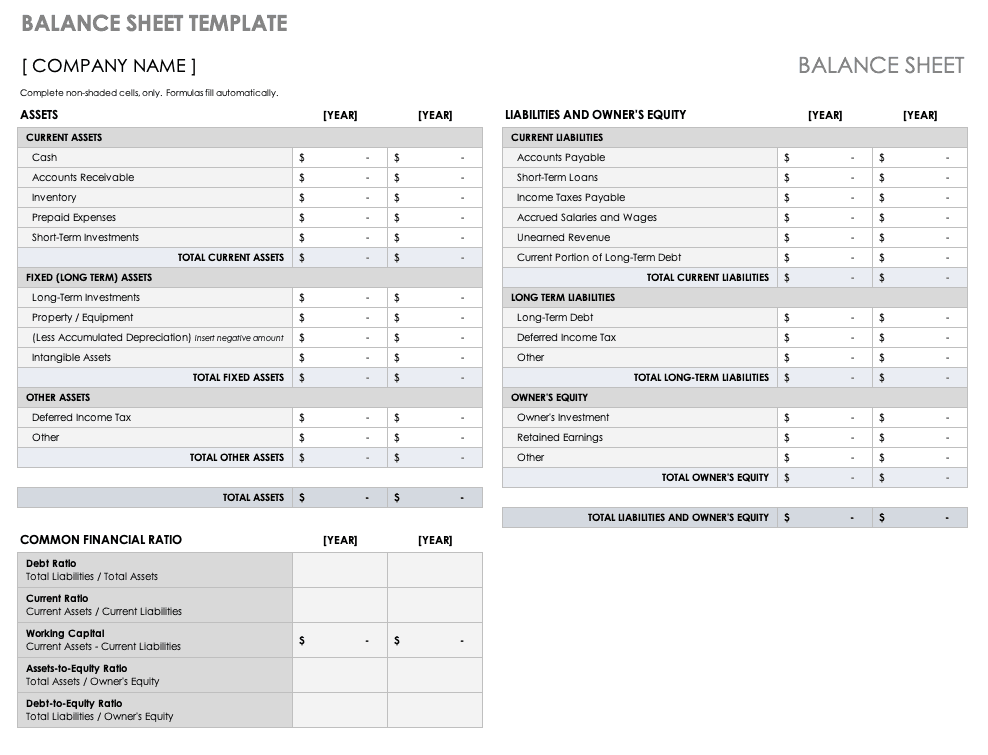
Balance Sheet Template
Download Balance Sheet Template
Excel | Smartsheet
A balance sheet provides a summary of financial health in a single, brief report. With this balance sheet template, you can assess the financial standing of a business by examining assets, liabilities, and equity. Business owners can use it to evaluate performance and communicate with investors.
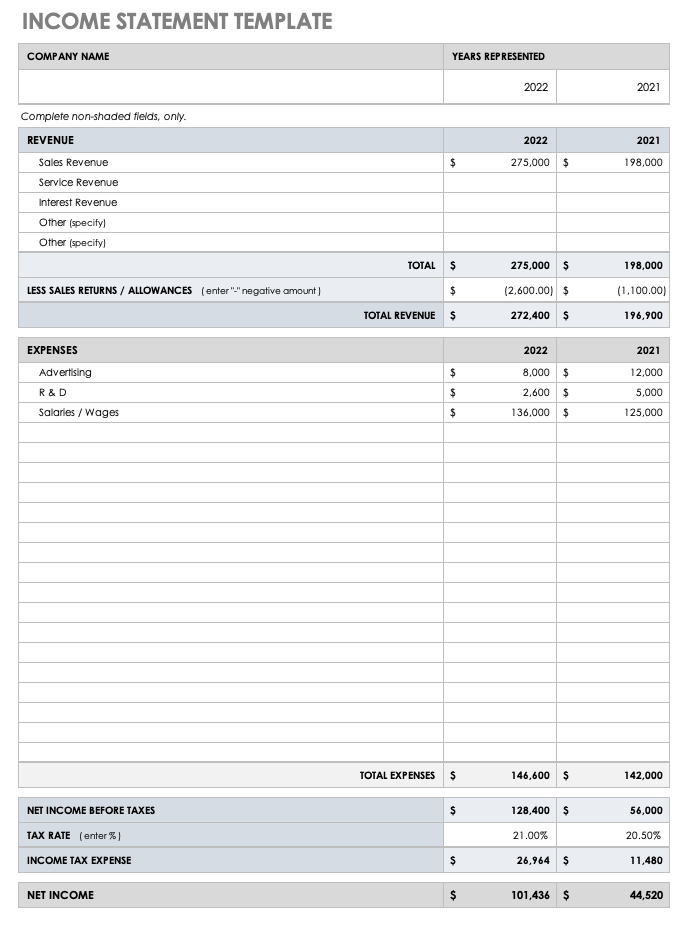
Income Statement Template
Download Income Statement Template
Excel | Smartsheet
Use this income statement template to assess profit and loss over a given time period. This template provides a clear outline of revenue and expenses along with net income figures. You can edit the template to match your needs by adding or removing detail, and create an income statement for a large or small business.
Simple Cash Flow Template

Download Simple Cash Flow Template
Excel | Smartsheet
This template works for any length of time and allows you to compare different periods for a quick analysis of cash flows. It include sections for an itemized list of revenue and expenditures, automatic calculations of totals and net cash flows, and a simple layout for ease of use. You can modify the template by adding or removing sections to tailor it to your business.
3-Year Cash Flow Statement Template
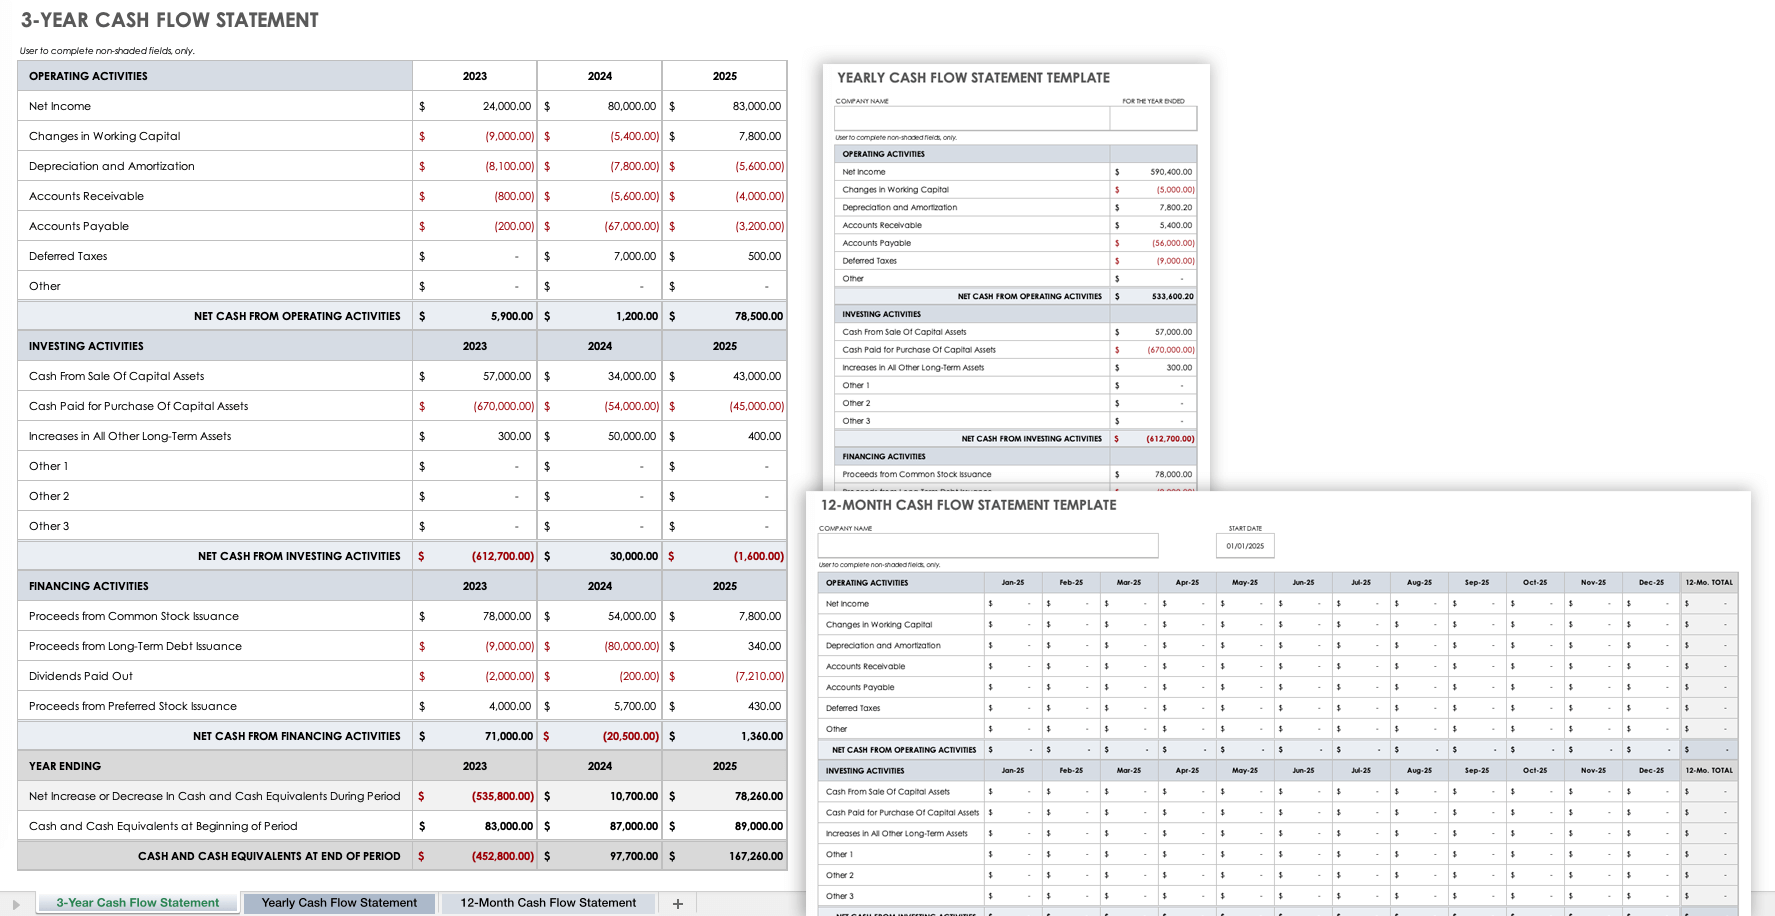
Download 3-Year Cash Flow Statement Template
Excel | Smartsheet
Use this statement of cash flows template to track and assess cash flows over a three-year period. The template is divided into sections for operations, investing, and financing activities. Simply enter the financial data for your business, and the template completes the calculations.
Monthly Cash Flow Template
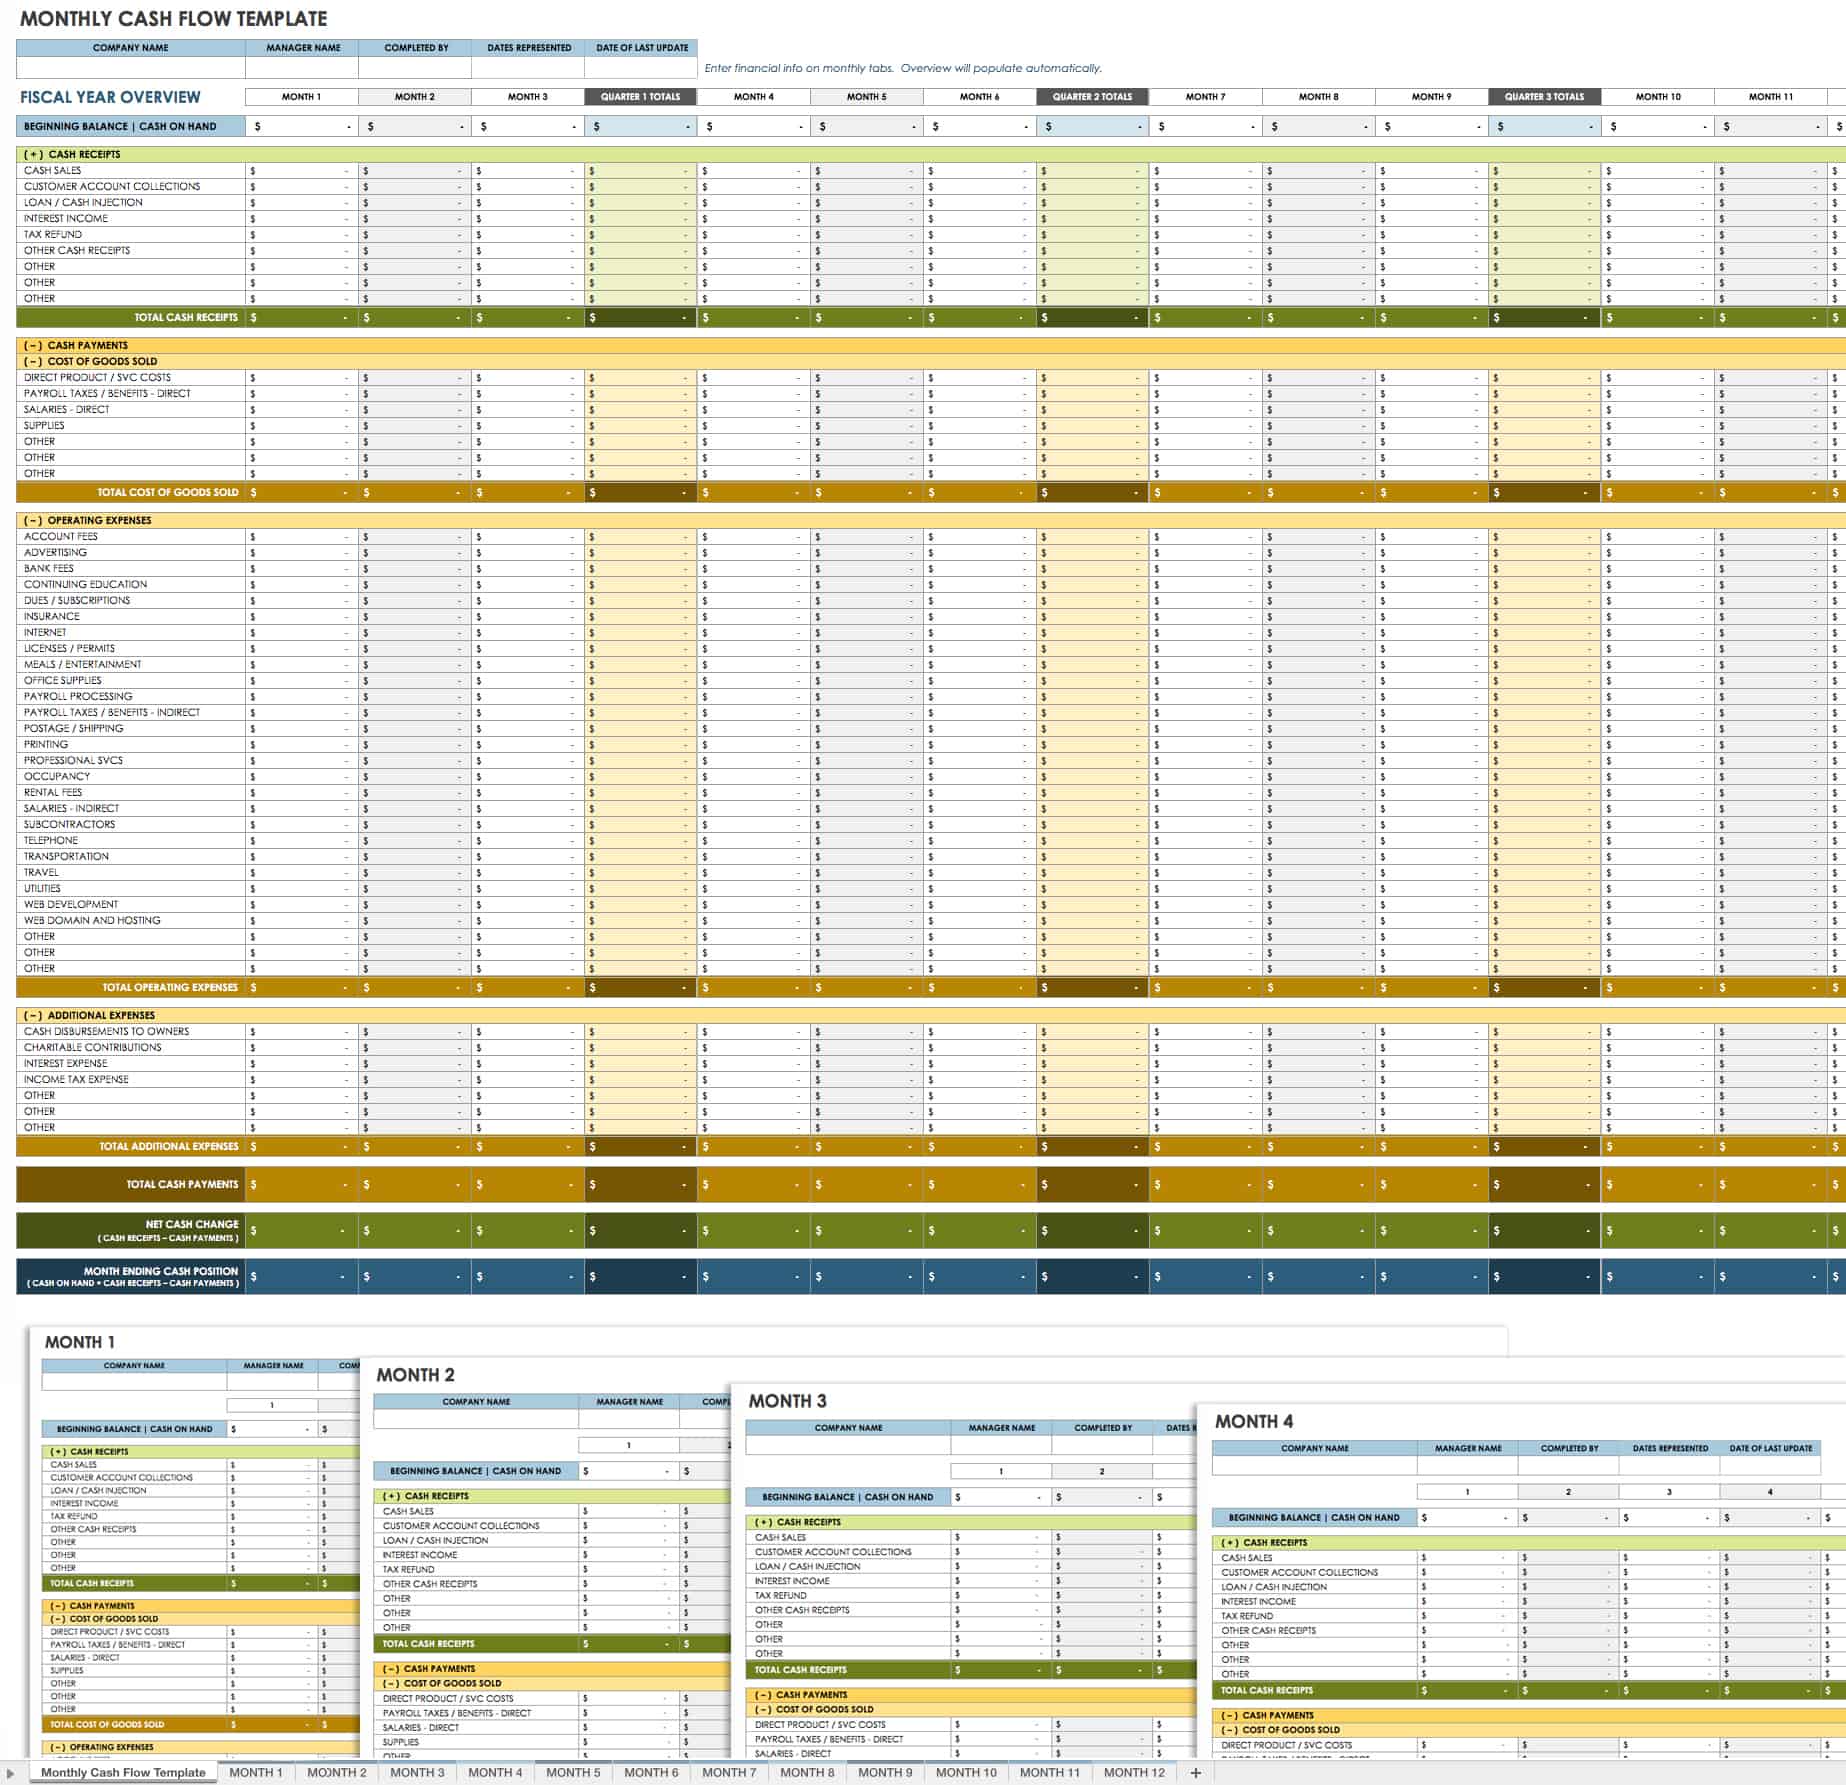
Download Monthly Cash Flow Template
This comprehensive template offers an annual overview as well as monthly worksheets. Create a detailed monthly cash flow report to analyze performance or plan for the future. Each month has a separate sheet so that you can get a thorough picture of cash inflows and outflows for both short- and long-term periods.
Daily Cash Flow Template
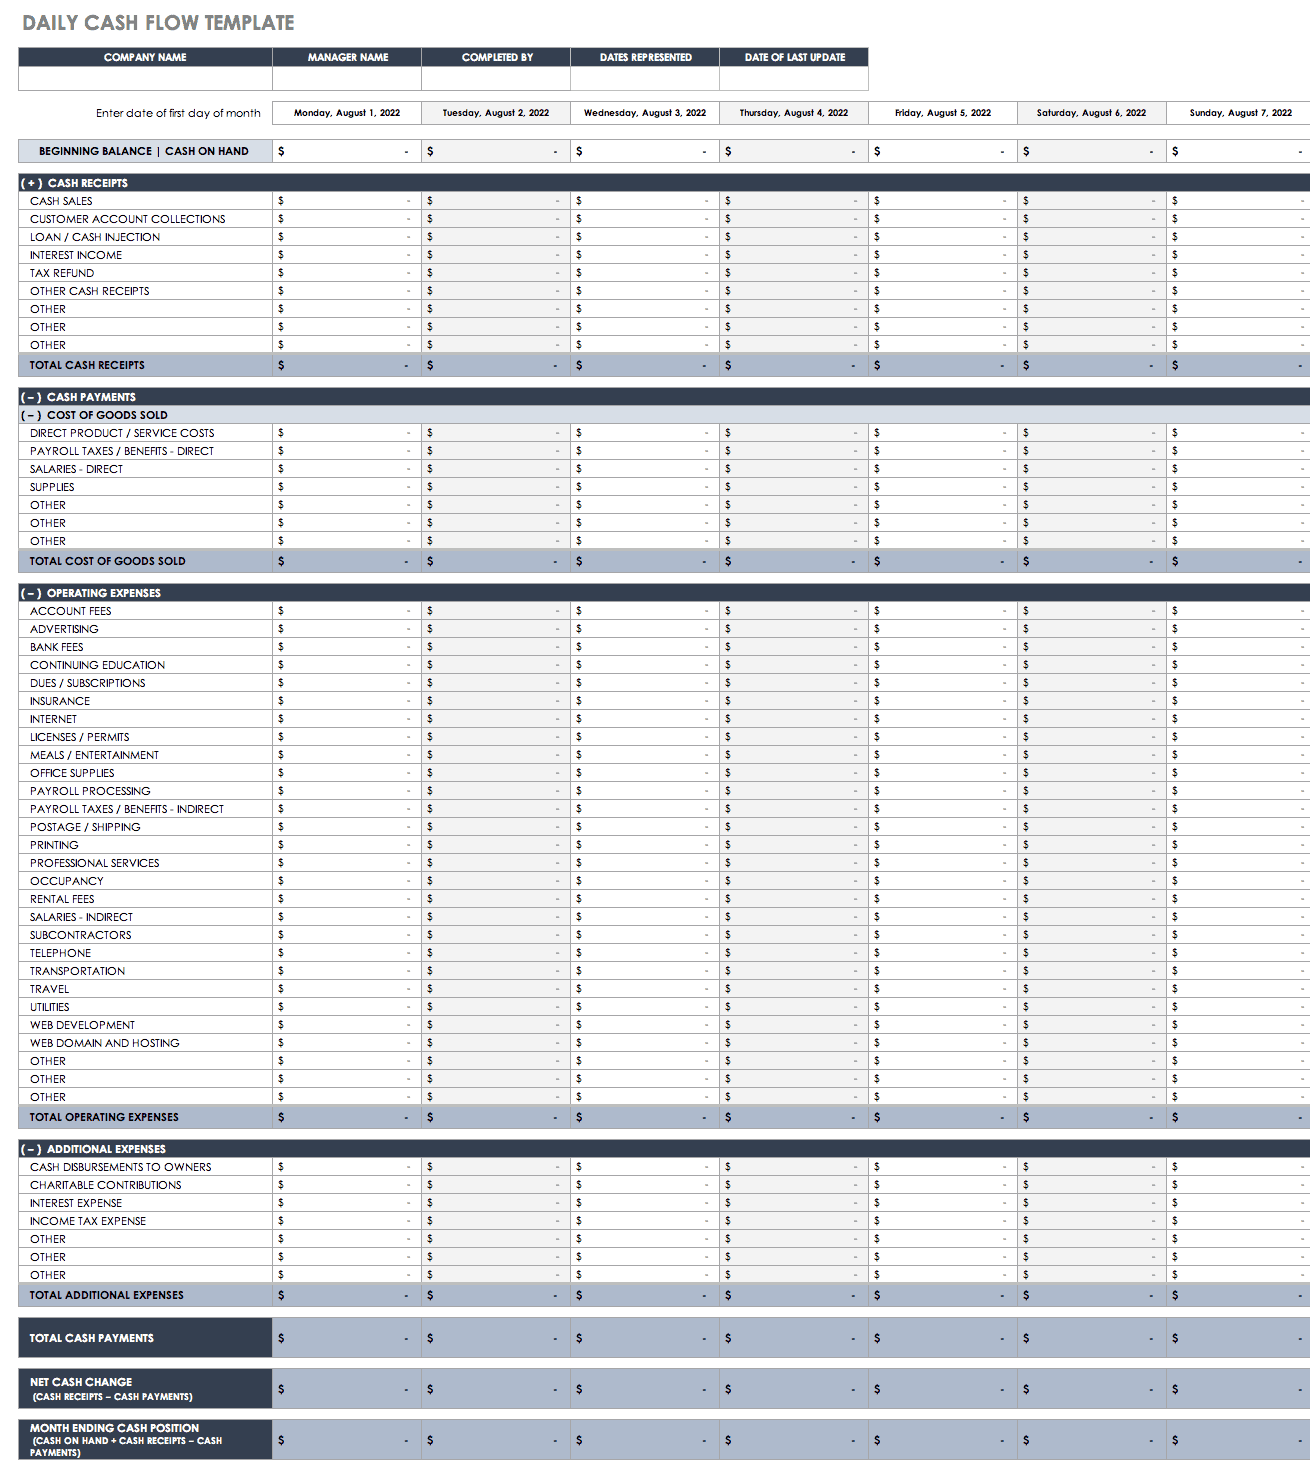
Download Daily Cash Flow Template
Add receipts and payments to this daily cash flow template to get a deep understanding of business performance. You can customize the list of cash inflows and outflows to match your company’s operations.
12-Month Cash Flow Forecast
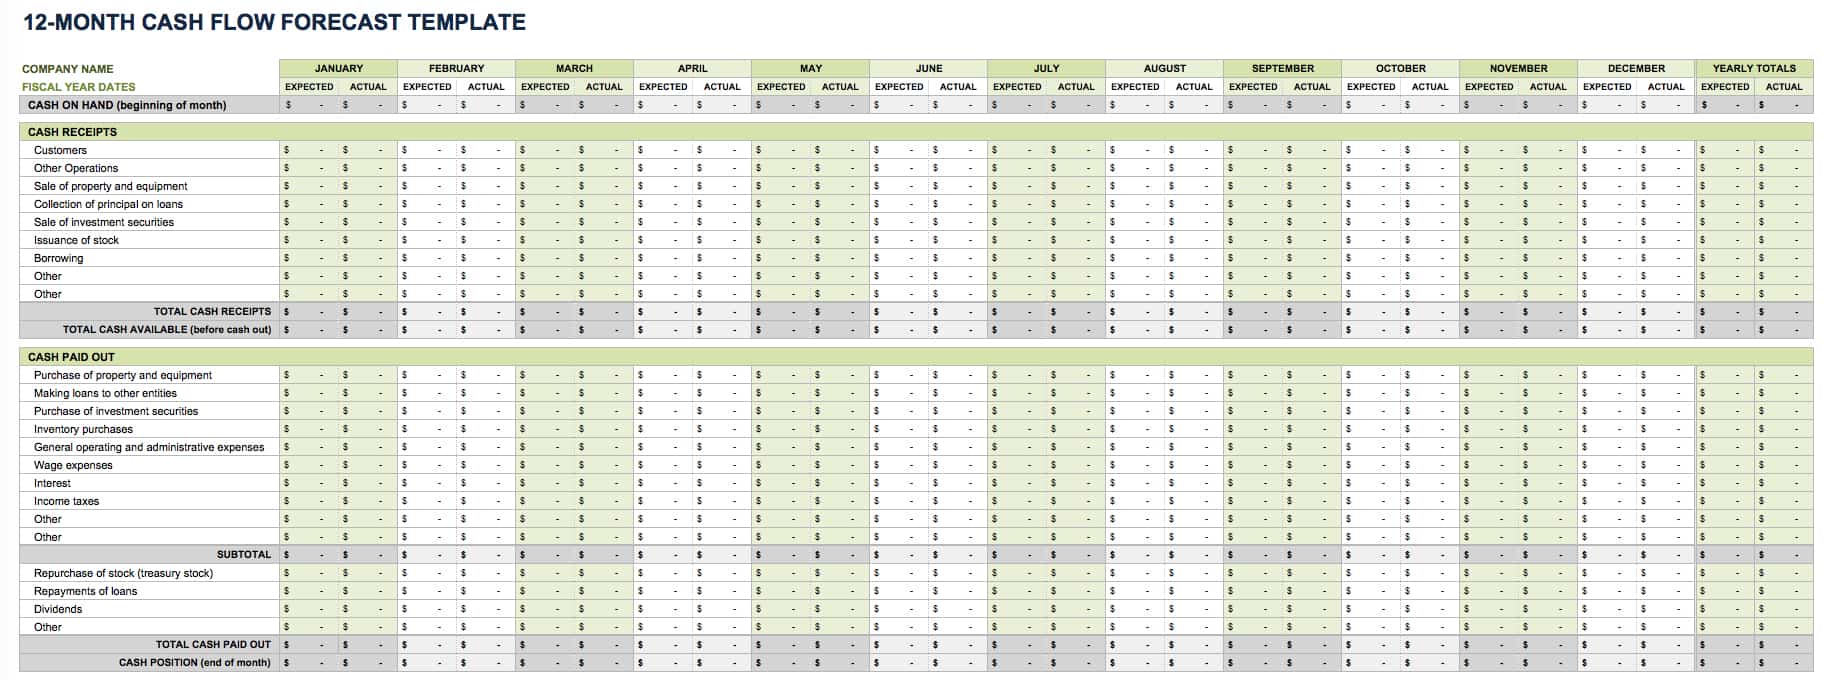
Download 12-Month Cash Flow Forecast
Excel | Smartsheet
Use this template to create a cash flow forecast that allows you to compare projections with actual outcomes. This template is designed for easy planning, with a simple spreadsheet layout and alternating colors to highlight rows. You get a snapshot of cash flows over a 12-month period in a basic Excel template.
Quarterly Cash Flow Projections Template
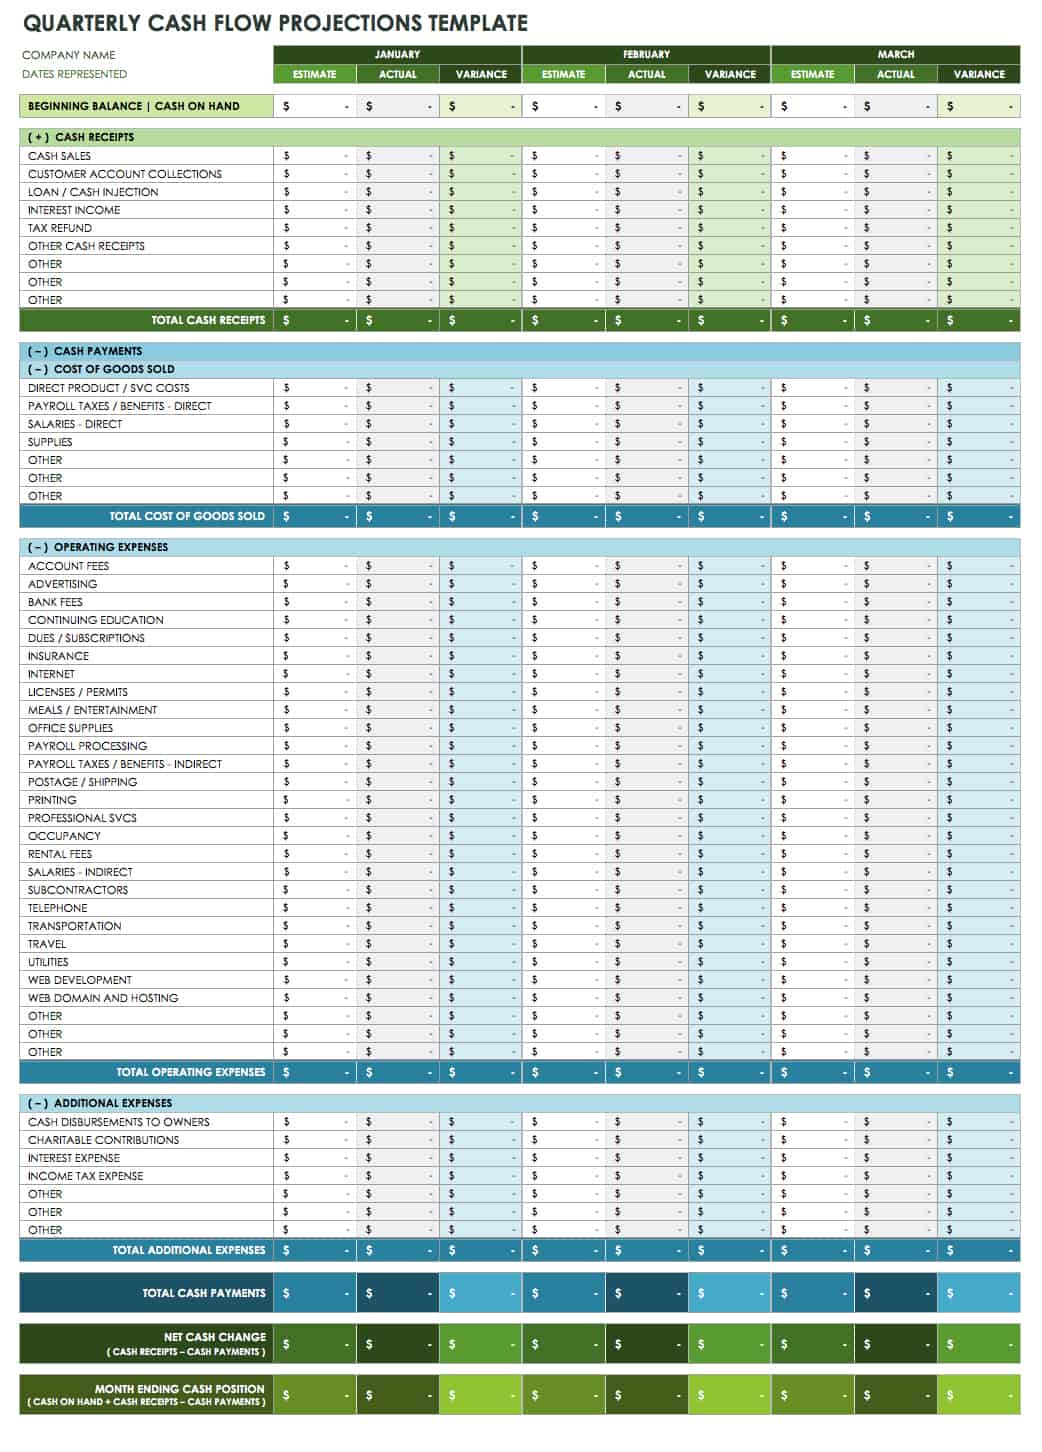
Download Quarterly Cash Flow Projections Template
Cash flow projection templates can cover a variety of time frames, including the quarterly format offered here. Quarterly projections are useful for new businesses and those wanting to align cash flow projections with upcoming goals and business activities. Use the template to create projections and then compare the variance between estimated and actual cash flows.
Cash Flow Analysis Template
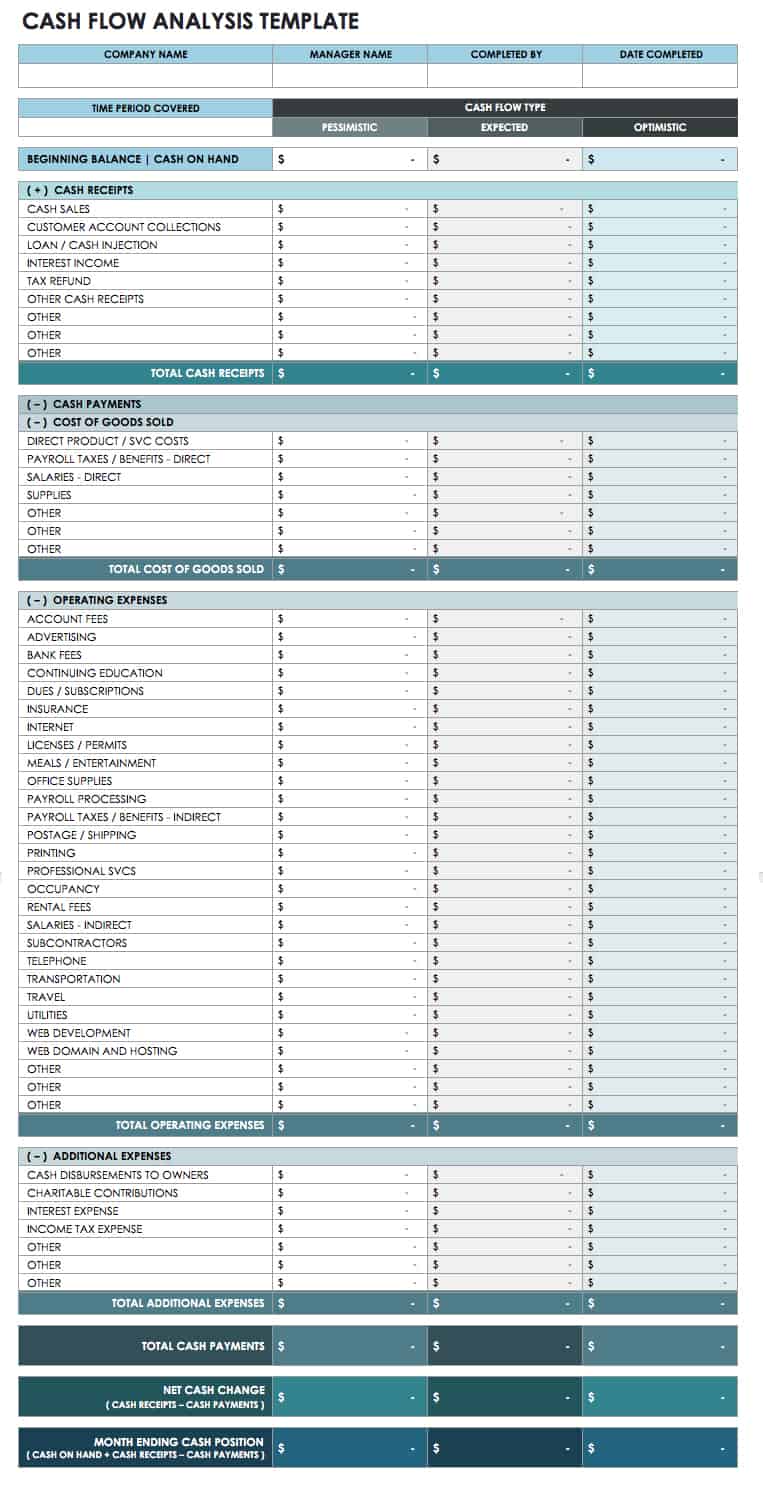
Download Cash Flow Analysis Template
You can use this template to perform a cash flow sensitivity analysis in order to anticipate shortfalls and help your business maintain a positive cash position. This analysis can help you make more accurate cash flow predictions and inform your business decisions.
Discounted Cash Flow Template
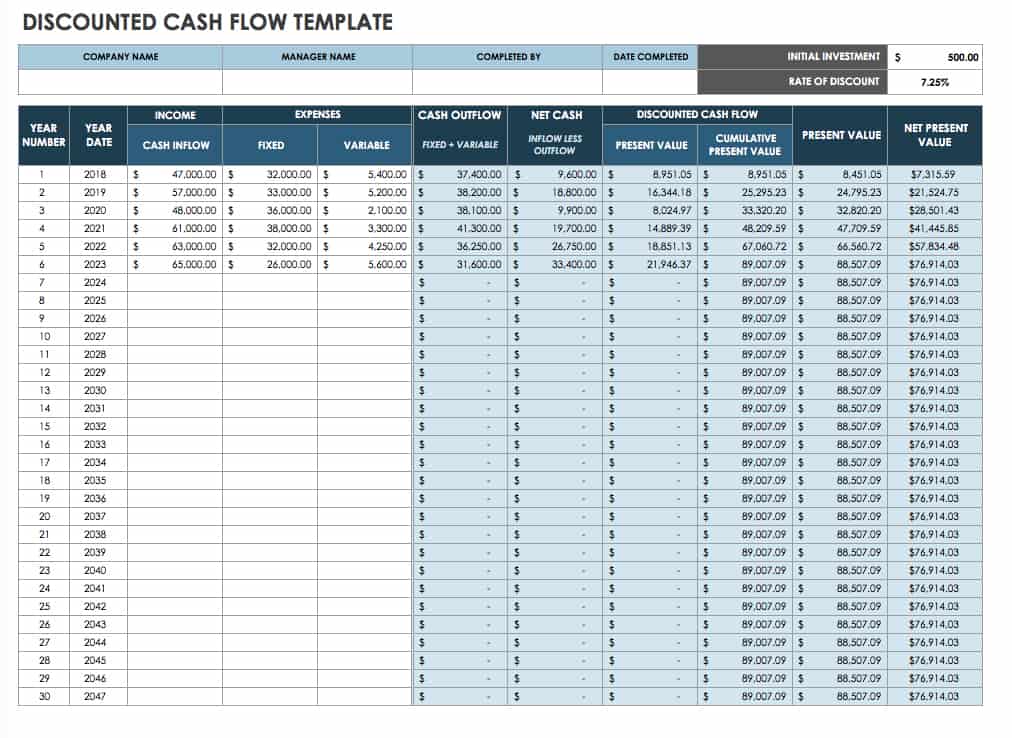
Download Discounted Cash Flow Template
This template allows you to conduct a discounted cash flow analysis to help determine the value of a business or investment. Enter cash flow projections, select your discount rate, and the template calculates the present value estimates. This template is a useful tool for both investors and business owners.
Nonprofit Cash Flow Projection Template
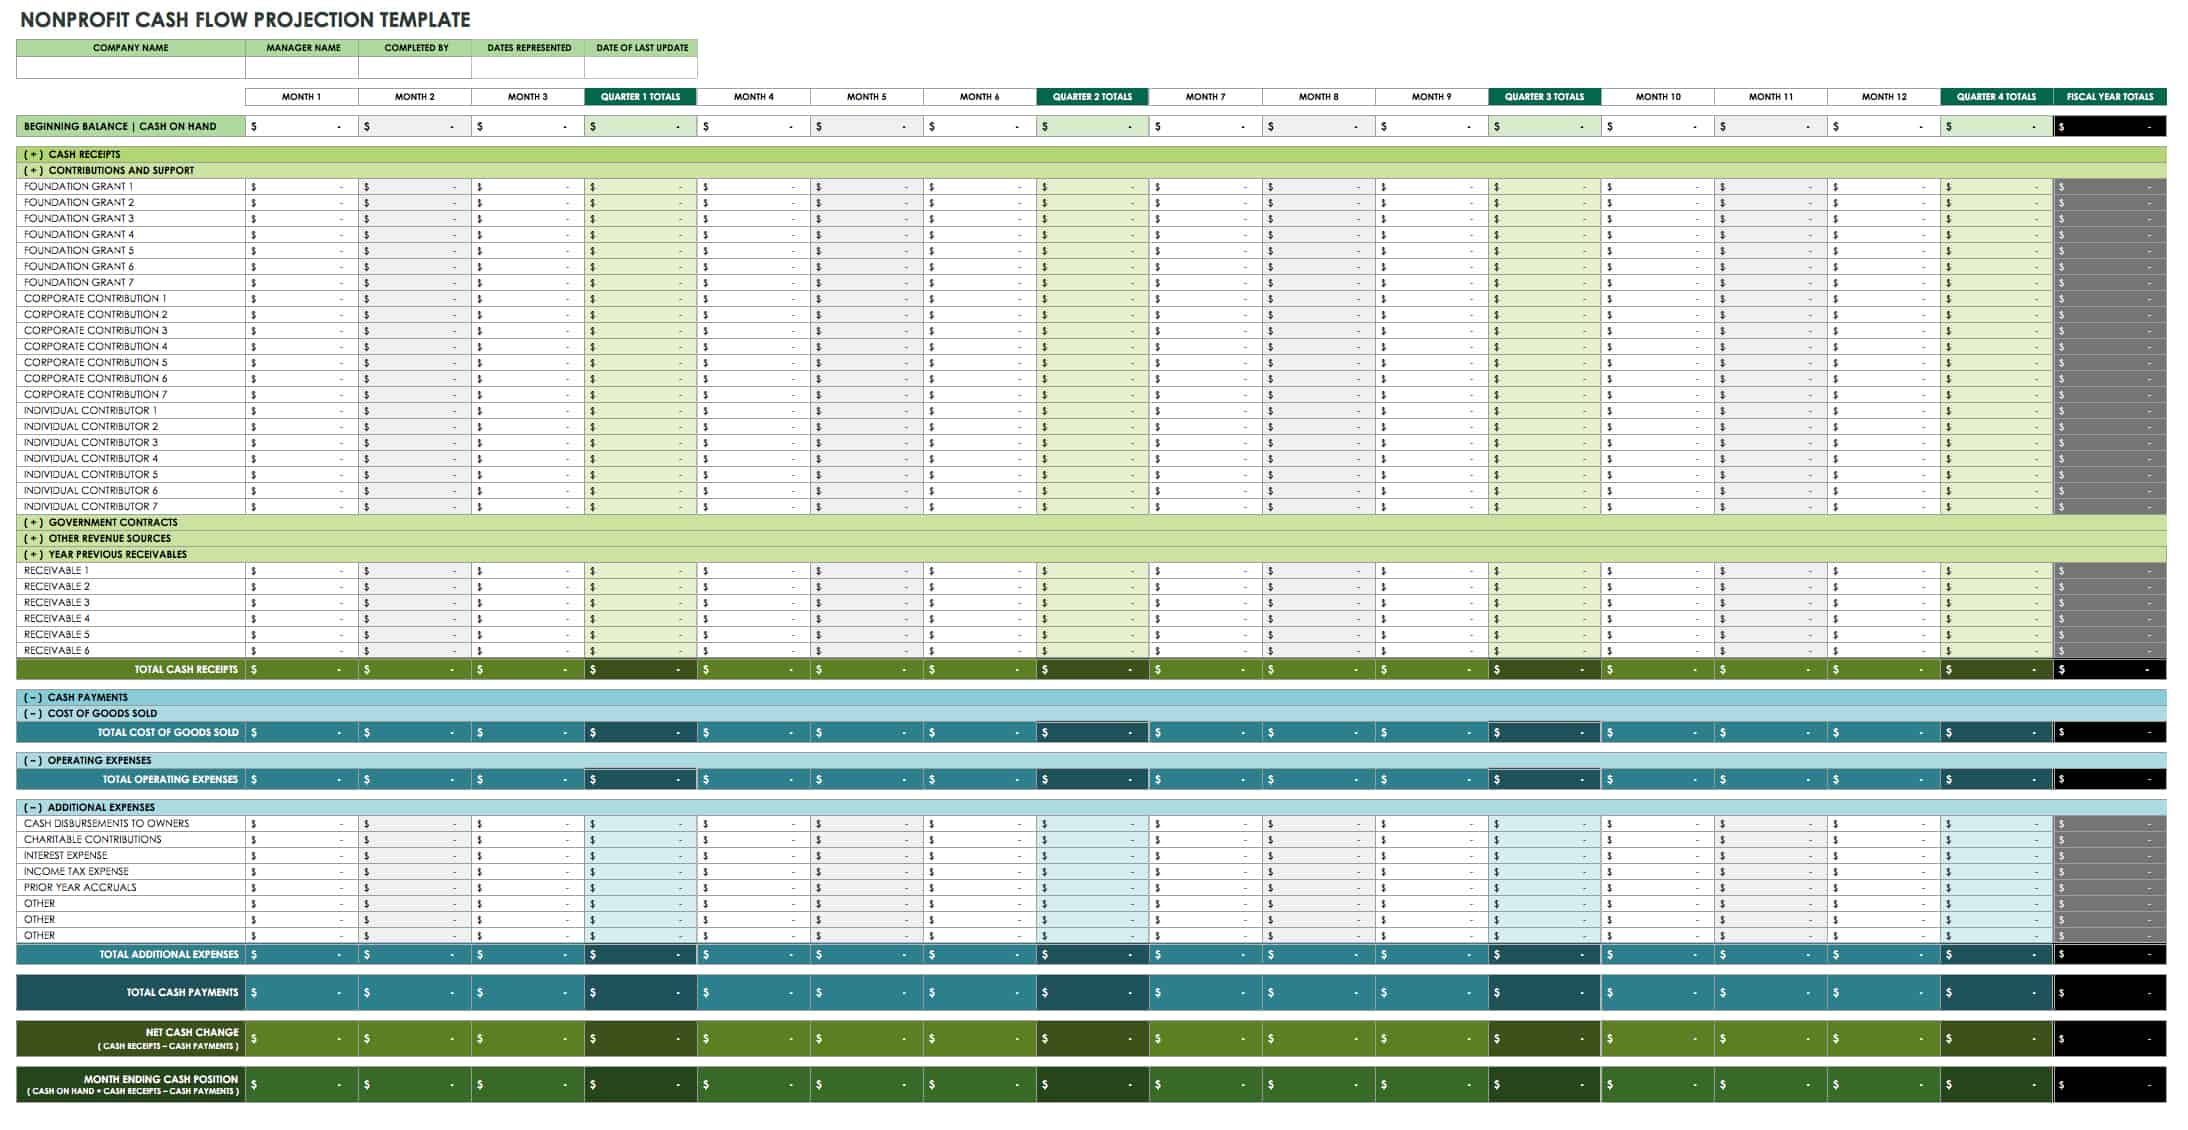
Download Nonprofit Cash Flow Projection Template
This template is designed with nonprofit organizations in mind and includes some common income sources, such as donations and grants, as well as expenditures. The template covers a 12-month period and makes it easy to see annual and monthly carryover so that you can track a rolling cash balance. Create a detailed list of all receipts and disbursements that are relevant to your organization.
Personal Cash Flow Template
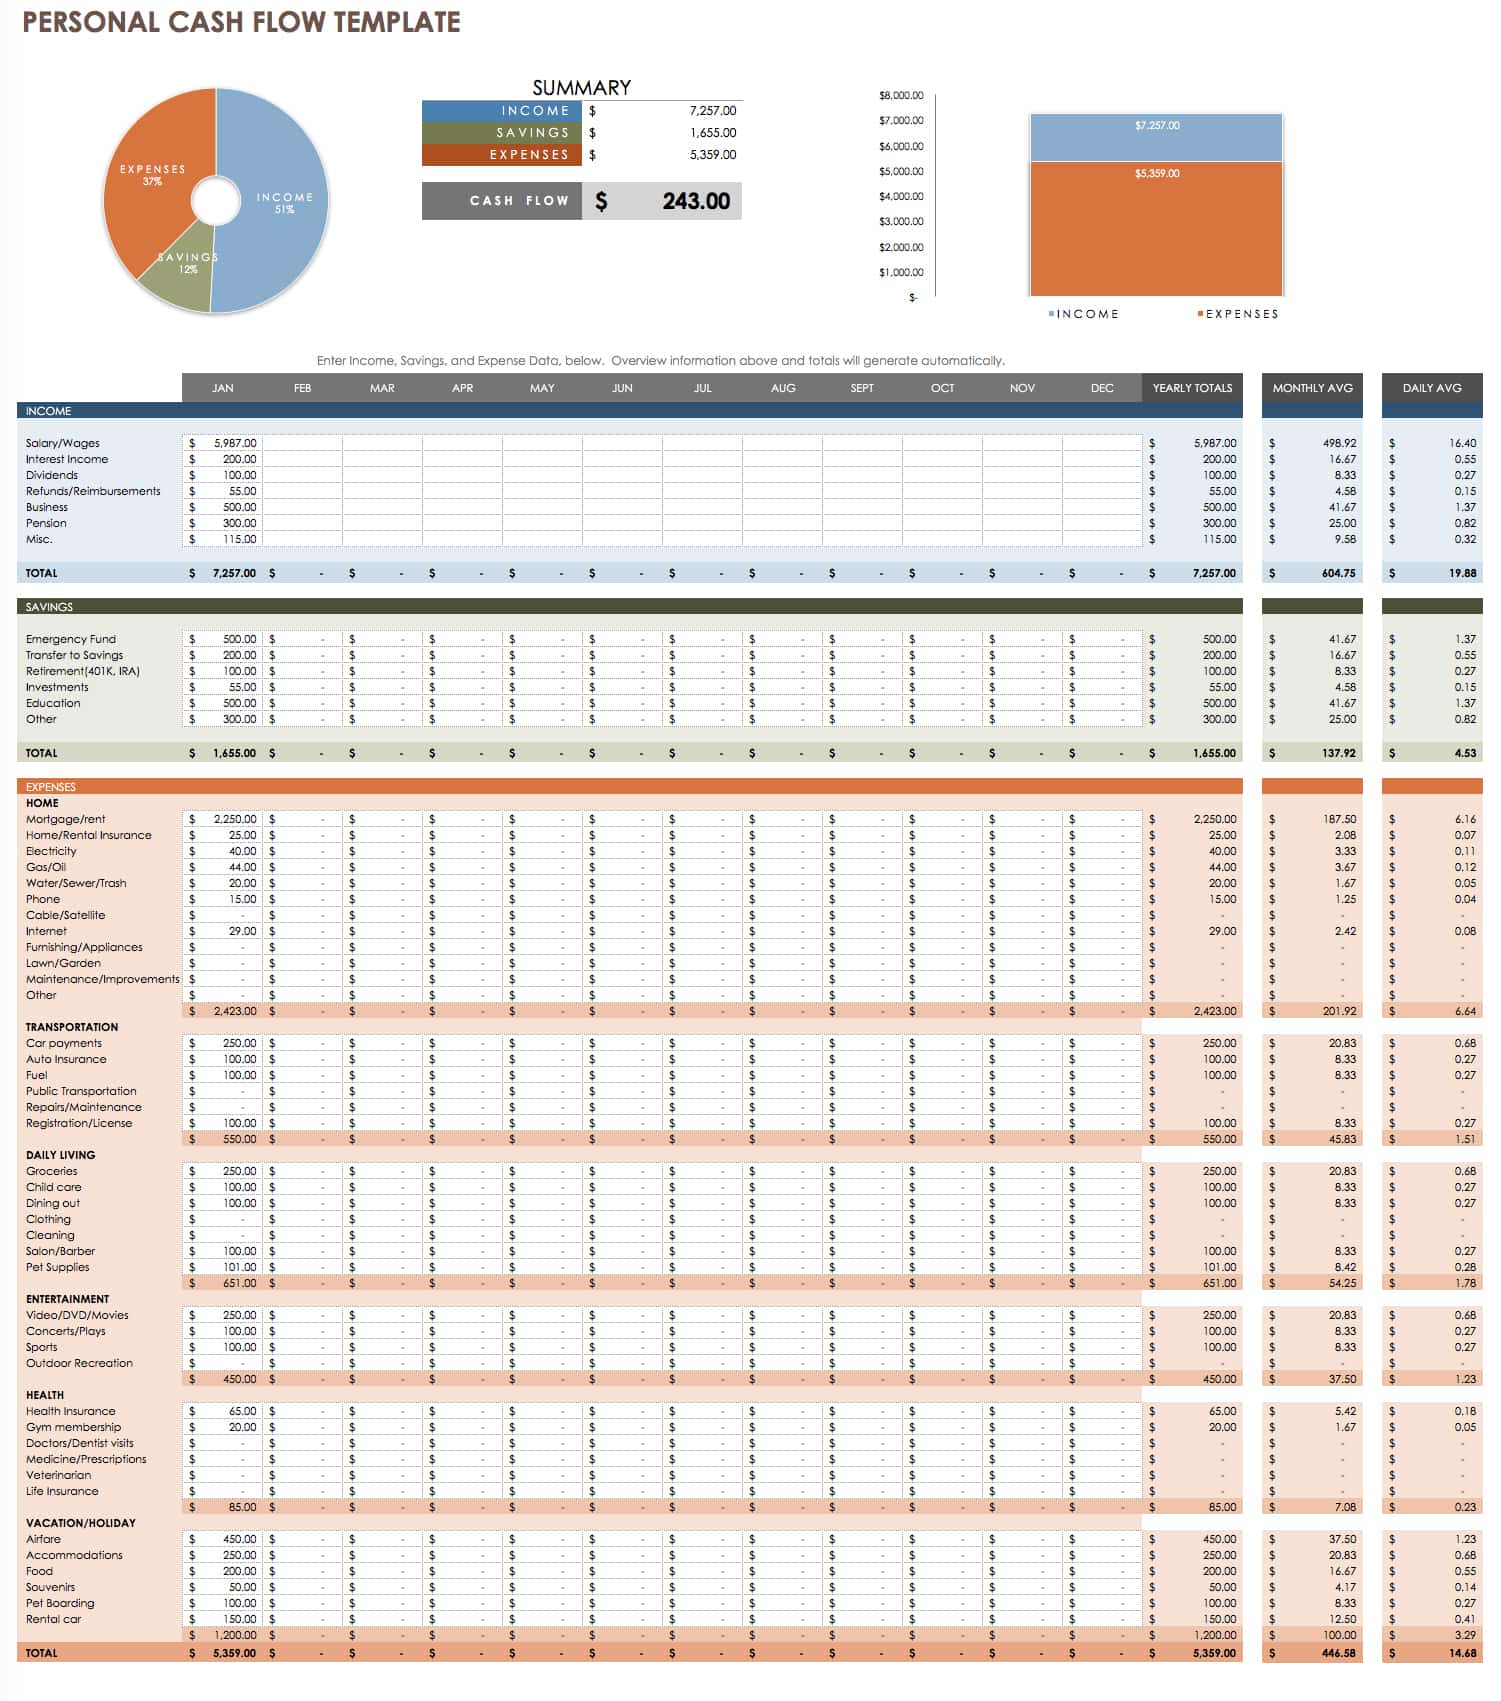
Download Personal Cash Flow Template
Individuals can manage their personal cash flow with this free template. The simple layout makes it easy to use and provides a financial overview at a glance. Keep track of how you are spending money to gain more control over your financial habits and outlook.
Trial Balance Worksheet
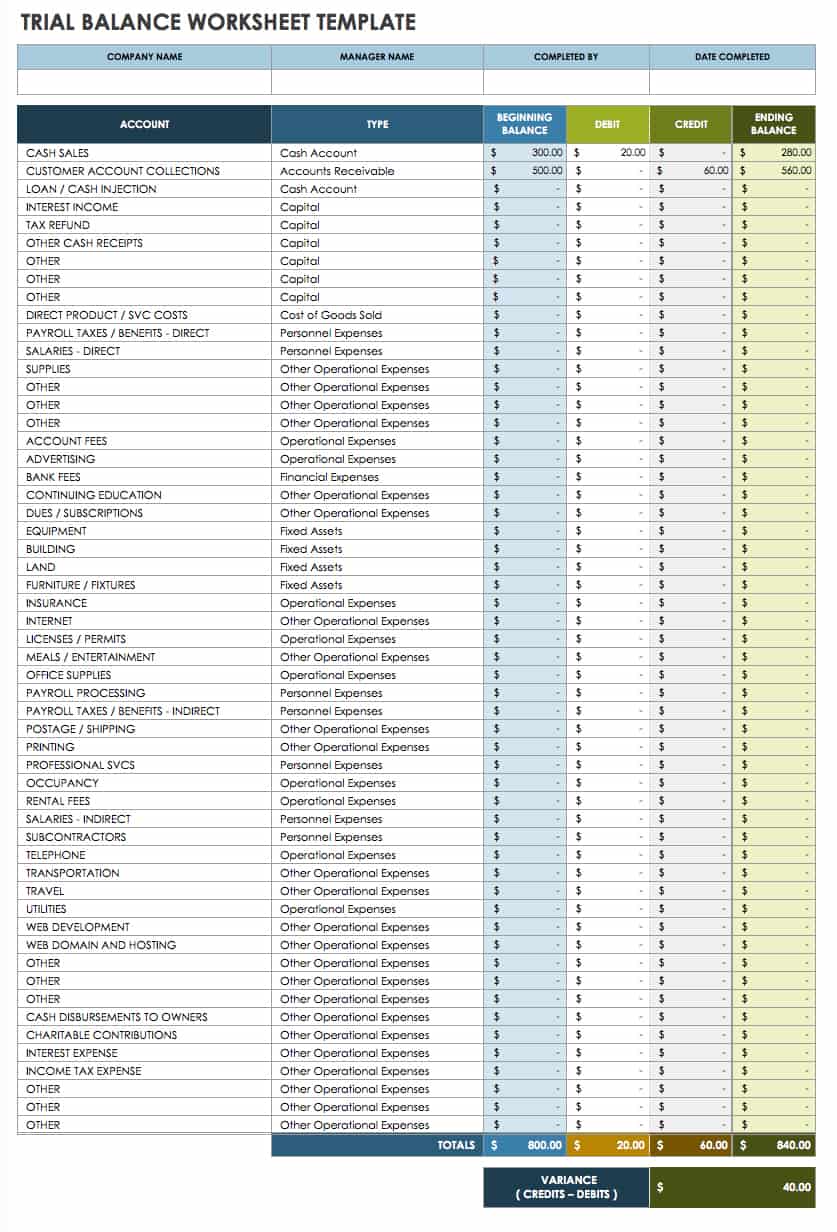
Download Trial Balance Worksheet
Excel | Smartsheet
Use this trial balance template to check your credit and debit balances at the end of a given accounting period, and to support your financial statements. The template shows ending balances for specific accounts, as well as total amounts for the activity period and the overall difference. This is a simple worksheet that you can customize to reflect your business type and the products or services it offers.
Excel Bookkeeping and Cash Flow Templates
To help you get started creating a cash flow statement or forecast, we’ve included a variety of customizable templates that you can download for free. Simply adjust your chosen template to fit your specific goals and the intended audience. Each template offers a clean, professional design and is intended to save you time, boost efficiency, and improve accuracy. Just enter your financial data, and the templates will perform automatic calculations for you to analyze. By combining your cash flow statement with a balance sheet, income statement, and other forms, you can manage cash flow and get a comprehensive understanding of business performance. Smartsheet offers additional Excel templates for financial management, including business budget templates.
Elements of a Cash Flow Statement
A cash flow statement is typically divided into the following sections to distinguish among different categories of cash flow:
- Operating Activities: Cash flows in this section will follow a company’s operating cycle for an accounting period and include things like sales receipts, merchandise purchases, salaries paid, and various operating expenses.
- Investing Activities: Some examples of investing activities include buying or selling assets, making loans and collecting payments, and generating cash inflows or outflows from other investments.
- Financing Activities: This section may include activities such as receiving money from creditors or shareholders, repaying loans and paying dividends, and selling company stock, as well as other activities that impact equity and long-term liabilities.
A statement of cash flows can summarize information for any accounting period, but if you’re starting a new business or planning for the months ahead, creating a cash flow projection can help you anticipate how much money your business will have coming in and going out during a future time frame.
Creating a Cash Flow Forecast
Projecting future cash flows can give you greater financial control, provide a deeper understanding of a company’s performance, help identify shortfalls in advance, and support business planning so that activities and resources are properly aligned. New businesses trying to secure a loan may also require a cash flow forecast.
In order to set yourself up for success, it’s imperative to be realistic when forecasting cash flows. You can build your projections on a foundation of key assumptions about the monthly flow of cash to and from your business. For instance, knowing when your business will receive payments and when payments are due to outside vendors allows you to make more accurate assumptions about your final funds during an operating cycle. Estimated cash flows will always vary somewhat from actual performance, which is why it’s important to compare actual numbers to your projections on a monthly basis and update your cash flow forecast as necessary. It’s also wise to limit your forecast to a 12-month period for greater accuracy (and to save time). On a monthly basis, you can add another month to create a rolling, long-term projection.
A cash flow forecast may include the following sections:
- Operating Cash: The cash on hand that you have to work with at the start of a given period. For a monthly projection, this is the cash balance available at the start of a month.
- Revenue: Depending on the type of business, revenue may include estimated sales figures, tax refunds or grants, loan payments received or incoming fees. The revenue section covers the total sources of cash for each month.
- Expenses: Cash outflows may include your salary and other payroll costs, business loan payments, rent, asset purchases, and other expenditures.
- Net Cash Flow: The closing cash balance, which reveals whether you have excess funds or a deficit.
Keep in mind that while many costs are recurring, you also need to consider one-time costs. Additionally, you should plan for seasonal changes that could impact business performance, and upcoming promotional events that may boost sales. Depending on the size and complexity of your business, you may want to delegate the responsibility of creating a cash flow forecast to an accountant. However, small businesses can save time and money with a simple cash flow projections template.
A More Collaborative Cash Flow Statement Template in Smartsheet
Using a template is essential to helping you get started managing your organization’s financials quickly. But, creating and managing your cash flow statement may require multiple stakeholders to weigh in and make updates. That’s why it’s important to find a template with more advanced functionality like notifications and reminders and enhanced collaboration features to ensure everyone is kept in the loop. One such template is the cash flow statement template in Smartsheet.
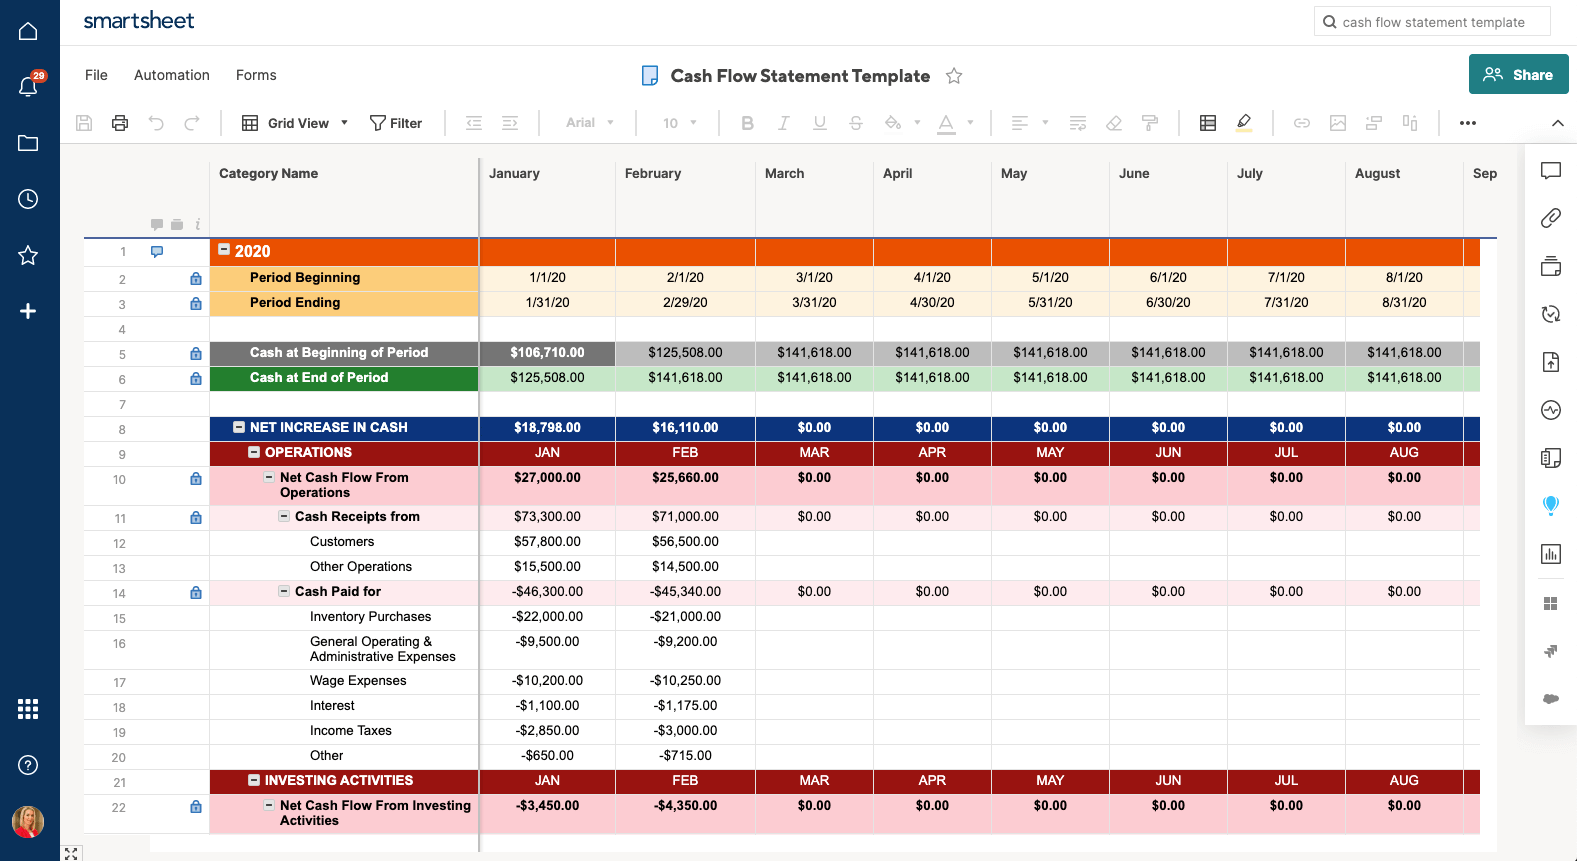
A Smartsheet template can improve how your team tracks and reports on cash flow — use row hierarchy to sum line items automatically, checkboxes to track stakeholder approval, and attachments to store item details directly to the rows in your sheet. Easily create reports to roll up annual, quarterly, or monthly cash flow details so you’ll always have a real-time view of the financial health of your business.
See how easy it is to track and manage your cash flow statement with a template in Smartsheet.
Create a Cash Flow Statement in Smartsheet
A Better Way to Manage Accounting and Finance Processes for Companies of All Sizes
Empower your people to go above and beyond with a flexible platform designed to match the needs of your team — and adapt as those needs change.
The Smartsheet platform makes it easy to plan, capture, manage, and report on work from anywhere, helping your team be more effective and get more done. Report on key metrics and get real-time visibility into work as it happens with roll-up reports, dashboards, and automated workflows built to keep your team connected and informed.
When teams have clarity into the work getting done, there’s no telling how much more they can accomplish in the same amount of time. Try Smartsheet for free, today.
Free Excel Cash Flow Template from Xlteq
Download Xlteq’s free Cash Flow Template to assist with managing and reporting for your business. This free cash flow template shows you how to calculate cash flow using a simple cash flow statement. Our cash flow template helps measure your company’s financial performance. It displays the cash that your company has on hand after deducting elements such as salaries, rent, purchase of assets (e.g. equipment), and costs from the company income. In other words, it measures your company’s ability to manage the cash that’s available at any given time.
Free Cash Flow = Operating Cash Flow – Capital Expenditures
After downloading the Excel file, simply enter your own information in all the white cells which will automatically produce an annual output.
The downloadable Excel file includes five tabs.
- Company Information : Name and start date
- Forecast : Expenditure and income
- Actuals : Real data accross the year
- Summary : Compare Forecast verses Actual
- Help : Assistance
Download the Free Cash Flow Template
Download
Additional Resources
Thank you for checking out Xlteq’s free Cash Flow template, in addition to this we offer a range of sevices that might be helpful to your buiness:
- Excel Development
- Access Database Development
- Ongoing Support
We would be delighted to hear from you to discuss your Excel spreadsheet or Access database project.
Contact Us
You can call us now on 020 3817 6945 or fill out the form below.
Содержание
- Пример анализа Cash Flow в комбинированной диаграмме Excel
- Комбинированная диаграмма для визуального анализа Cash Flow в Excel
- Сборка комбинированной диаграммы в Excel пошагово
- Cash Flow Statement Template
- Cash Flow Statement Template
- Download
- Other Versions
- Description
- Cash Flow Statement Essentials
- Operating Activities
- Investing Activities
- Financing Activities
- Free Cash Flow Forecast Templates
- What Is a Cash Flow Forecast Template?
- Simple Cash Flow Forecast Template
- Small Business Cash Flow Projection Template
- 12-Month Cash Flow Forecast Template
- Cash Flow Forecast Template
- Daily Cash Flow Forecast Template
- Quarterly Cash Flow Projections Template
- Three-Year Cash Flow Forecast Template
- Discounted Cash Flow Forecast Template
- Nonprofit Cash Flow Projection Template
- Personal Cash Flow Forecast Template
- Creating a Cash Flow Forecast
- The Benefits of Cash Flow Forecasting
- Tips for Improving Cash Flow Forecasting
- Discover a Better Way to Manage Cash Flow Forecasts and Finance Operations
Пример анализа Cash Flow в комбинированной диаграмме Excel
Отчет Cash Flow позволяет спрогнозировать финансовые показатели в будущем и предотвратить кассовые разрывы. Поэтому он очень важен и так популярен. Но среди стандартных диаграмм Excel нет подходящих инструментов для визуализации данных по отчету Cash Flow. Вашему вниманию предлагается необычный пример создания комбинированной диаграммы для визуального анализа циркуляции денежного потока на предприятии.
Комбинированная диаграмма для визуального анализа Cash Flow в Excel
Так как в арсенале стандартных диаграмм Excel нет подходящего инструмента для анализа отчета по Cash Flow, будем комбинировать свой график из уже имеющихся средств. В данном примере используется комбинация из трех отдельных диаграмм:
- Пузырьковой (Bubble).
- Круговой (Pie)
- Комбинированной из двух Кольцевых (Doughnut).
Подробное описание предназначения и стратегии использования по каждому пункту:
- Пузырьковая диаграмма – предназначена для визуального сравнения величины более двух значений.
- Круговая – отображает отношение нескольких частей к целому общему значению. В этике дизайнеров и разработчиков визуальных отчетов не рекомендуется использовать круговую диаграмму для сравнения более чем 2 значения. Но в нашей творческой комбинации ее мы будем использовать для отображения экспонированного значения перевыполнения финансового плана больше 100% на одной и той же диаграмме. Хотя по сути все сохраняется в рамках этики дизайна визуализации, так как используется 2 значения: 1– процент доли перевыполнения плана по отношению к 2 – общего целого значения 100%.
- Кольцевая – так же, как и круговая предназначена для отображения нескольких долей по отношению к целому общему значению. Но в отличии от круговой диаграммы может содержать несколько рядов данных. Это отличие нам сильно пригодится в разработке дизайна визуализации данных для интерактивной презентации.
Одно из важнейших предназначений отчета по Cash Flow – это предотвращение кассовых разрывов. Поэтому наш комбинированный график будет содержат в центре большую комбинированную диаграмму, информирующую о проценте выполнения плана продаж. Чем выше этот показатель, тем меньше вероятность кассового разрыва. Схема как будет выглядеть будущий дизайн визуализации:
Техническое задание для разработчика определено, показано и описано. Теперь можно переходить к процессу реализации задачи.
Сборка комбинированной диаграммы в Excel пошагово
Разберем данный пример в стиле пошаговой инструкции:
- Создадим кольцевую шкалу из 58-ми делений:

- Проектируем дизайн для делений на кольцевой шкале:
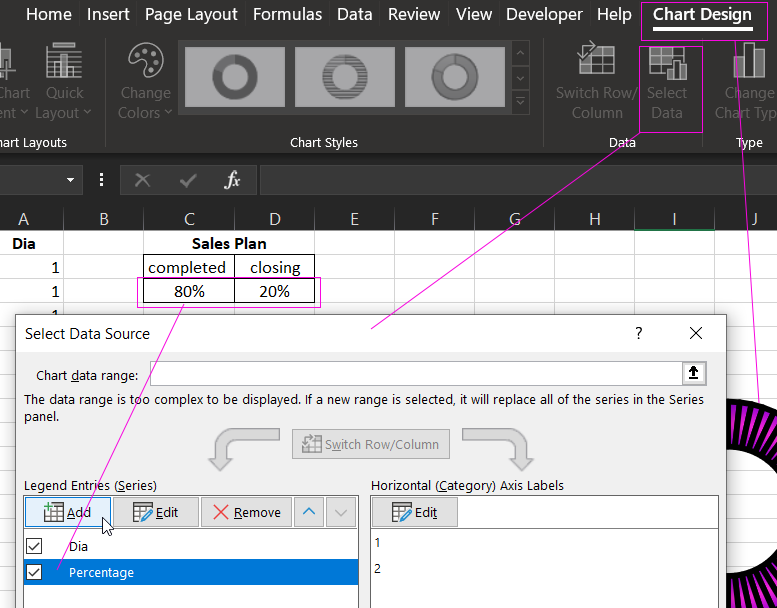
- Добавляем новую серию значений для комбинирования диаграммы:
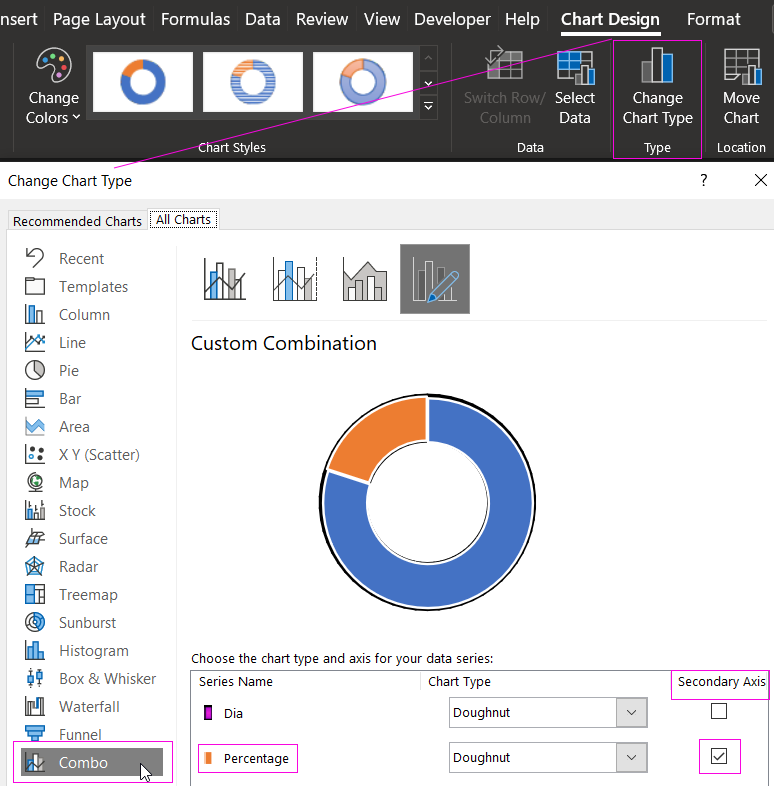
- Настраиваем комбинацию в окне изменения типа. Обратите внимание на то, что нужно указать для второй серии значений расположение по вспомогательной оси координат. Таким образом две кольцевые диаграммы будут наложены как на разных слоях:
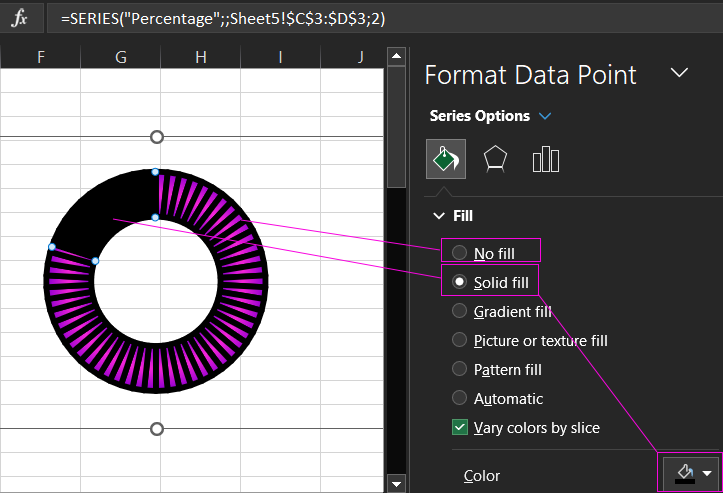
- Изменяем дизайн для второй кольцевой диаграммы, дополнительно наложенной сверху с помощью комбинирования типов в Excel. Синею заливку изменяем на прозрачную, а оранжевую на черную. И не забудем убрать контуры. Комбинированная диаграмма из двух кольцевых – готова:
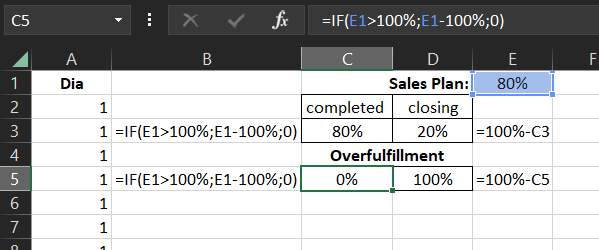
- Изменяем значения на формулы в таблице показателей выполнения плана продаж. А также создаем еще одну табличку с формулами для исходных значений круговой диаграммы:
- На основе второй таблички создаем круговую диаграмму, которая будет экспонировать на шкале долю соответственной значениям при превышении выполнения плана продаж:
- Изменяем цвета заливок круговой диаграммы и накладываем ее на комбинированную состоящую из двух кольцевых. Незабываем подровнять размеры. Синий цвет меняем на прозрачный, а оранжевый делаем черной, но полупрозрачной заливкой и удаляем все контуры:
- Тестируем и наслаждаемся готовым результатом на черном фоне и проверяем как все работает при изменении исходного значения в ячейке E1:
- Добавляем пузырьковый график как последнюю комбинацию в общей композиции презентации отчета по циркуляции движения денежных средств:
Дальше все красиво и талантливо оформляем для создания профессиональной инфографики с интерактивными возможностями. Все зависит от вашего воображение, а оно зависит от вдохновения:
В широком ассортименте инструментов для визуализации данных в Excel есть все и даже больше, чем кажется на первый взгляд. Необходимо лишь немного опыта, а воображение придет с творческим вдохновением. Смело скачивайте данный шаблон и вдохновляйтесь, изменяйте под свои потребности и улучшайте. Нет предела совершенству, не существует границ между душой и творчеством.
Источник
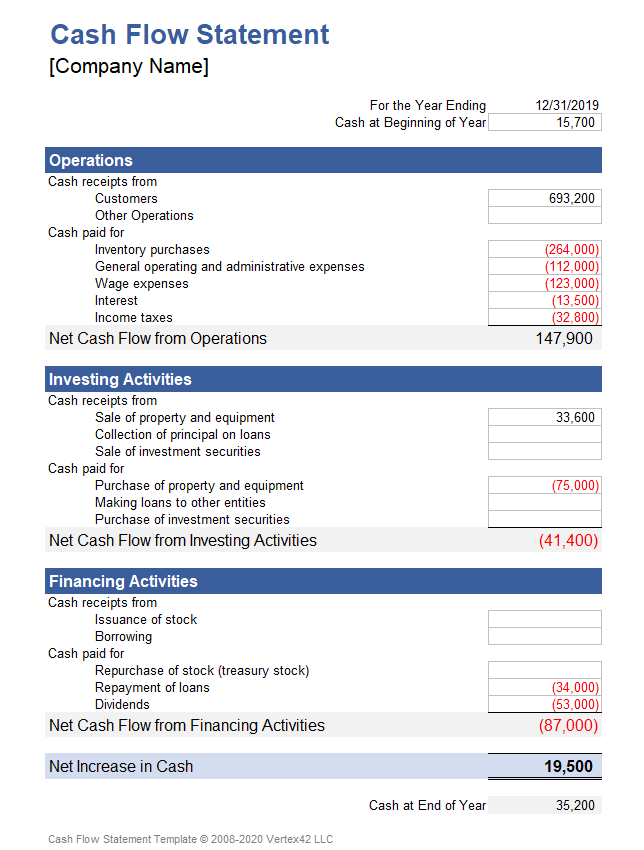
Cash Flow Statement Template
The Cash Flow Statement, or Statement of Cash Flows, summarizes a company’s inflow and outflow of cash, meaning where a business’s money came from (cash receipts) and where it went (cash paid). By «cash» we mean both physical currency and money in a checking account. The cash flow statement is a standard financial statement used along with the balance sheet and income statement. The statement usually breaks down the cash flow into three categories including Operating, Investing and Financing activities. A simplified and less formal statement might only show cash in and cash out along with the beginning and ending cash for each period.
To perform a cash flow analysis, you can compare the cash flow statement over multiple months or years. You can also use the cash flow analysis to prepare an estimate or plan for future cash flows (i.e. a cash flow budget). This is important because cash flow is about timing — making sure you have money on hand when you need it to pay expenses, buy inventory and other assets, and pay your employees.
A cash flow analysis is not the same as the business budget or profit and loss projection which are based on the Income Statement. However, for a small uncomplicated business operating mainly with cash instead of credit accounts, there may seem to be little difference.
Cash Flow Statement Template
Download
License: Private Use (not for distribution or resale)
«No installation, no macros — just a simple spreadsheet» — by Jon Wittwer
Other Versions
Description
This cash flow statement was designed for the small-business owner looking for an example of how to format a statement of cash flows. The categories can be customized to suit your company’s needs. If you don’t want to separate the «cash receipts from» and the «cash paid for» then you can just delete the rows containing those labels and reorder the cash flow item descriptions as needed.
The spreadsheet contains two worksheets for year-to-year and month-to-month cash flow analysis or cash flow projections.
Update 9/30/2021: You can now try the cash flow template in Spreadsheet.com which uses a set of categories based on common public stock financial statements.
Cash Flow Statement Essentials
Operating Activities
Operating activities make up the day-to-day business, like selling products, purchasing inventory, paying wages, and paying operating expenses. Perhaps the most important line of the cash flow statement is the Net Cash Flow from Operations. This section of the statement is associated with the Current Assets and Current Liabilities sections of the Balance Sheet, as well as the Revenue and Expenses section of the Income Statement.
Investing Activities
Investing activities include buying and selling assets like property and equipment, lending money to others and collecting the principal, and buying/selling investment securities. This section of the statement is associated with the Long-Term Assets section of the balance sheet.
Financing Activities
Financing activities include borrowing from creditors and repaying loans, issuing and repurchasing stock, and collecting money from owners/investors, and payment of cash dividends. This section of the statement is associated with the Long-Term Liabilities and Owners’/Stockholders’ Equity from the Balance Sheet.
I’m not going to try to explain how to prepare or analyze the cash flow statement other than to say that if you have the records of all the cash transactions, then the preparation can be done using the simple method of categorizing the receipts and payments into the three categories listed above. The indirect method can be used to create the statement of cash flows from the information in the balance sheet and income statement, but I’ll leave that explanation for the textbooks. For more information, see the references below.
Источник
Free Cash Flow Forecast Templates
We’ve compiled the most useful free cash flow forecast templates, including those for small businesses, nonprofits, and personal cash flow forecasting, as well tips for performing a cash flow forecast.
What Is a Cash Flow Forecast Template?
A cash flow forecasting template allows you to determine your company’s net amount of cash to continue operating your business. The template provides a way to examine day-by-day, month-by-month, quarter-by-quarter, or year-over-year projected cash receipts and cash payments as compared to your operating expenses and other outflows.
Use the preset criteria in a template to take the guesswork out of cash flow forecast requirements. You can then use the forecast to provide your company (or third parties) with a clear picture of your projected business costs. While cash flow forecasting allows you to look at projected cash flow, you can also track the actual cash flow for any chosen time period (i.e., daily, weekly, monthly, quarterly, or yearly).
To learn more about cash flow forecasting and to view examples, visit «How to Create a Cash Flow Forecast, with Templates and Examples.»
Simple Cash Flow Forecast Template
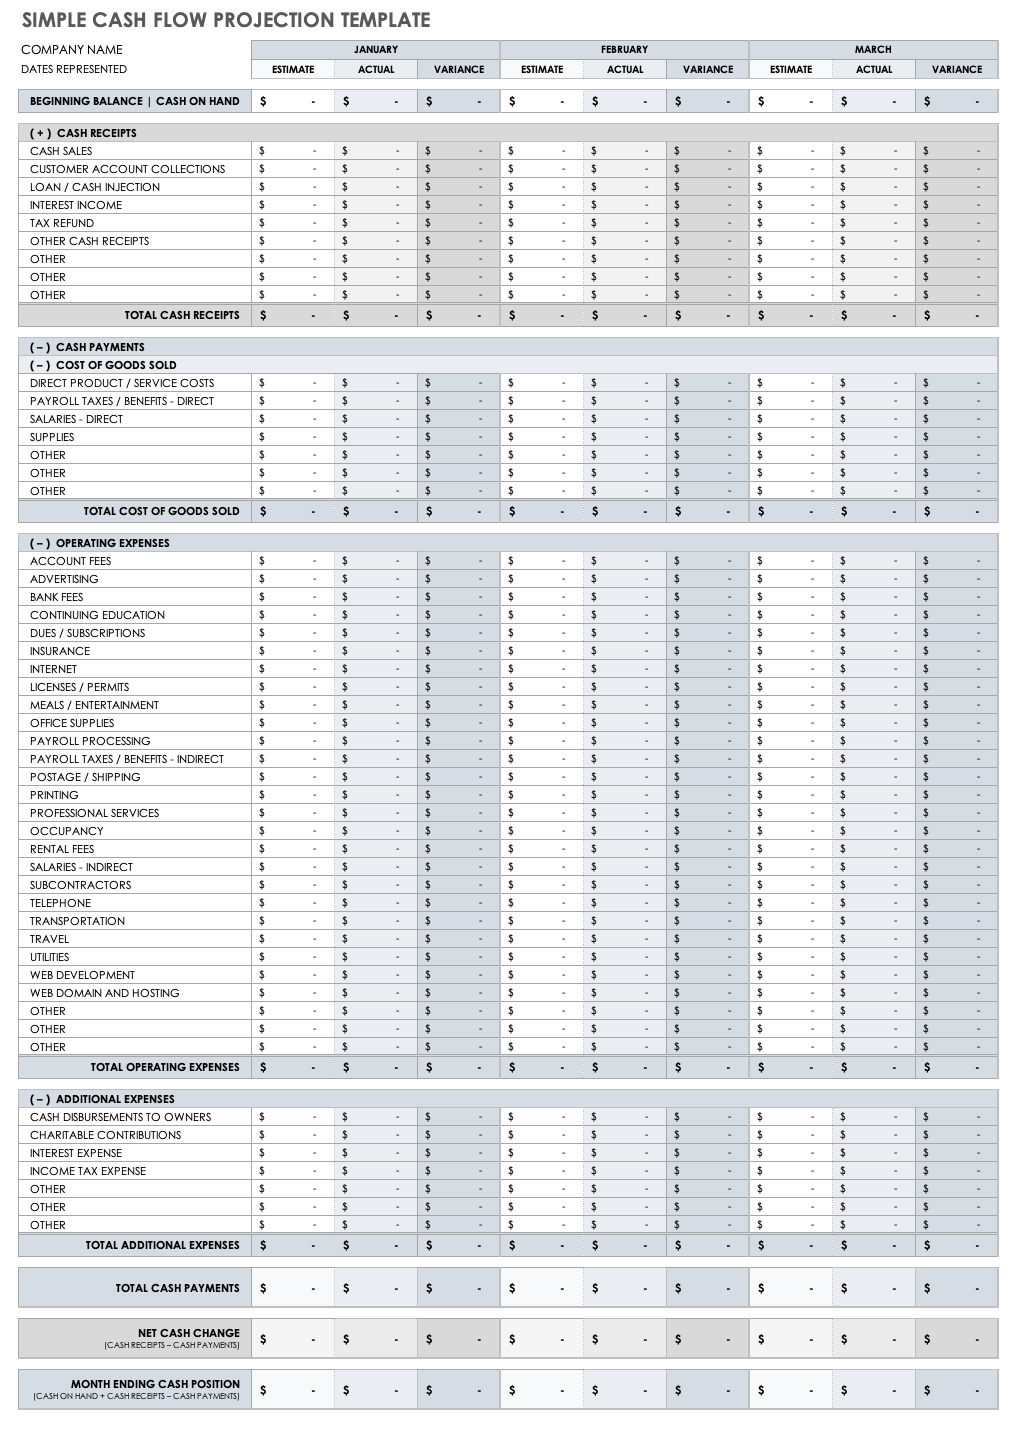
Use this basic template to gain monthly insight into your company’s cash flow and ensure you have sufficient funds to continue operating. Fill in your information for beginning balance (cash on hand), cash receipts and disbursements (R&D), operating expenses, and additional expenses. The template will auto-tally the monthly net cash change and month ending cash position columns. Use this information to forecast how long your cash will last, and whether you need to obtain additional financing.
Download Simple Cash Flow Projection Template — Excel
Small Business Cash Flow Projection Template
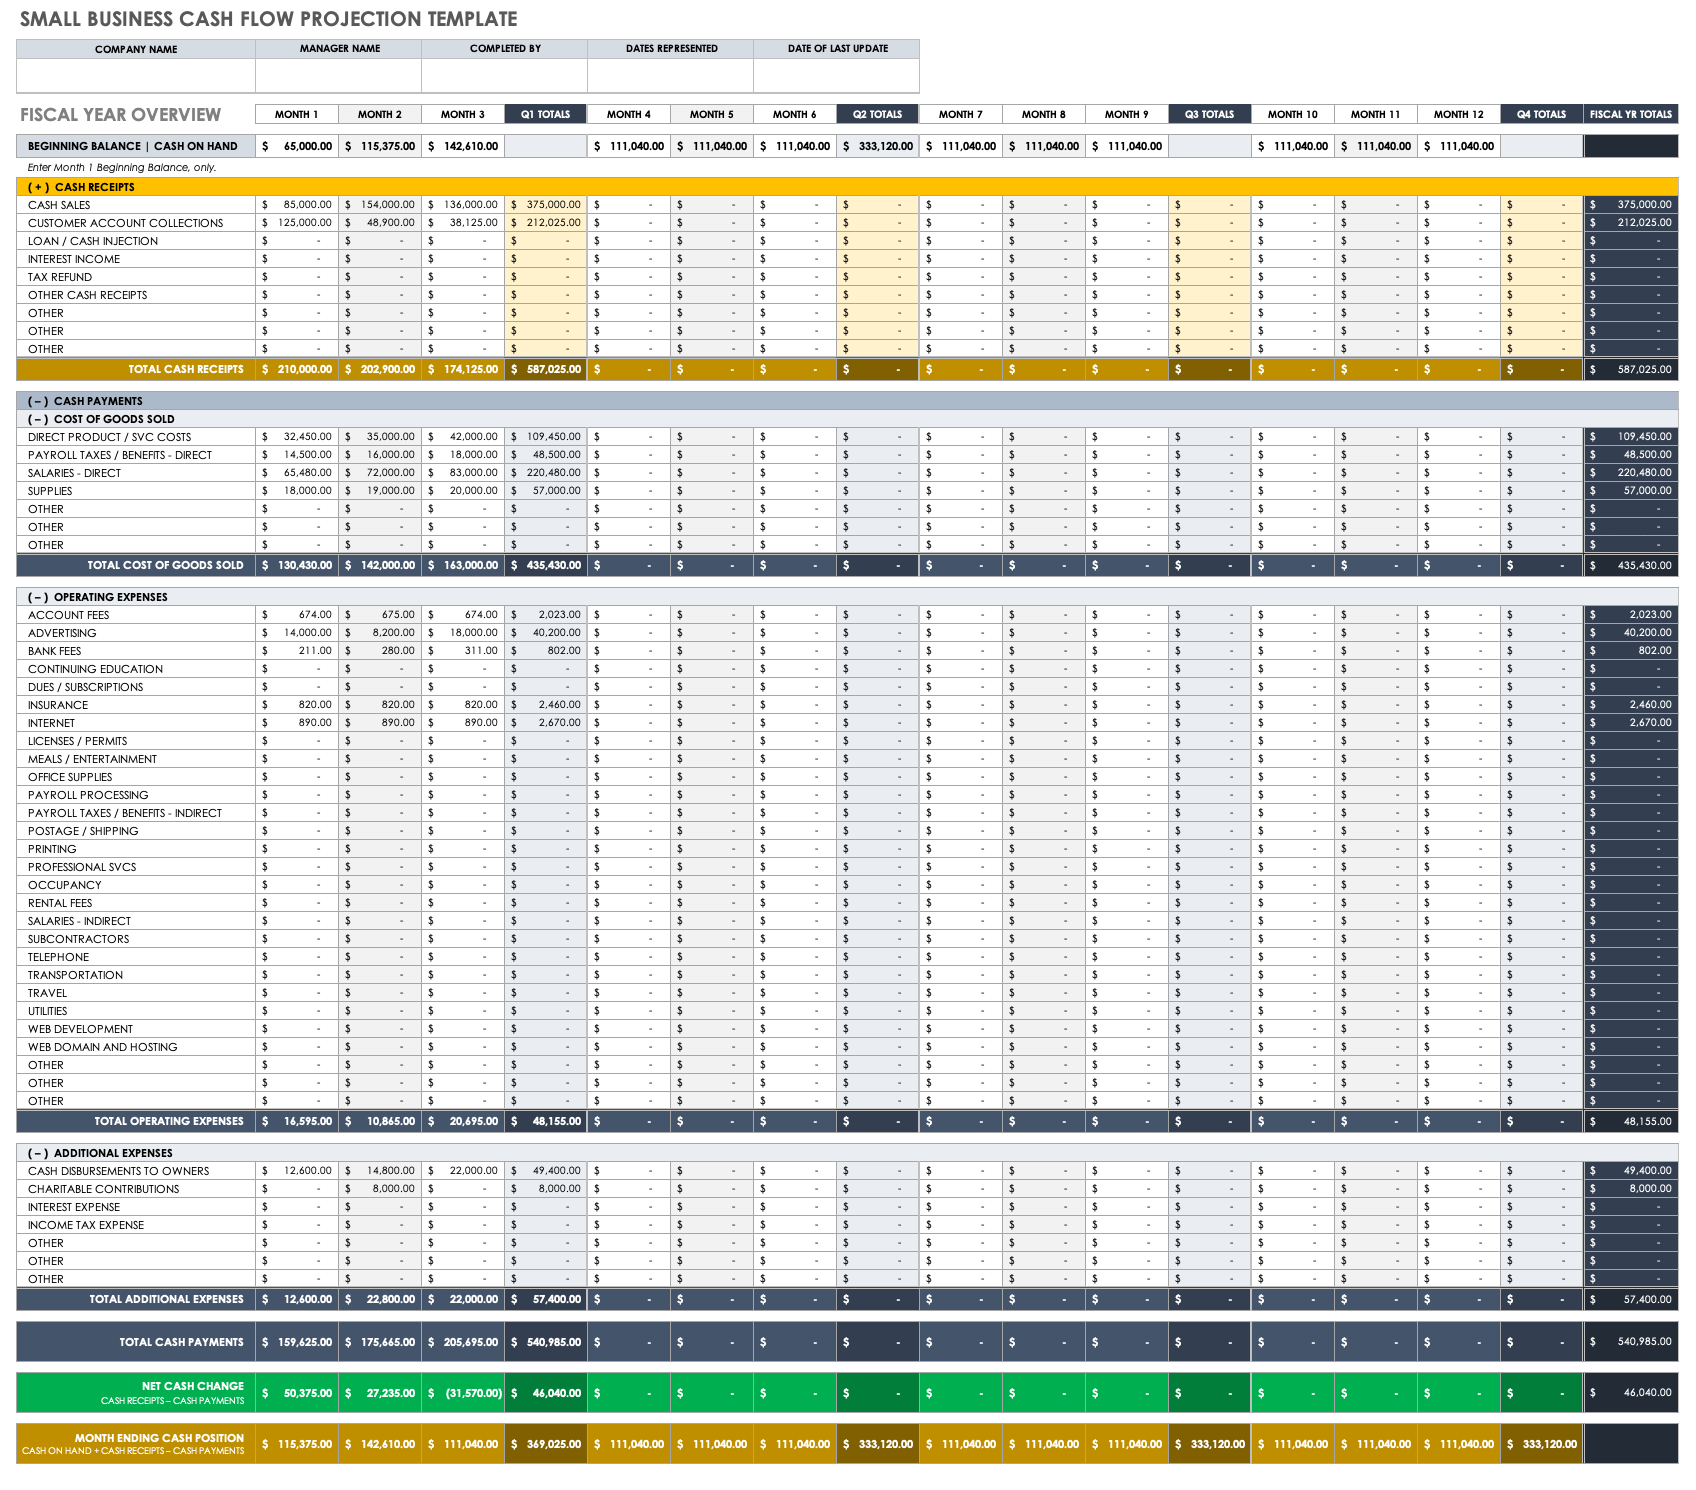
Use this cash flow projection template, designed for small businesses, to determine whether or not your business has adequate cash to meet its obligations. The monthly columns provide a big picture of how long funds should last, and the tallies for cash receipts, cash paid out, and other operating figures allow you to identify any potential shortfalls of your cash balances. This small business cash flow template also works with projected figures for a small business plan.
Download Small Business Cash Flow Projection Template — Excel
12-Month Cash Flow Forecast Template
Track your company’s overall cash flow with this easily fillable 12-month cash flow forecast template. This template includes unique expected and actual cash-on-hand details for the beginning of each month, which you can use to ensure that you can pay all employees and suppliers. Enter cash receipts and cash paid out figures to determine your end-of-month cash position. The monthly details of this forecast template allow you to track — at a glance — any threats to your company’s cash flow.
Download 12-Month Cash Flow Forecast Template
Cash Flow Forecast Template
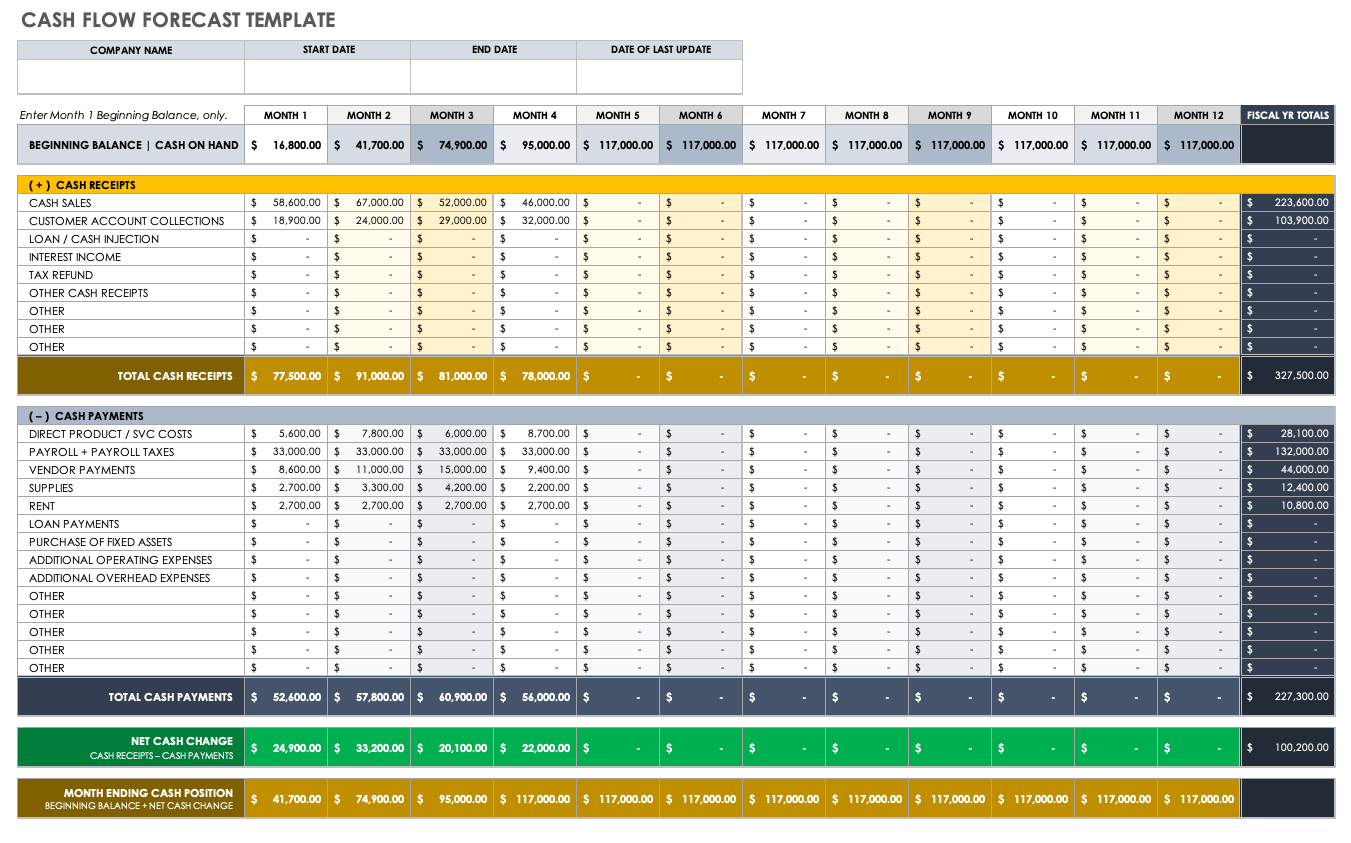
This simple cash flow forecast template provides a scannable view of your company’s projected cash flow. Sections include beginning and ending cash balances, cash sources, cash uses, and cash changes during the month. These details provide an accurate picture of your company’s projected month-by-month financial liquidity. Ultimately, this template will help you identify potential issues that you must address in order for your business to remain on sound fiscal footing.
Download Cash Flow Forecast Template — Excel
Daily Cash Flow Forecast Template
Use this daily cash flow forecast template to get a pulse on your business’ short-term liquidity. Daily cash flow forecasts are particularly helpful in determining that everything is accounted for and for avoiding any shortfalls. The template calculates cash payments against operating expenses to provide a daily net cash change and month-ending cash positions. This template has everything you need to get a day-by-day perspective of your business’s financial performance and outlook.
Download Daily Cash Flow Forecast Template
Quarterly Cash Flow Projections Template
Keep quarterly tabs on your cash flow with this customizable template. Use the quarter-by-quarter tabs to quickly detect any problems with a variety of factors, such as late customer payments and their potential impact on your business. This quarterly cash flow projections template is perfect for determining how any given variable might affect future financial planning.
Download Quarterly Cash Flow Projections Template
Three-Year Cash Flow Forecast Template
Get the big picture of your company’s long-term cash flow with this three-year cash flow forecast template. The spreadsheet provides separate tabs for a current cash flow statement, as well as 12-month cash flow and three-year cash flow projections. Enter year-by-year operations, investing activities, and financing details to see your year-over-year net increases or decreases. You can save this template as an individual file with customized entries, or share it with other business units or departments that need to provide cash flow details.
Download Three-Year Cash Flow Forecast Template
Discounted Cash Flow Forecast Template
Designed around the concept of discounted cash flow (DCF) valuation based on future cash flows, this template allows you to perform an analysis to determine your business’ true value. You’ll find year-by-year rows, their respective incomes (cash inflow), expenses (fixed and variable), cash outflow, net cash, and DCF details (present value and cumulative present value), and actual present value, all of which culminates in net present value. This DCF forecast template is also ideal for determining the value of a potential investment.
Download Discounted Cash Flow Template
Nonprofit Cash Flow Projection Template
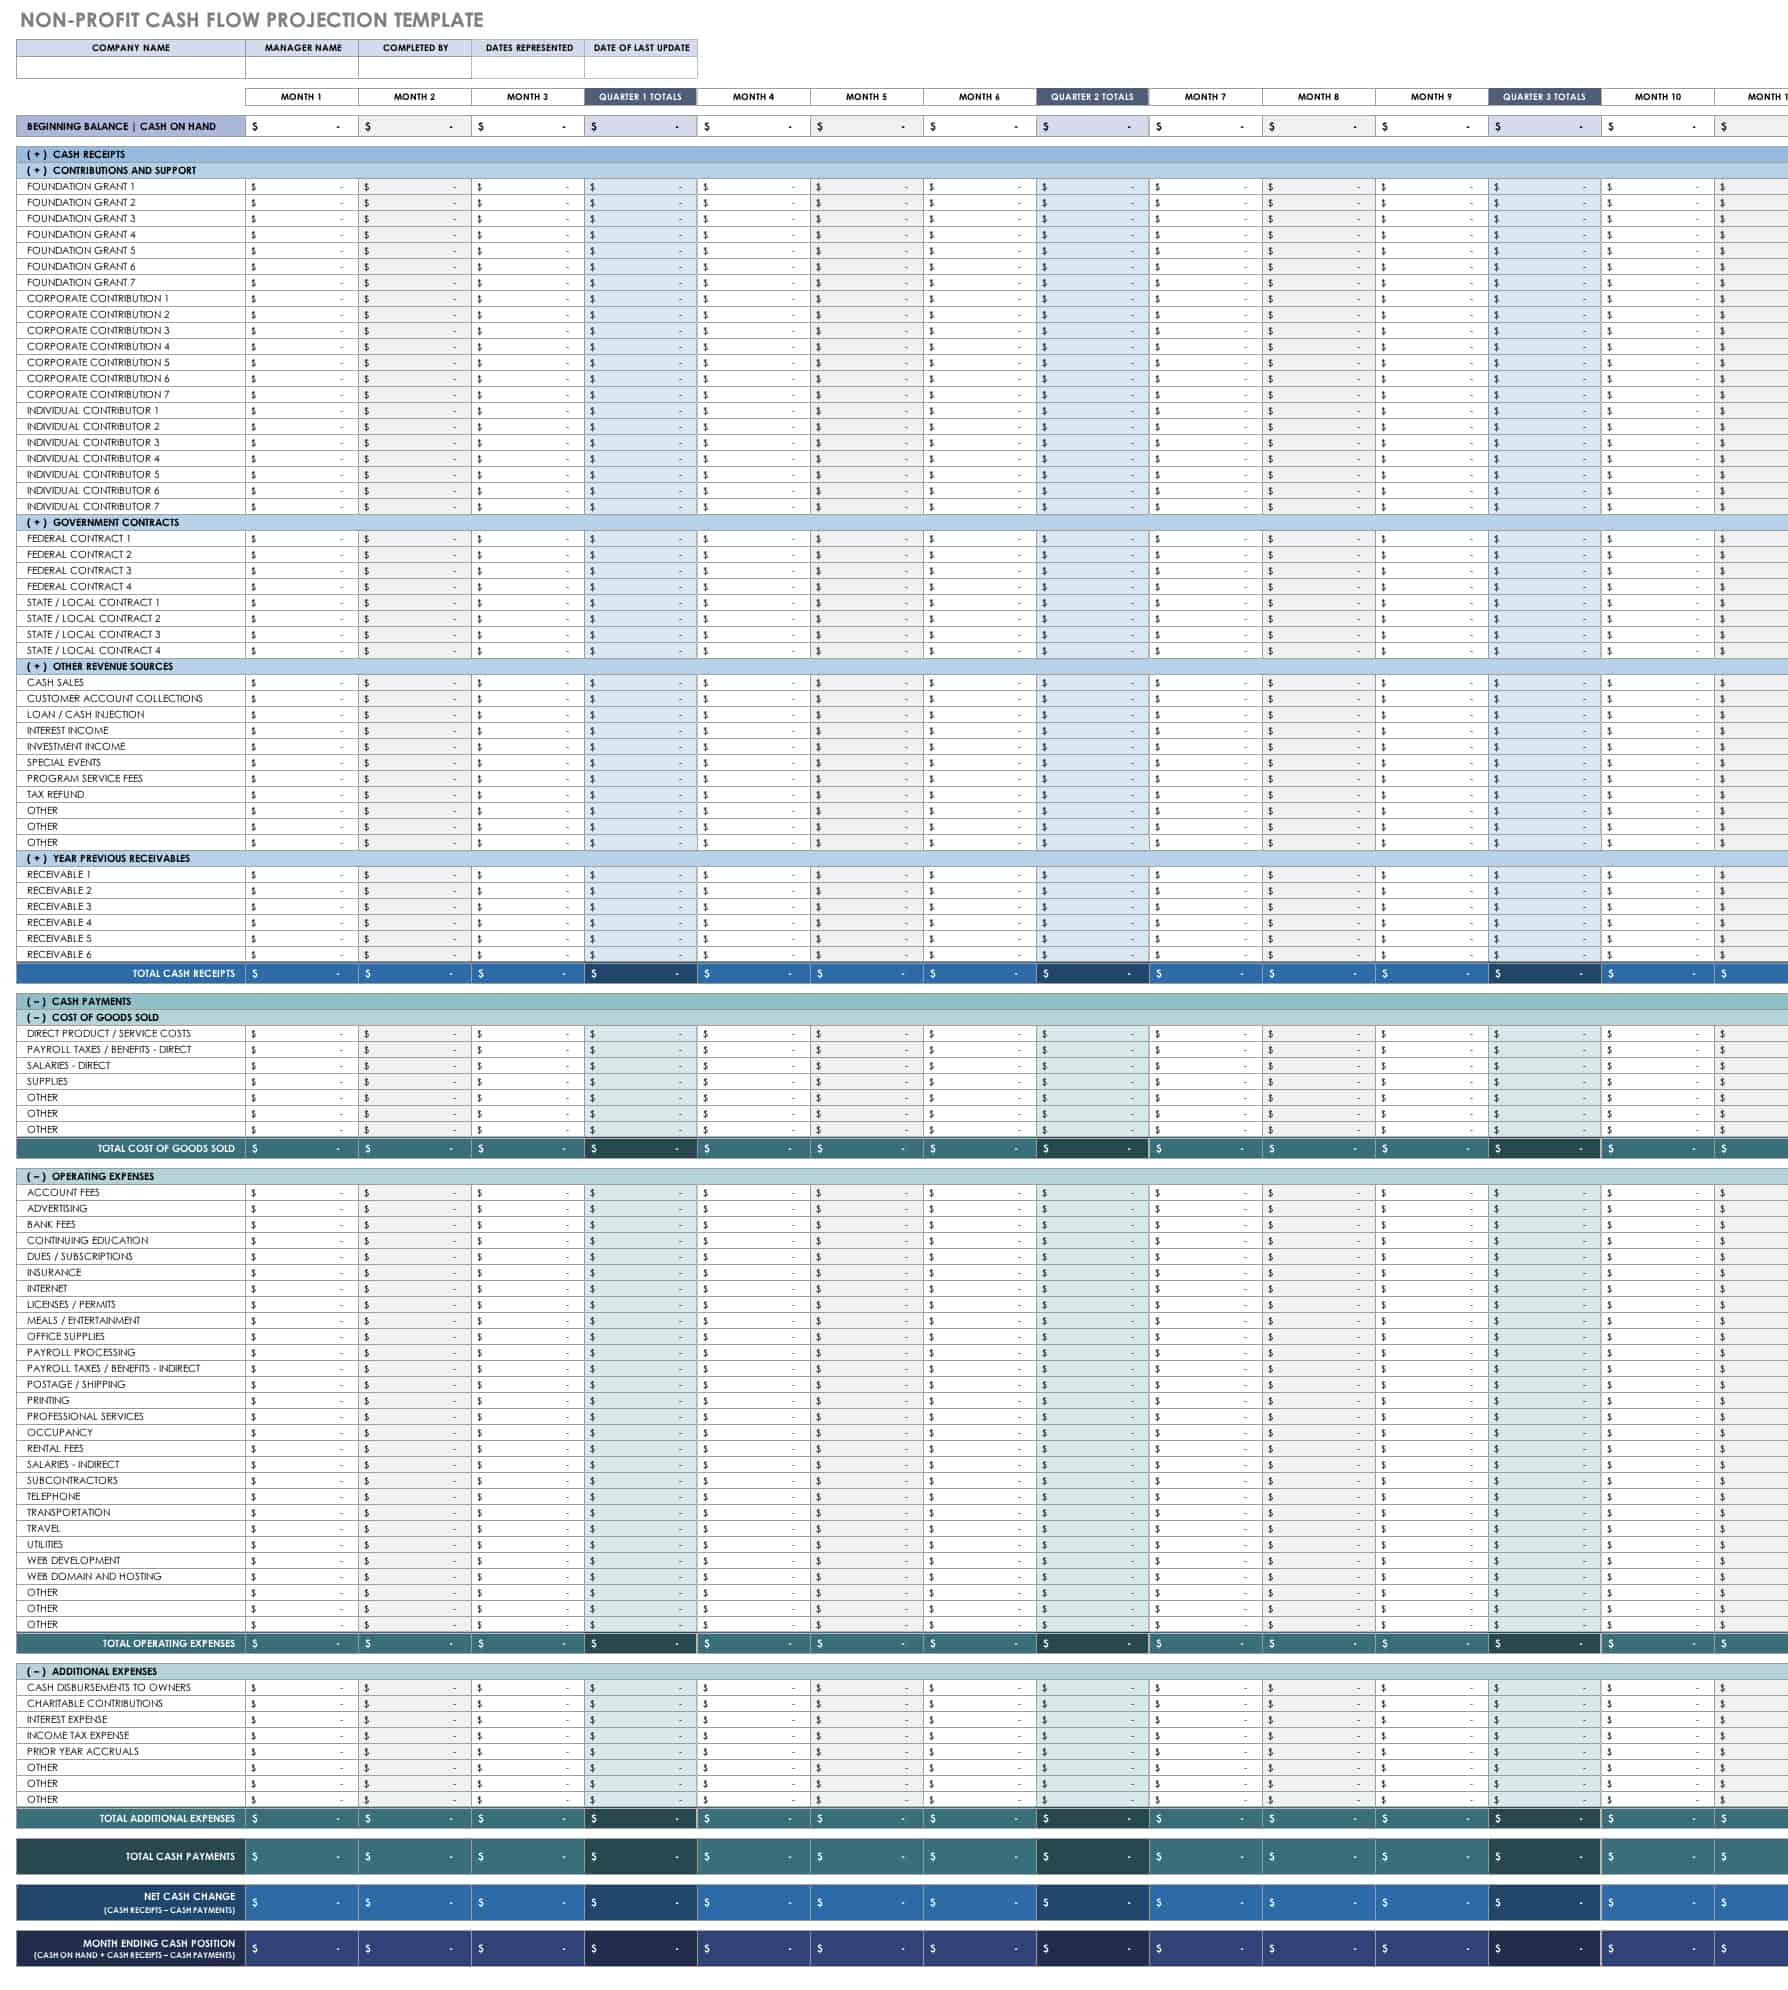
Use this template to determine whether your nonprofit will have enough cash to meet its financial obligations. There are sections for cash receipts, contributions and support, government contracts, other revenue sources, and receivables from previous years. This template is completely customizable, and provides insight into monthly and yearly carryover, so you can keep tabs on your rolling cash balance.
Download Nonprofit Cash Flow Projection Template
Personal Cash Flow Forecast Template
Manage your financial outlook with this personal cash flow forecast template. Compare your personal income to your expenses, with the additional factor of savings. The automatic pie chart provides insight into whether you’re spending above your means. Enter your income, savings, and expense data to get a comprehensive picture of your short and long-term cash flow.
Download Personal Cash Flow Forecast Template
Creating a Cash Flow Forecast
In order to set yourself up for success, you must be realistic when forecasting cash flows. You can build your projections on a foundation of key assumptions about the monthly flow of cash to and from your business. For instance, knowing when your business will receive payments and when payments are due to outside vendors allows you to make more accurate assumptions about your final funds during an operating cycle. Estimated cash flows will always vary somewhat from actual performance, which is why it’s important to compare actual numbers to your projections on a monthly basis and update your cash flow forecast as necessary. It’s also wise to limit your forecast to a 12-month period for greater accuracy (and to save time). On a monthly basis, you can add another month to create a rolling, long-term projection.
A cash flow forecast may include the following sections:
- Operating Cash: The cash on hand that you have to work with at the start of a given period. For a monthly projection, this is the cash balance available at the start of a month.
- Revenue: Depending on the type of business, revenue may include estimated sales figures, tax refunds or grants, loan payments received, or incoming fees. The revenue section covers the total sources of cash for each month.
- Expenses: Cash outflows may include your salary and other payroll costs, business loan payments, rent, asset purchases, and other expenditures.
- Net Cash Flow: This refers to the closing cash balance, which reveals whether you have excess funds or a deficit.
Keep in mind that while many costs are recurring, you also need to consider one-time costs. Additionally, you should plan for seasonal changes that could impact business performance, as well as any upcoming promotional events that may boost sales. Depending on the size and complexity of your business, you may want to delegate the responsibility of creating a cash flow forecast to an accountant. However, small businesses can save time and money with a simple cash flow projections template.
The Benefits of Cash Flow Forecasting
Regardless of the reporting period, or granularity, you choose for your cash flow forecast, you should take into account important cash flow forecast-specific factors, such as seasonal trends, to gain a clear picture of your company’s finances. Accurate cash flow forecasting can enable you to do the following:
- Anticipate any cash-balance shortfalls.
- Verify that you have enough cash on hand to pay suppliers and employees.
- Call attention to customers not paying on time, and eliminate cash flow discrepancies.
- Act proactively, in the event that cash flow issues will adversely affect budgets.
- Notify stakeholders, such as banks, who might require such forecasting for loans.
Tips for Improving Cash Flow Forecasting
Whether you are a large or small business and want a day-by-day or three-year picture of your company’s projected cash flow,keep the following tips in mind:
- Pick the Right Cash Flow Forecasting Template: There are templates available for a variety of forecasting needs, including those for organization size and one that provides short or long-term insights. Select a template that’s suitable to your particular cash flow forecasting needs.
- Use a Discounted Cash Flow (DCF) Template: If you are looking to estimate the current value of your company, based on the time value of money (the benefit of receiving cash infusions sooner than later), you’ll want to do a DCF.
- Enter Variables Accurately: Inflows and outflows can change on a literal dime. Ensure that you tally all beginning balances (cash on hand), cash receipts and disbursements (R&D), and operating expenses correctly. These numbers provide the big-picture net cash change and your ultimate cash position.
- Choose the Right Forecasting Horizon: The margin of error when using a three-year cash flow forecasting template is greater than performing a daily cash flow forecast. When choosing a template, keep in mind the time-period for the forecast.
- Consider Seasonal Fluctuations: If your cash flow fluctuates by season (tax, interest, larger annual payments, etc.), incorporate those details into your cash flow forecast. This will ensure that one quarter’s inflow doesn’t positively or negatively affect another in your forecast.
Discover a Better Way to Manage Cash Flow Forecasts and Finance Operations
Empower your people to go above and beyond with a flexible platform designed to match the needs of your team — and adapt as those needs change.
The Smartsheet platform makes it easy to plan, capture, manage, and report on work from anywhere, helping your team be more effective and get more done. Report on key metrics and get real-time visibility into work as it happens with roll-up reports, dashboards, and automated workflows built to keep your team connected and informed.
When teams have clarity into the work getting done, there’s no telling how much more they can accomplish in the same amount of time. Try Smartsheet for free, today.
Any articles, templates, or information provided by Smartsheet on the website are for reference only. While we strive to keep the information up to date and correct, we make no representations or warranties of any kind, express or implied, about the completeness, accuracy, reliability, suitability, or availability with respect to the website or the information, articles, templates, or related graphics contained on the website. Any reliance you place on such information is therefore strictly at your own risk.
These templates are provided as samples only. These templates are in no way meant as legal or compliance advice. Users of these templates must determine what information is necessary and needed to accomplish their objectives.
Источник