
Excel Variance (Table of Contents)
- Introduction to Variance in Excel
- How to Calculate Variance in Excel?
Introduction to Variance in Excel
Variance is used in cases if we have some budgets, and we may know the variances observed in implementing the budgets. In some cases, the term variance is also used to calculate the difference between the planned and the actual results. Variance calculation is a great way for data analysis as this let us know the spread through of variation in the data set.
Variance is nothing but just information that shows us how well the data is spread through. Calculating variance is required, especially in cases where we have been doing a sampling of data. This is important because we use the correct function to calculate the variance like VAR.S or VAR.P. We have a few cases to calculate variance in excel where we have some data that has been projected for the period, and we want to compare that with the actual figures.
How to Calculate Variance in Excel?
Let’s understand how to Calculate Variance in Excel with some examples.
You can download this Variance Excel Template here – Variance Excel Template
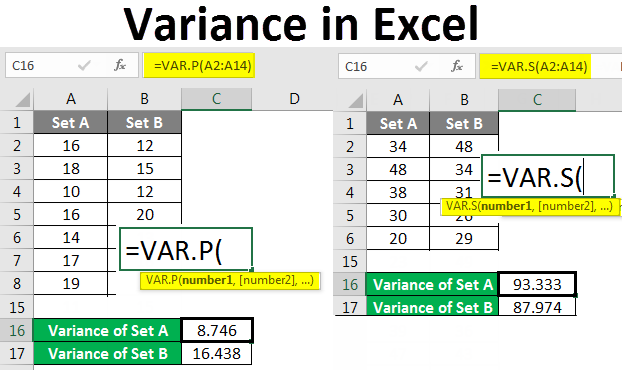
Example #1 – Calculating variance in excel for the entire population
If the data set is for the complete population, then we need to use the VAR.P function of excel. This is because, in excel, we have two functions that are designed for different datasets.
We may have data that is collected based on sampling, which might be the population of the entire world.
VAR.P uses the following formula:
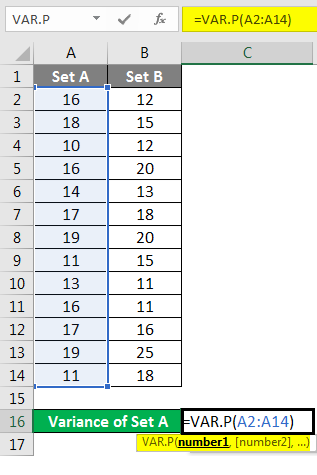
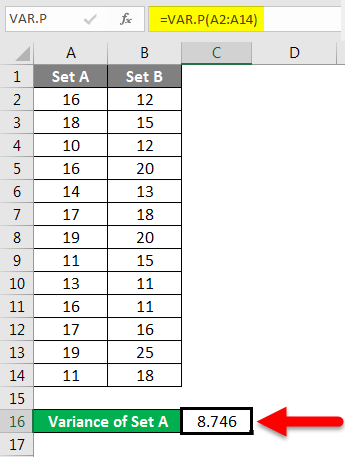
Step 1 – Enter the data set in the columns.
Step 2 – Insert the VAR.P function and choose the range of the data set. Here one thing should be noted that if any cell has an error, then that cell will be ignored.
Step 3 – After pressing the Enter key, we will get the variance.
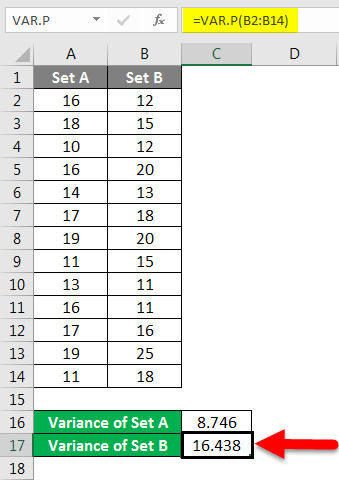
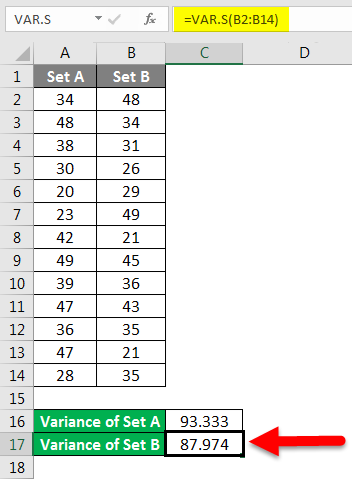
We have calculated the variance of Set B by following the same steps given above. The result of the variance of Set B is shown below.
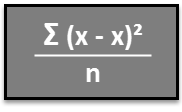
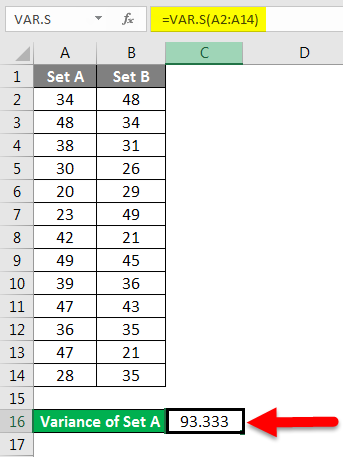
Example #2 – Calculating the variance for sample size in excel
If we have data set that represents samples, then we need to use the function of VAR.S instead of using the VAR.P
This is because this function has been designed to calculate the variance, keeping in mind the sampling method’s characteristics.
VAR.S uses the following formula:
Step 1 – Enter the data set in the column.
Step 2 – Insert the VAR.S function and choose the range of the data set.
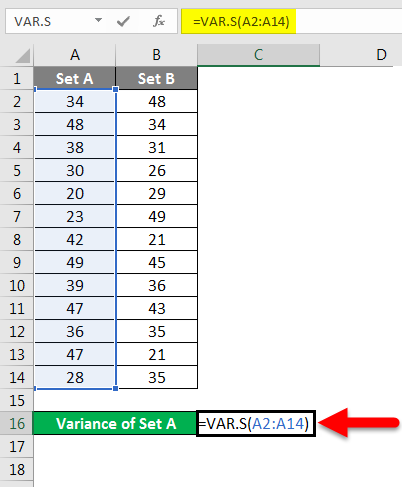
Step 3 – We will get the variance.
We have calculated the variance of Set B by following the same steps given above. The result of the variance of Set B is shown below.
Example #3 – Calculating the quantum of variance for data in excel
We may just want to calculate the variance in the data, and we may need the variance in terms of quantity and not in terms of data analysis.
If we need to check the change, then we need to use the following method.
Step 1 – Calculate the difference that is between the two of the data by using the function of subtraction.
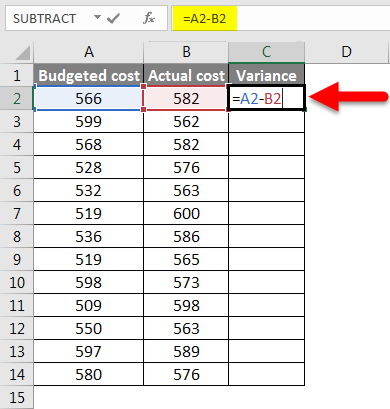
Step 2 – After pressing the Enter key, we will get the result. To get the entire data variance, we have to drag the formula applied to cell C2.
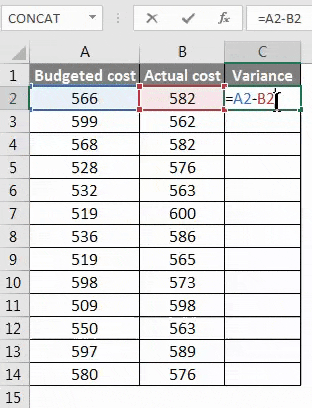
Step 3 – Now, the variance can be positive and negative, and this will be the calculated variance.
Example #4 – Calculating the percentage of variance for the data set in excel
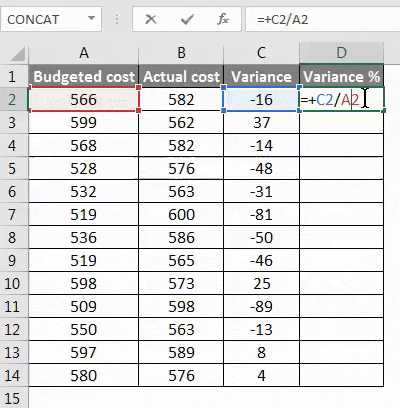
We may need to calculate the percentage change in the data over a period of time, and in such cases, we need to use the below method.
Step 1 – First, calculate the variance from method 3rd.
Step 2 – Now calculate the percentage by using the below function.
Change in the value/original value*100. This will be our percentage change in the data set.
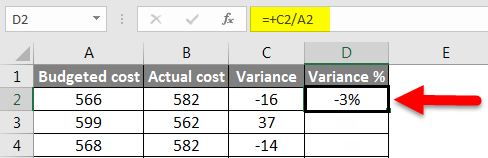
Step 3 – To get the percentage of the entire data variance, we have to drag the formula applied to cell D2.
Things to Remember About Variance in Excel
- If we have data set that represents the complete population, then we need to use the function of VAR.P.
- If we have a data set that represents the samples from the world data, then we need to use the function of VAR.S.
- Here S represents the samples.
- If we are calculating the change in terms of quantum, then a negative change means an increase in actual value and a positive change means a decrease in value.
- In the case of using the VAR.P, the arguments can be number or name, arrays or reference that contains numbers.
- If any of the cells that have been given as a reference in the formula contains an error, then that cell will be ignored.
Recommended Articles
This is a guide to Variance in Excel. Here we discussed How to calculate Variance in Excel along with practical examples and a downloadable excel template. You can also go through our other suggested articles –
- Top 25 Useful Advanced Excel Formulas and Functions
- FLOOR Function in Excel
- Excel Square Root Function
- Excel Variance
Use Excel to run your regression analysis
Updated on March 11, 2021
What to Know
- Calculate Variance: Type =VAR.S( in the cell where you want the variance to appear and enter the range of cells to include. Type ).
- Calculate Regression Analysis: Install Analysis TookPack Add-in. Go to the Data tab and select Data Analysis > Regression > OK.
- Enter the cell range with the Y variables in Input Y Range field. Enter the cell range of X variables in Input X Range. Select output location.
This article explains how to calculate Variance and run a Regression Analysis in Excel for Windows and Mac. It includes information on running a regression analysis in Excel Online. These variance functions work in Excel 2019, Excel 2016, and Excel 2010 on Windows; Excel 2016 and Excel 2011 on macOS; and Microsoft Excel on Android and iOS as well as Microsoft 365.
Calculate Sample or Population Variance
Excel provides functions to calculate variance and supports add-ins that enable regression analysis.
Variance indicates how widely a set of numbers diverges from the average of the numbers. When comparing variance calculations, the higher the variance, the more widely distributed are the numbers in a data set. A variance of 0, for example, indicates that all the numbers in the selected data set are the same. (Standard deviation is the square root of the variance and also measures how to spread out a data set is.) You can run a variance on any set of numbers in Excel.
-
In the cell where you want to calculate variance, type: =VAR.S(
The VAR.S function assumes that the data set is a sample, not the entire population.
-
Then enter the range of cells to include, such as B2:B11. (If you prefer, you may click or tap to select a cell range.)
-
Then type: )
The result displays in the cell. The equation should look something like: =VAR.S($B$2:$B$11)
If you are certain you are working with a complete population data set, you may alternatively use the VAR.P function. That would look like: =VAR.P($B$2:$B$11)
Run a Regression Analysis in Excel on Windows or macOS
Regression analysis helps you understand the relationship between variables. It provides analysis that mathematically identifies if and how one variable affects another in a statistically significant way. To run a regression in Excel, you need two sets of numbers, with one set that serves as the Y variable and the other as the X variable. Most often, these numbers are entered in two adjacent columns.
To run regressions on Windows or macOS systems, you need to install the Analysis ToolPak add-in for Excel. The ToolPak works on Excel 2007 or newer on Windows systems and on Excel 2016 or newer on macOS systems.
On recent versions of Microsoft Excel on Windows, type add-in in the search box in Excel and press enter. Then select the result with the gear to the left of the words Add-in that displays. (For other versions of Excel on Windows, select File > Options > Add-Ins. Then in the Manage box, choose Excel Add-ins and Go.) Next, select the check box next to Analysis ToolPak, then select OK.
On macOS versions of Excel, select Tools > Excel Add-ins. Then select the check box next to Analysis ToolPak, and choose OK.
For additional ways to install the Analysis ToolPak, follow Microsoft’s Load the Analysis ToolPak in Excel help page. Once installed, the ToolPak gives you access to data analysis tools.
-
Select the Data tab, then look for the Analysis area and select Data Analysis.
-
Select Regression from the list and then choose OK.
-
In the Input Y Range field, enter (or select) the range of cells that contain the Y variables. For example, this might be $B$2:$B$10.
-
In the Input X Range field, enter (or select) the range of cells that contain the X variables. For example, this might be $A$2:$A$10.
-
Optionally, select the box for Labels or make any other adjustments desired to the regression calculation options displayed.
-
In the Output options section, select the output location. Most often, you’ll want to choose the New Worksheet Ply: button, while also leaving the box unfilled.
-
Choose OK.
The regression results display in a new sheet.
Run a Regression Analysis in Excel Online
In a browser, including the Safari browser on an iPad, you can do a linear regression in Excel online with the help of an add-on.
-
Open the Excel spreadsheet with your data in a browser using Excel Online.
-
Choose Insert > Office Add-ins.
-
In the search box that displays, type “XLMiner Analysis ToolPak” and press enter.
-
Select Add on the XLMiner Analysis ToolPak screen to add several potential data tools on the right side of the screen.
-
Select Linear Regression in the XLMiner Analysis ToolPak menu.
-
In the Input Y Range field, enter (or select) the range of cells that contain the Y variables. For example, this might be B2:B11.
-
In the Input X Range field, enter (or select) the range of cells that contain the X variables. For example, this might be A2:A11.
-
Optionally, select the box for Labels or make any other adjustments desired to the regression calculation options displayed.
-
For Output Range, select a cell location far enough to the right or bottom of your sheet to ensure that it is outside the range of other data in your Excel document. For example, if all of your data is in columns A through C, you might enter F2 in the output range box.
-
Choose OK.
The regression results display in your Excel sheet, starting at the cell you selected.
Thanks for letting us know!
Get the Latest Tech News Delivered Every Day
Subscribe
In this tutorial, I will demonstrate how to calculate the variance in Microsoft Excel. Specifically, I will show you how to calculate the variance of a sample, as well as a population.
What is variance?
To begin with, let me quickly explain what the variance is.
Variance is a measure of variability.
Simply, it is calculated by taking the average of squared deviations from the mean. The resulting value, known as variance, tells you the degree of spread in your data.
The larger the variance value, the more spread the data is in relation to the mean.
Calculating the variance in Excel will differ slightly depending on whether you want to calculate the variance for a sample or a population.
Calculating variance of a sample
I’ll start by calculating the variance for a sample, which is probably what most people are interested in.
In my Excel sheet, I have some example data.
Let’s say I am interested in a rare fish called Fish X. What I’ve done is take a sample of 15 Fish X fishes and measured their length in centimetres.
To calculate the variance of a sample in Excel, use the VAR.S function.
=VAR.S(number1, [number2], ...)
Within the parenthesis, add in the cells containing your data.
Here is what my formula looks like for the Fish X example.
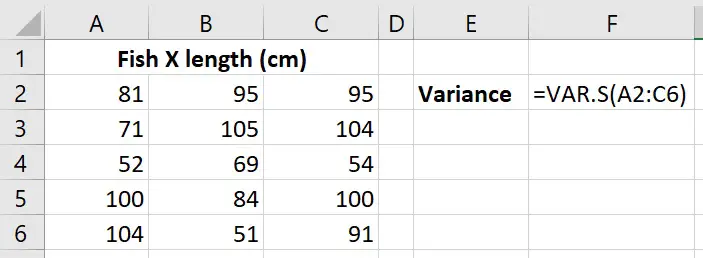
The variance for my sample is 389.924.
The units for the variance are the same as the original measurement squared; so my variance is in fact 389.924 cm2.
[Optional] Calculating the standard deviation from the variance in Excel
If you’re wondering, you can calculate the standard deviation from the variance by simply square rooting the variance. You do this by using the SQRT function.
=SQRT(number)
- number – Replace this with the cell containing the variance value
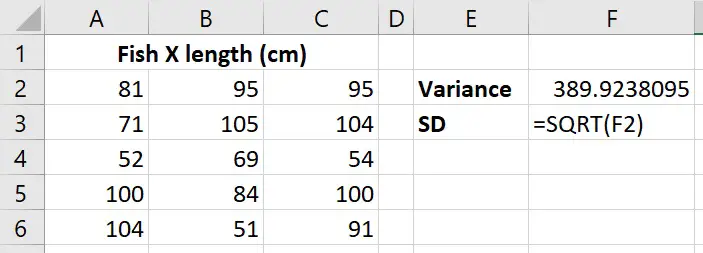
The standard deviation comes out to be 19.7465.
The units for this will be the same as the original units for my data, so this would be centimetres.
Calculating variance of a population
I’ve got a different dataset now. This time, I have the data for all the Fish X fishes in the world; in total there are 100. So, what I have here is known as a population.
Calculating the variance of a population involves a slightly different function compared with the sample variance. This time, we will use the VAR.P function.
=VAR.P(number1, [number2], ...)
Again, within the parenthesis, add in the range of cells containing your data.
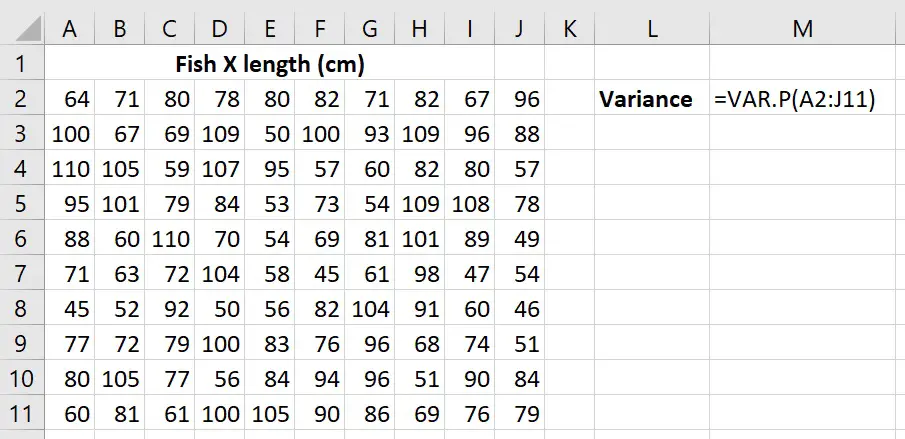
I get a result of 341.12.
Again, this will have the units cm2.
How to calculate variance in Excel: Wrapping up
Now you know how to calcuate the sample and population variance in Microsoft Excel.
To calculate the sample variance, use the VAR.S function. If you’re wanting to calculate the variance of a population, then use the VAR.P function instead.
Microsoft Excel version used: 365 ProPlus
Want to know how to calculate Variance in Excel?
But wait!!
Do you even know how you can use variance in real life?
Some of you might not have any idea about it. Let me explain first where you can see that application of variance.
Example 1: You all have heard that the stock market has an average return of some percentage. It does not mean each year you get that percentage return. It can be less in a year or higher in the next year. Now, this is the variance or variability that you see in the stock market.
Another Example: Suppose you drive to the office and take a route daily. But you found that there is variability in the daily timing when you reach the office. Well, the variability could be because of the stop-light timing, traffic, and more. Moreover, the variability in the gas is also seen. All these variabilities can be calculated using the concept of variance.
Why use Excel for calculating variance. The simple answer to it is:
- Excel offers several statistical formulas to apply directly.
- Apart from this, Excel can help you to manage large data collected from different sources.
- Excel also makes your work easier and simple.
Now, let’s jump to the details about how to calculate variance in Excel. But first, know what variance is (technically).
What is the variance?
It is the calculation of the spread numbers in a data set file. Or it is the measurement of the variability of the given data set that represents how far a difference value is spread. In the mathematical term, it is the average of the squared of the calculated difference from the mean.
Variance Formula in Excel:
x_i = the value of the one observation
bar{x} = the mean value of each and every observation
n = the number of observations
For a better understanding of how to calculate variance in excel, let’s take an example of it:
Assume, there are 5 monkeys in a zoo that are 10,6,14,8, and 2 years old. Find the variance of it.
- Measure the mean of these five numbers:
Mean = (10+6+14+8+2)/5 = 8
- Subtract the mean value to get the difference. To represent it, plot the difference as:
- Square each calculated difference.
- Measure the average of the square differences:
variance = {6^2+2^2+0^2+(-2)^2+(-6)^2}/5 = 16.
Therefore, the variance of the given data is 16.
Things you should keep in mind before calculating Variance in Excel
There are some of the things that you should know before calculating the variance. Particularly, you should consider:
While VAR.S and VAR can change technically, VAR.S can replace the Excel function for the data. Also, VAR.P for the population data set must use over the VARP as the new function.
For counting logical or text values, you should use VARPA (for population) or VARA (for samples).
A single argument (value 1) is necessary for the reference to a cell’s range. But finding the variance from the single value is quite redundant. Therefore, you should use more arguments for this.
Users can also use the reference to cell ranges or reference every value individually.
VAR.S, VARP, VAR, and VARP only support the value in the numeric.
If you want to learn how you can calculate variance in excel then, Get the best excel homework help from the experts
There are different functions to calculate the variance in Excel, which are: VAR.S, VAR.P, VARPA, VAR, VARP, and VARA. One can use any of the variance formulas to determine factors such as:
- Whether one measures population or sample variance.
- The excel version which one is using.
- Whether one wishes to ignore or evaluate logical and text values.
Different excel variance functions
We have provided a brief description of the various functions that are accessible in Excel that help one to select the formula as per the need.
| Name | Excel version | Data type | Logical and Text |
| VAR.S | 2010-2019 | Sample | Ignored |
| VAR.P | 2010-219 | Population | Ignored |
| VARPA | 2000-2019 | Population | Evaluated |
| VAR | 2000-2019 | Sample | Ignored |
| VARP | 2000-2019 | Population | Ignored |
| VARA | 2000-2019 | Sample | Ignored |
Methods for how to calculate variance in excel (sample)
The sample is the set of the extracted data from the whole population, and the variance which is used for calculating the sample value is known as sample variance.
Let’s take an example, if one wants to calculate the individual’s height, then it is calculated for 1000 individuals, and the assumed height of the entire population is based on the sample.
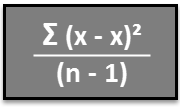
Sample variance formula to calculate the value as:
Where x bar is the simple average of the given values, and n is the number value of the sample.
Then the three different sample variance is used to calculate by VAR, VAR.S, and VARA.
VAR function for sample variance in excel
It is one of the oldest functions in excel to predict the variance of the sample. The VAR function is accessible for the excel 2000 to 2019 version.
VAR (number1, [number2], ….)
NOTE: In 2010 excel, this function was replaced by VAR.S, which helps in improving accuracy. But, VAR is also available now for backup compatibility, in the current excel version, VAR.S is used for calculating the variance in excel.
VAR.S function for sample variance in excel
It is one of the modern counterparts for the current version of Excel, which is used in excel 2010 and later versions of excel.
VAR.S (number1, [number2], …)
VARA function for sample variance in excel
It is used to return the value of sample variance, which is based on the set of text, numbers, and logical values.
VARA (value1, [value2], …)
Example of sample variance in excel
When one is working with the numeric sets of data, then they can use the functions to measure the sample variance of an excel sheet. Let’s take an example of it, and measure the variance of the sample, including the 6 items (B2: B7). then, the formula will be as:
= VAR (B2: B7)
=VAR.S (B2: B7)
=VARA (B2: B7)
Add a simple variance video here
To check the accuracy of the data, let’s calculate it manually too:
- Calculate the average using the AVERAGE function as to put in the empty cell B8:
= AVERAGE (B2: B7)
- Subtract the calculated average value from every number of the sample and put the value in column C2.
=B2-$B$8.
- Now, square each calculated difference and keep in data in column D2:
=C2^2
- Sum up the square of the difference and divide the outcome with the total number of data which is sample minus 1:
=SUM (D2: D7) / (6-1)
Now, it will represent the data as given below table:
Different excel variance functions
How to calculate variance in excel (population)
The population can be defined as a member of a given group, which is the observed value in a field of study. It is used to describe the data points of the spread entire population. The formula of population variance can be calculated as:
Where x bar is the mean value of the given population, and n is the size of the given population.
There are three different functions that are used to measure the population variance in excel: VARP, VAR.P, and VARPA.
VARP function for population variance in excel
This function is used to return the population variance, which is based on the whole set of population numbers. It can be accessible in the excel version of 2000 to 2019.
VARP(number1), [number2], ….)
NOTE: For the excel version of 2010, VARP is replaced by VAR.P, and it is suggested that try to use VAR.P in excel as the VARP function would be accessible for future excel versions.
VAR.P function for population variance in excel
It is used as the improved VARP function, which is accessible for excel 2010 and later versions.
VAR.P (number1, [number2], ….)
VARPA function for population variance in excel
It is used to measure the population variance value for the entire number of the set, logical value, and text. It is used in excel 2000-2019 versions.
VARA (Value1, [value2], ….)
Example of population variance in excel
In this example, there is an exam score of 5 students, which has the maximum value from the entire group of sets. If you gather data from the students, then the data represent the whole population and calculate the population variance. But let’s first know its formula:
Population Variance Formula:
Let’s take an example of 10 students (B2: B11), so the variance can be calculated as:
= VARP (B2: B11)
= VAR.P (B2: B11)
= VARPA (B2: B11)
Add simple variance video here
Excel can be the best option to calculate the variance, and one can judge the manual var as:
Pooled Variance Formula
In the statistics, the Pooled variance is a method used for estimating the variance of many different populations when the mean of each population may be different, but one can assume that the variance of each population is the same.
With the use of this method when you get the result of a numerical estimate, you can call this pooled variance.
n_i = sample size
y_i = the ith observation
y_j = sample mean of group j
Useful notes for how to calculate variance in excel
To calculate the variance in excel, follow the simple norms that make it easy to use:
- Give arguments as arrays, values, or cell references.
- For the 2007 or later version of Excel, one can use up to 255 arguments for a population or sample, but for 2003 or older versions of Excel, one can use 30 arguments.
- To get the value of references, ignore the text, empty cells, and logical values. Use the function VAR.S or VAR to calculate sample variance whereas for the population variance, use VAR.P or VARP functions.
- To get the text and logical values in references, VARPA or VARA functions can be used.
- Give approximately two numeric values for using the sample variance formula and a single numeric value for the population variance formula in the Excel sheet.
- The arguments that contain the text can not be interpreted and cause #VALUE! Errors for the numbers.
Conclusion
This blog has provided information on how to calculate variance in excel that including various types of functions used to measure sample and population variance. These functions are used for different versions of Excel, which start from 2000 to the 2019 year. One can easily use these functions and do their work with ease.
So, whenever one needs to calculate the variance of the excel data, use these above-mentioned functions, and measure the value easily. If you are facing any problem related to the statistics assignments, then you can contact our experts who are known for their high-quality content with zero plagiarism. They can deliver the data before the deadlines, and one can use our services at reasonable prices with accessibility 24/7. So, avail of our statistics services and score A+ grades in your academics. Get the best excel homework help from the experts
Also, Read
- How to Find Z Score in Excel
- How to Find Range in Excel
- How to Calculate Variance In Excel Using Different Functions
Frequently Asked Questions
What exactly is a variance?
In terms of statistics and probability, variance is the method to calculate how far the set is spread out. Moreover, it shows how much the random figure differs from the imaginary or expected value. We can define variance as the average of the differences’s square between the observed and expected value.
What are the different types of variance?
There are different types of variances. Some of those are:
Cost Variances.
Fixed Overhead Variance.
Profit Variance.
Labour Variances.
Material Variances.
Overhead (Variable) Variance.
Sales Variance.
Calculating variance allows you to determine the spread of numbers in a data set against the mean. This is a great tool for data analysts, who can use Excel to calculate the variance using functions like VAR.S and VAR.P. We’ll explain how to use variance functions in this step-by-step tutorial.
In mathematical terms, variance is the calculation of how far a set of values is from the average value (the mean). If the variance is zero, there isn’t any variety—all numbers are likely to be the same. As this number grows, the variance grows with it.
This has all kinds of uses for analysts, from determining the different ages in a group to working out the spread of returns in different investment portfolios. Excel allows you to calculate variance like this by using functions aimed at entire data sets (population variance) or a small subset of a larger group of data (sample variance).
This is an important distinction, as the way Excel calculates variance will differ depending on the size of your data set. If you’re working with a smaller sample, you’ll need to use VAR, VAR.S, or VARA functions to calculate variance. For population variance, you’ll need to use VARP, VAR.P, or VARPA instead.
While there are similarities between these functions, there are some important things to consider before you use them. In this article, we’ll explain:
- What are variance functions in Excel and what are they used for?
- How do variance functions work in Microsoft Excel?
- Things to consider before using variance functions in Excel
- How to calculate variance in Excel: A step by-step guide
How do variance functions work in Excel? To help you, let’s run through the basics.
1. What are variance functions in Excel and what are they used for?
Variance works by determining the spread of values against the mean. If you have a set of exam results for a group of students, you might end up with wildly different values in two separate exams, but with the same average. By determining the variance, you can determine how well the group performed as a whole.

You can calculate this spread (the variance) using Excel’s variance functions. As we’ve mentioned, there are two main forms of variance that you can calculate in Excel: population variance and sample variance. In this context, population is the entire set of data, rather than a sample (or smaller subset) of it.
To calculate these values, you can use one of six variance functions in Excel. For sample variance, you can use the VAR, VAR.S or VARA functions. VAR is the original function, while VAR.S is the newer replacement, offering some speed enhancements over the original.
VAR and VAR.S only support numerical values, but if you want to use text strings or logical tests for a sample set, you’ll need to use VARA instead.
For population variance, you’ll need to use the VARP, VAR.P or VARPA functions. As with the sample variance functions, VARP is the original, while VAR.P is the newer (and recommended) replacement, with both functions working only with numerical values. To work with text strings or logicals, use VARPA instead.
If you’re thinking that this sounds a lot like standard deviation, that’s because it (almost) is. Standard deviation calculates, on average, how far your values are from the mean. Variation is simply the standard deviation value squared, which gives you an idea of how far all of your numbers are spread from the average.
2. How do variance functions work in Excel?
As we’ve already mentioned, there are six variance functions that you can use in Excel, split into two categories to deal with either population or sample variation.
These are:
- VAR, VAR.S or VARA for sample variance, and
- VARP, VAR.P or VARPA for population variance.
Of these six, two functions (VAR and VARP) are considered outdated, having been replaced with VAR.S and VAR.P. These are interchangeable for the time being, but could be removed from Excel in the future.

Four of these functions (VAR, VARP, VAR.S and VAR.P)focus on numerical data. That means that, if you’re a budding data analyst trying to work out the variance from a set of numbers using either a sample of a data set or the entire data set, you’d want to use these functions.
Should your data be mixed, however, you’ll need to use VARA or VARPA instead. These functions support text, numbers, and logical values (TRUE, FALSE, 1 or 0).

By support, we mean that text strings and logical results are converted to the numerical equivalent, where a text string is counted as a 0 (or FALSE). Logical values are counted as their numerical equivalent (0 for FALSE or 1 for TRUE). This can have an impact on your overall results, so choose your functions carefully.
If you want to create a formula using any of these variance functions, you’ll need to use a set structure. The structure remains the same for each six functions:
- =VAR(value1,value2, …)
- =VAR.S(value1,value2, …)
- =VARP(value1,value2, …)
- =VAR.P(value1,value2, …)
- =VARA(value1,value2, …)
- =VARPA(value1,value2, **…)**

The only required argument in a variance formula using these functions is the reference to the data you use (value1). This can be referenced as a range of cells or as values directly (where value1 is your first value, value2 is your second value, etc).
Only one value (value1) is required for a variance function to work. For cell ranges, this is considered as a single value (value1) for the purpose of creating your formula.
3. Things to consider before using variance functions in Excel
There are plenty of considerations to make before you decide to calculate variance in Excel using these functions. In particular, you’ll need to consider:
- While VAR and VAR.S are technically interchangeable, VAR.S is the replacement Excel function for sample data sets and should be used in the first instance. Likewise, VAR.P should be used over VARP for population data sets as the newer function.
- VAR, VAR.S, VARP and VARP only support numerical values. Other values (text strings, logical values, etc.) are ignored and won’t count towards your result.
- If you want to count text or logical values as you calculate variance, you’ll need to use VARA (for samples) or VARPA (for population sets).
- You can use references to cell ranges (eg. =VAR.S(A1:D10)) in your variance formulas, or reference each value separately (eg. =VAR.S(1,2,3,4)).
- If you reference each value separately, you can use up to 254 different values. This is an Excel limitation and can’t be increased. If you require more, fill out your spreadsheet first, then use a reference to the cell range containing those cells instead.
- Only a single argument (value1) is required, which can contain a single value or a reference to a range of cells. However, to calculate variance from a single value is redundant, so you’ll need to use more arguments if you’re typing these into your formula directly.
- If you’re adding a text string as a value in a variance formula, you’ll need to reference it in another cell for the formula to work, as directly adding a text string as a value argument will cause a #VALUE error to appear.
If you have a small sample from a larger data set, you can use the VAR, VAR.S or VARA functions to calculate the variance. If you’re trying to calculate variance in Excel using the population data set (that is, the entire set of data, rather than the smaller sample), you can do this using VARP, VAR.P or VARPA instead.
For the purpose of this guide, references to VAR and VAR.S are interchangeable. We’ve used VAR.S, which is the newer and recommended function, but the older VAR can be used (for the time being) in older workbooks. If you can, however, use VAR.S.
Likewise, references to VARP and VAR.P are also interchangeable, but you should use VAR.P in the first instance. VARA and VARPA remain available for all Excel users, regardless of the version used.
Step 1: Select an empty cell
To insert a variance function into a new formula, start by opening the Excel workbook containing your data and selecting an empty cell. Alternatively, you can open a new workbook, making sure that the sheet containing your data remains open and minimized.
With the cell selected, press the formula bar at the bottom of the ribbon bar until you see the blinking cursor.

When the blinking cursor is visible, you’re ready to begin inserting your new formula.
Step 2: Insert your data set directly or using cell references
As we explained earlier, all variance functions in Excel use the same structure to create new formulas. To insert a new variance function using a sample data set (a smaller sample of a larger population set), start by typing =VAR.S( or =VARA( into the formula bar at the top.
If you’re working with a population data set (the entire data set), type =VAR.P( or =VARPA( instead.

With your formula opened, you’ll need to insert your data next. Most users will likely prefer to reference data elsewhere in your current workbook (or in a minimized workbook) using a cell range.
For instance, =VAR.S(C2:C10) or =VAR.P(C2:C20) completes the formula, using the numerical data in a cell range between cells C2 and C10 (for the sample set) or C2 and C20 (for the population set). Make sure to replace these references with your own.
If you’re working with data that contains numbers, text, and/or logical values, =VARA(C2:C10) or =VARPA(C2:C20) will work best. Rather than ignoring text or logical values (as VAR, VAR.S, VARP or VAR.P would), the values in a VARA or VARPA formula will count towards your overall result.
You could also reference each cell individually. For example =VARA(C2:C10) and =VARA(C2,C3,C4,C5,C6,C7,C8,C9,C10) will return the same result.
If you’re adding numerical values directly to your formula, you’ll need to add the values one by one. Each value needs to be separated using commas. For instance, =VAR.S(1,2,3,4,5,6) or =VAR.P(1,2,3,4,5,6,7,8,9,10) will give you the variance between the numbers 1 and 6 (or 1 and 10 for a population set) directly.

You can also do the same with VARA or VARPA. For example, =VARA(1,2,TRUE,3) would work, with the TRUE value counting as its numerical equivalent (1). Likewise, =VARPA(1,2,TRUE,3,4,10,8) would count these values in the same way, with TRUE counting as 1.
VARA and VARPA support text, but to use these, you’ll need to use a cell reference or cell range. For instance, =VARA(1,2,TRUE,D5,3,4,10,8) or =VARA(D2:D9) would work, where D5 contains text that counts as a FALSE value (0). If you try to add a text string directly, however, Excel will return a #VALUE error.

If you’ve added a reference to a cell range, make sure to close your formula with a closing parenthesis afterwards, then press enter to view the results (or click on another empty cell). For values added directly, place a closing parenthesis after the final value is inserted into your formula.
Final thoughts
By calculating the variance, you can learn a lot about the data you’re working with. This makes the life of a typical data analyst even easier, allowing you to prove theories and hypotheses using a single Excel formula. Variance functions are among the many Excel formulas that data analysts use on a regular basis to find results.
Excel makes mathematical functions like variance and standard deviation easier to handle, especially for beginners. There are also scripts on the internet that make it a little easier, such as this variance calculator—but it’s way more rewarding to learn how to calculate variance on your own!
If you’re new to the field and you want to learn more, try this free, five-day introductory data analytics course. And, if you’re keen to get to grips with more Excel formulas, check out the following:
- How to convert text to numbers in Excel
- How to use the SUMIF function in Excel
- How to use the VLOOKUP function in Excel