
Excel for Microsoft 365 Excel for Microsoft 365 for Mac Excel for the web Excel 2021 Excel 2021 for Mac Excel 2019 Excel 2019 for Mac Excel 2016 Excel 2016 for Mac Excel 2013 Excel 2010 Excel for Mac 2011 Excel Starter 2010 More…Less
Returns the individual term binomial distribution probability. Use BINOM.DIST in problems with a fixed number of tests or trials, when the outcomes of any trial are only success or failure, when trials are independent, and when the probability of success is constant throughout the experiment. For example, BINOM.DIST can calculate the probability that two of the next three babies born are male.
Syntax
BINOM.DIST(number_s,trials,probability_s,cumulative)
The BINOM.DIST function syntax has the following arguments:
-
Number_s Required. The number of successes in trials.
-
Trials Required. The number of independent trials.
-
Probability_s Required. The probability of success on each trial.
-
Cumulative Required. A logical value that determines the form of the function. If cumulative is TRUE, then BINOM.DIST returns the cumulative distribution function, which is the probability that there are at most number_s successes; if FALSE, it returns the probability mass function, which is the probability that there are number_s successes.
Remarks
-
Number_s and trials are truncated to integers.
-
If number_s, trials, or probability_s is nonnumeric, BINOM.DIST returns the #VALUE! error value.
-
If number_s < 0 or number_s > trials, BINOM.DIST returns the #NUM! error value.
-
If probability_s < 0 or probability_s > 1, BINOM.DIST returns the #NUM! error value.
-
The binomial probability mass function is:

where:
is COMBIN(n,x).
The cumulative binomial distribution is:

Example
Copy the example data in the following table, and paste it in cell A1 of a new Excel worksheet. For formulas to show results, select them, press F2, and then press Enter. If you need to, you can adjust the column widths to see all the data.
|
Data |
Description |
|
|
6 |
Number of successes in trials |
|
|
10 |
Number of independent trials |
|
|
0.5 |
Probability of success on each trial |
|
|
Formula |
Description |
Result |
|
=BINOM.DIST(A2,A3,A4,FALSE) |
Probability of exactly 6 of 10 trials being successful. |
0.2050781 |
Need more help?
Want more options?
Explore subscription benefits, browse training courses, learn how to secure your device, and more.
Communities help you ask and answer questions, give feedback, and hear from experts with rich knowledge.
Calculates the binomial distribution probability for the number of successes from a specified number of trials
Calculate Binomial Distribution in Excel
The BINOM.DIST Function[1] is categorized under Excel Statistical functions. It calculates the binomial distribution probability for the number of successes from a specified number of trials. This binomial distribution Excel guide will show you how to use the function, step by step.
The binomial distribution is a statistical measure that is frequently used to indicate the probability of a specific number of successes occurring from a specific number of independent trials. The two forms used are:
- The Probability Mass Function – Calculates the probability of there being exactly x successes from n independent trials
- The Cumulative Distribution Function – Calculates the probability of there being at most x successes from n independent trials
In financial analysis, the BINOM.DIST function can be useful in finding out, for example, the probability of publishing a best-selling book from a range of books to be published by a company.
Introduced in Excel 2010, BINOM.DIST function is an updated version of the BINOMDIST function.
Formula for Binomial Distribution
=BINOM.DIST(number_s,trials,probability_s,cumulative)
The BINOM.DIST uses the following arguments:
- Number_s (required argument) – This is the number of successes in trials.
- Trials (required argument) – This is the number of independent trials. It must be greater than or equal to 0.
- Probability_s (required argument) – This is the probability of success in each trial.
- Cumulative (required argument) – This is a logical value that determines the form of the function. It can either be:
- TRUE – Uses the cumulative distribution function.
- FALSE – Uses the probability mass function.
To learn more, launch our free Excel crash course now!
How to Use the Binomial Distribution Function in Excel?
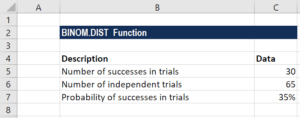
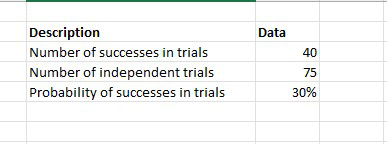
To understand the uses of the BINOM.DIST function, let us consider an example:
Example
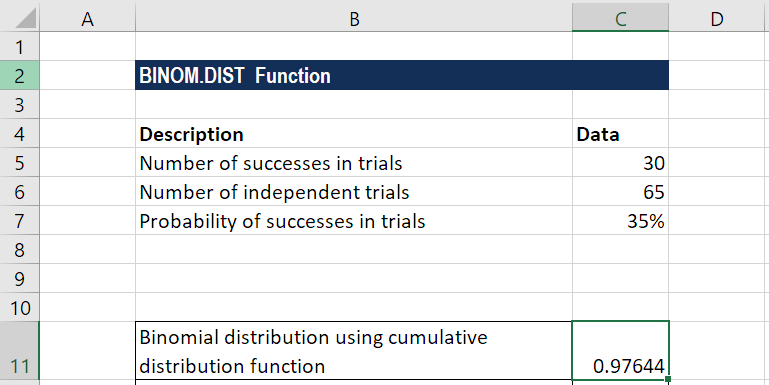
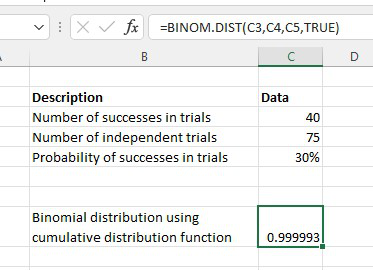
Suppose we are given the following data:
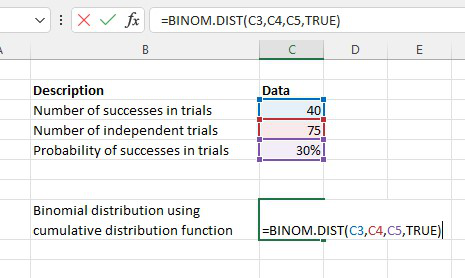
The formula for calculating binomial distribution using the cumulative distribution function is shown below:
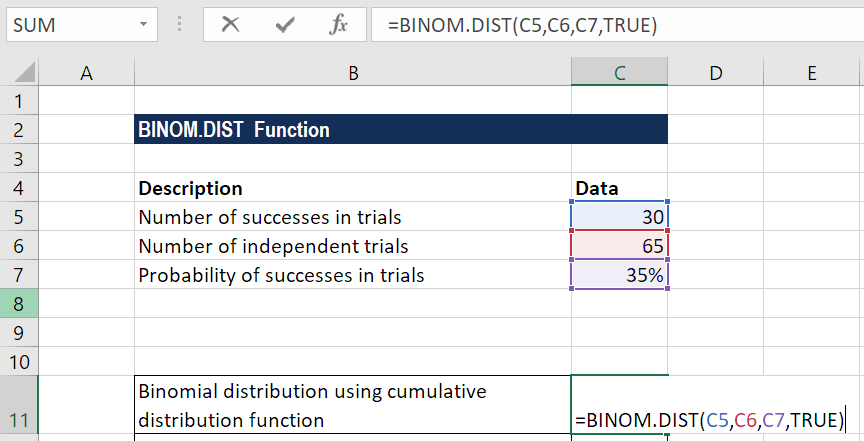
We get the result below:
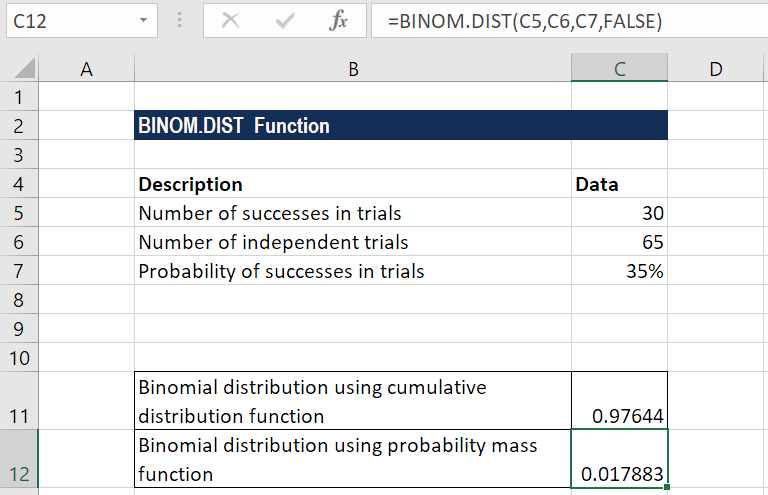
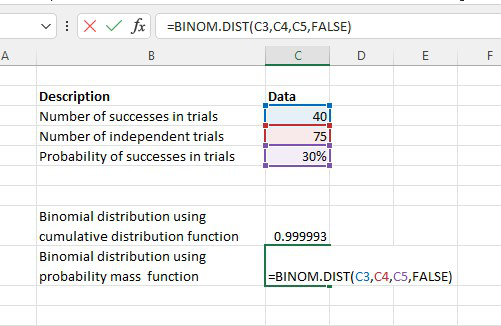
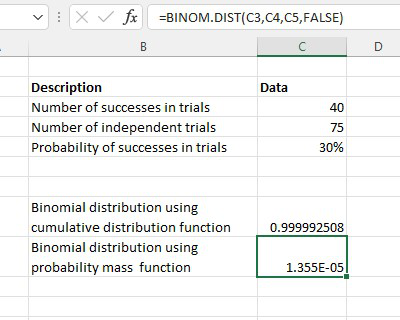
The formula for calculating binomial distribution using the probability mass function is shown below:
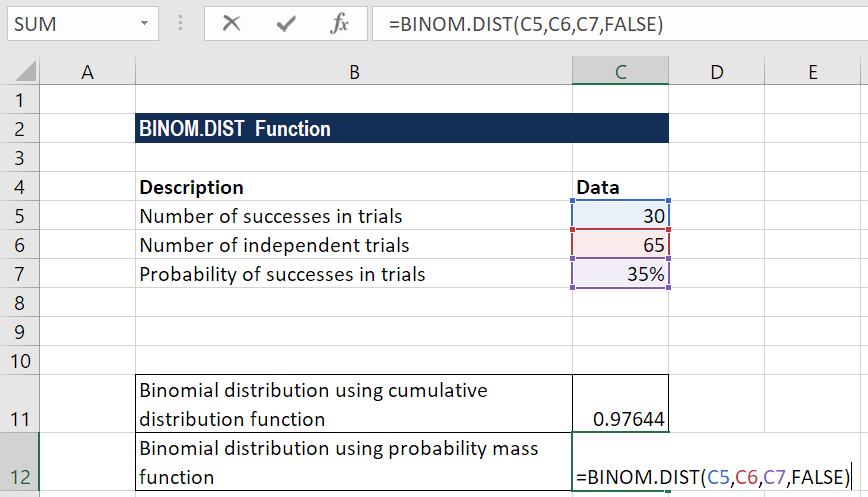
We get the result below:
A Few Notes About the BINOM.DIST Function
- The BINOM.DIST function will truncate all numerical values to Integer.
- #VALUE! error – Occurs when any of the arguments provided is non-numeric.
- #NUM! error – Occurs when:
- The given probability is less than zero or greater than 1.
- The given number_s is less than zero or greater than the number of trials.
Additional Resources
Thanks for reading CFI’s guide to the binomial distribution function in Excel! By taking the time to learn and master these functions, you’ll significantly speed up your financial analysis. To learn more, check out these additional CFI resources:
- Free Statistics Fundamentals Course
- Excel Functions for Finance
- Advanced Excel Formulas Course
- Advanced Excel Formulas You Must Know
- Excel Shortcuts for PC and Mac
- See all Excel resources
The binomial distribution is one of the most commonly used distributions in statistics. This tutorial explains how to use the following functions in Excel to solve questions about binomial probabilities:
- BINOM.DIST
- BINOM.DIST.RANGE
- BINOM.INV
BINOM.DIST
The function BINOM.DIST finds the probability of getting a certain number of successes in a certain number of trials where the probability of success on each trial is fixed.
The syntax for BINOM.DIST is as follows:
BINOM.DIST(number_s, trials, probability_s_cumulative)
- number_s: number of successes
- trials: total number of trials
- probability_s: probability of success on each trial
- probability_s_cumulative: TRUE returns the cumulative probability; FALSE returns the exact probability
The following examples illustrate how to solve binomial probability questions using BINOM.DIST:
Example 1
Nathan makes 60% of his free-throw attempts. If he shoots 12 free throws, what is the probability that he makes exactly 10?
To answer this question, we can use the following formula in Excel: BINOM.DIST(10, 12, 0.6, FALSE)

The probability that Nathan makes exactly 10 free throw attempts out of 12 is 0.063852.
Example 2
Marty flips a fair coin 5 times. What is the probability that the coin lands on heads 2 times or fewer?
To answer this question, we can use the following formula in Excel: BINOM.DIST(2, 5, 0.5, TRUE)

The probability that the coin lands on heads 2 times or fewer is 0.5.
Example 3
Mike flips a fair coin 5 times. What is the probability that the coin lands on heads more than 3 times?
To answer this question, we can use the following formula in Excel: 1 – BINOM.DIST(3, 5, 0.5, TRUE)

The probability that the coin lands on heads more than 3 times is 0.1875.
Note: In this example, BINOM.DIST(3, 5, 0.5, TRUE) returns the probability that the coin lands on heads 3 times or fewer. So, to find the probability that the coin lands on heads more than 3 times, we simply use 1 – BINOM.DIST(3, 5, 0.5, TRUE).
BINOM.DIST.RANGE
The function BINOM.DIST.RANGE finds the probability of getting a certain number of successes in a certain range, based on a certain number of trials where the probability of success on each trial is fixed.
The syntax for BINOM.DIST.RANGE is as follows:
BINOM.DIST.RANGE(trials, probability_s, number_s, number_s2)
- trials: total number of trials
- probability_s: probability of success on each trial
- number_s: minimum number of successes
- number_s2: maximum number of successes
The following examples illustrate how to solve binomial probability questions using BINOM.DIST.RANGE:
EXAMPLE 1
Debra flips a fair coin 5 times. What is the probability that the coin lands on heads between 2 and 4 times?
To answer this question, we can use the following formula in Excel: BINOM.DIST.RANGE(5, 0.5, 2, 4)

The probability that the coin lands on heads between 2 and 4 times is 0.78125.
EXAMPLE 2
It is known that 70% of men support a certain law. If 10 men are randomly selected, what is the probability that between 4 and 6 of them support the law?
To answer this question, we can use the following formula in Excel: BINOM.DIST.RANGE(10, 0.7, 4, 6)

The probability that between 4 and 6 of the randomly selected men support the law is 0.339797.
EXAMPLE 3
Teri makes 90% of her free-throw attempts. If she shoots 30 free throws, what is the probability that she makes between 15 and 25?
To answer this question, we can use the following formula in Excel: BINOM.DIST.RANGE(30, .9, 15, 25)

The probability that she makes between 15 and 25 free throws is 0.175495.
BINOM.INV
The function BINOM.INV finds the smallest value for which the cumulative binomial distribution is greater than or equal to a criterion value.
The syntax for BINOM.INV is as follows:
BINOM.INV(trials, probability_s, alpha)
- trials: total number of trials
- probability_s: probability of success on each trial
- alpha: criterion value between 0 and 1
The following examples illustrate how to solve binomial probability questions using BINOM.INV:
EXAMPLE 1
Duane flips a fair coin 10 times. What is the smallest number of times the coin could land on heads so that the cumulative binomial distribution is greater than or equal to 0.4?
To answer this question, we can use the following formula in Excel: BINOM.INV(10, 0.5, 0.4)

The smallest number of times the coin could land on heads so that the cumulative binomial distribution is greater than or equal to 0.4 is 5.
EXAMPLE 2
Duane flips a fair coin 20 times. What is the smallest number of times the coin could land on heads so that the cumulative binomial distribution is greater than or equal to 0.4?
To answer this question, we can use the following formula in Excel: BINOM.INV(20, 0.5, 0.4)

The smallest number of times the coin could land on heads so that the cumulative binomial distribution is greater than or equal to 0.4 is 9.
EXAMPLE 3
Duane flips a fair coin 30 times. What is the smallest number of times the coin could land on tails so that the cumulative binomial distribution is greater than or equal to 0.7?
To answer this question, we can use the following formula in Excel: BINOM.INV(20, 0.5, 0.4)

The smallest number of times the coin could land on tails so that the cumulative binomial distribution is greater than or equal to 0.7 is 16.
Биномиальное распределение является одним из наиболее часто используемых распределений в статистике. В этом руководстве объясняется, как использовать следующие функции в Excel для решения вопросов о биномиальных вероятностях:
- БИНОМ.РАСП
- БИНОМ.РАСП.ДИАПАЗОН
- БИНОМ.ОБР
БИНОМ.РАСП
Функция БИНОМ.РАСП находит вероятность получения определенного количествауспехи в определенном количестве испытаний, где вероятность успеха в каждом испытании фиксирована.
Синтаксис БИНОМ.РАСП следующий:
БИНОМ.РАСП (число_с, испытаний, вероятность_с_кумулятивное)
- number_s: количество успехов
- испытания: общее количество испытаний
- Вероятность_s: вероятность успеха в каждом испытании.
- Вероятность_s_cumulative: TRUE возвращает кумулятивную вероятность; FALSE возвращает точную вероятность
Следующие примеры иллюстрируют, как решать вопросы биномиальной вероятности, используя БИНОМ.РАСП :
Пример 1
Натан делает 60% своих штрафных бросков. Если он выполнит 12 штрафных бросков, какова вероятность того, что он сделает ровно 10?
Чтобы ответить на этот вопрос, мы можем использовать следующую формулу в Excel: БИНОМ.РАСП(10, 12, 0,6, ЛОЖЬ)
Вероятность того, что Натан выполнит ровно 10 штрафных бросков из 12, равна 0,063852 .
Пример 2
Марти подбрасывает правильную монету 5 раз. Какова вероятность того, что монета выпадет орлом 2 раза или меньше?
Чтобы ответить на этот вопрос, мы можем использовать следующую формулу в Excel: БИНОМ.РАСП(2, 5, 0,5, ИСТИНА)
Вероятность того, что монета выпадет орлом 2 раза или менее, равна 0,5 .
Пример 3
Майк подбрасывает правильную монету 5 раз. Какова вероятность того, что монета выпадет орлом более 3 раз?
Чтобы ответить на этот вопрос, мы можем использовать следующую формулу в Excel: 1 – БИНОМ.РАСП(3, 5, 0,5, ИСТИНА)
Вероятность того, что монета выпадет орлом более 3 раз, равна 0,1875 .
Примечание. В этом примере функция БИНОМ.РАСП(3, 5, 0,5, ИСТИНА) возвращает вероятность того, что монета выпадет орлом 3 раза или меньше. Итак, чтобы найти вероятность того, что монета выпадет орлом более 3 раз, мы просто используем 1 – БИНОМ.РАСП(3, 5, 0,5, ИСТИНА).
БИНОМ.РАСП.ДИАПАЗОН
Функция БИНОМ.РАСП.ДИАПАЗОН находит вероятность получения определенного количествауспехи в определенном диапазоне, основанные на определенном количестве испытаний, где вероятность успеха в каждом испытании фиксирована.
Синтаксис БИНОМ.РАСП.ДИАПАЗОН следующий:
БИНОМ.РАСП.ДИАПАЗОН (испытания, вероятность_с, число_с, число_с2)
- испытания: общее количество испытаний
- Вероятность_s: вероятность успеха в каждом испытании.
- number_s: минимальное количество успехов
- number_s2: максимальное количество успехов
Следующие примеры иллюстрируют, как решать вопросы биномиальной вероятности, используя БИНОМ.РАСП.ДИАПАЗОН :
ПРИМЕР 1
Дебра подбрасывает правильную монету 5 раз. Какова вероятность того, что монета выпадет орлом от 2 до 4 раз?
Чтобы ответить на этот вопрос, мы можем использовать следующую формулу в Excel: БИНОМ.РАСП.ДИАПАЗОН(5, 0,5, 2, 4)
Вероятность того, что монета выпадет орлом от 2 до 4 раз, равна 0,78125 .
ПРИМЕР 2
Известно, что 70% мужчин поддерживают тот или иной закон. Если наугад выбрать 10 мужчин, какова вероятность того, что от 4 до 6 из них поддержат закон?
Чтобы ответить на этот вопрос, мы можем использовать следующую формулу в Excel: БИНОМ.РАСП.ДИАПАЗОН(10, 0,7, 4, 6)
Вероятность того, что закон поддержат от 4 до 6 случайно выбранных мужчин, равна 0,339797 .
ПРИМЕР 3
Тери делает 90% своих штрафных бросков. Если она выполнит 30 штрафных бросков, какова вероятность того, что она сделает от 15 до 25?
Чтобы ответить на этот вопрос, мы можем использовать следующую формулу в Excel: БИНОМ.РАСП.ДИАПАЗОН(30, .9, 15, 25)
Вероятность того, что она выполнит от 15 до 25 штрафных бросков, равна 0,175495 .
БИНОМ.ОБР
Функция БИНОМ.ОБР находит наименьшее значение, для которого кумулятивное биномиальное распределение больше или равно значению критерия.
Синтаксис для БИНОМ.ОБР следующий:
БИНОМ.ОБР (испытания, вероятность_с, альфа)
- испытания: общее количество испытаний
- Вероятность_s: вероятность успеха в каждом испытании.
- альфа: значение критерия от 0 до 1
Следующие примеры иллюстрируют, как решать вопросы о биномиальной вероятности, используя БИНОМ.ОБР :
ПРИМЕР 1
Дуэйн подбрасывает правильную монету 10 раз. Какое наименьшее количество раз монета может упасть орлом, чтобы кумулятивное биномиальное распределение было больше или равно 0,4?
Чтобы ответить на этот вопрос, мы можем использовать следующую формулу в Excel: БИНОМ.ОБР(10, 0,5, 0,4)
Наименьшее количество раз, когда монета может упасть орлом, чтобы кумулятивное биномиальное распределение было больше или равно 0,4, равно 5 .
ПРИМЕР 2
Дуэйн подбрасывает правильную монету 20 раз. Какое наименьшее количество раз монета может упасть орлом, чтобы кумулятивное биномиальное распределение было больше или равно 0,4?
Чтобы ответить на этот вопрос, мы можем использовать следующую формулу в Excel: БИНОМ.ОБР(20, 0,5, 0,4)
Наименьшее количество раз, когда монета может упасть орлом, чтобы кумулятивное биномиальное распределение было больше или равно 0,4, равно 9 .
ПРИМЕР 3
Дуэйн подбрасывает правильную монету 30 раз. Какое наименьшее количество раз монета может выпасть решкой, чтобы кумулятивное биномиальное распределение было больше или равно 0,7?
Чтобы ответить на этот вопрос, мы можем использовать следующую формулу в Excel: БИНОМ.ОБР(20, 0,5, 0,4)
Наименьшее количество раз, когда монета может выпасть решкой, чтобы кумулятивное биномиальное распределение было больше или равно 0,7, равно 16 .
This tutorial will demonstrate how to work with the Binomial Distribution in Excel and Google Sheets.

BINOMDIST Function Overview
The BINOMDIST function in Excel allows us to calculate two things:
- The probability of a certain number of binary outcomes occurring (ex. the probability of flipping a coin 10 times, and exactly 7 of the attempts landing as heads).
- The cumulative probability (ex. The probability that the coin lands on heads anywhere from 0-7 times).
What is the Binomial Distribution?
The binomial distribution encompasses the range of probabilities for any binary event that is repeated over time. For example, say you flip a fair coin 10 times. Certainly you “expect” there to be 5 heads to and 5 tails, but you may still end up with 7 heads and 3 tails. The binomial distribution allows us to measure the exact probabilities of these different events, as well as the overall distribution of likelihood for different combinations.
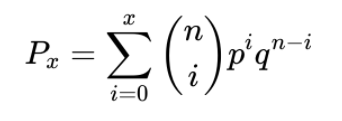
The probability of any individual number of successes within the Binomial Distribution (otherwise known as a Bernoulli Trial) reads as follows:
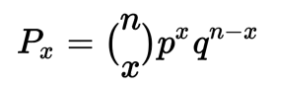
Where:
n = the number of trials
x = the number of “successes”
p = the probability of success for any individual trial
q = the probability of failure for any individual trial, also denoted as 1-p.
Binomial Distribution Example
In the example above, where you’re finding the probability of landing 7 out of 10 heads on a fair coin, you can plug in the following values:
n = 10
x = 7
p = 0.5
q = 0.5
After solving, you end up with a probability 0.1172 (11.72%) that exactly 7 of the 10 flips land on heads.
Binomial Distribution Excel Examples
To find the individual and cumulative probabilities in Excel, we will use the BINOMDIST Function in Excel. Using the example above with 7 out of 10 coins coming up heads, the Excel formula would be:
=BINOMDIST(7, 10, 1/2, FALSE)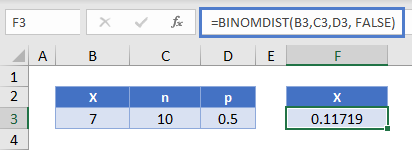
Where:
- The first argument (7) is x
- the second argument (10) is n
- The third argument (½) is p
- The fourth argument (FALSE), if TRUE, has Excel calculate the cumulative probability for all values less than or equal to x.
Binomial Distribution Table & Chart
Next let’s create a probability distribution table in Excel. The probability distribution calculates the probability of each number of occurrences.
=BINOMDIST(B10,10, 1/2, FALSE)
Reading this table: there is about a 12% probability of exactly 7 of 10 coins coming up heads.
We can create a chart from the Binomial Probability Distribution table above.
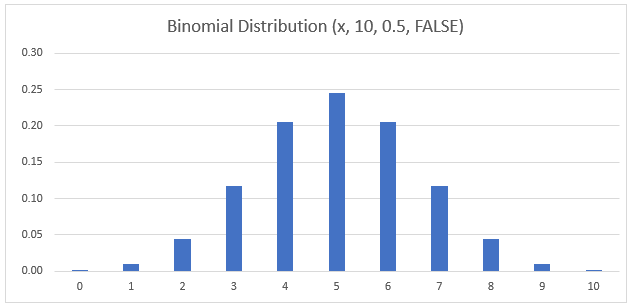
Binomial Distribution Chart
Notice that the binomial distribution for this experiment peaks at x=5. This is because the expected number of heads when flipping a fair coin 10 times is 5.
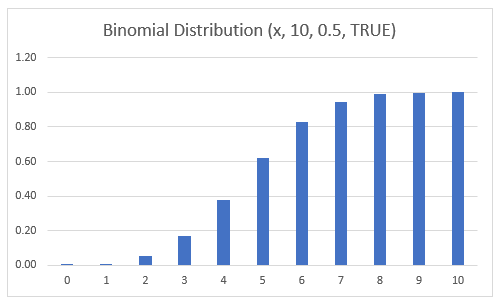
Binomial Cumulative Probability Distribution
Alternatively, you may choose to focus on the Cumulative Probability Distribution instead. This measures the probability of a number of success less than or equal to a certain number.
In graphical form, it looks like this:
To calculate the cumulative probability, you can simple sum up the individual probabilities calculated in the previous section.
Or you can use the BINOMDIST Function like so:
=BINOMDIST(B10, 10, 1/2, TRUE)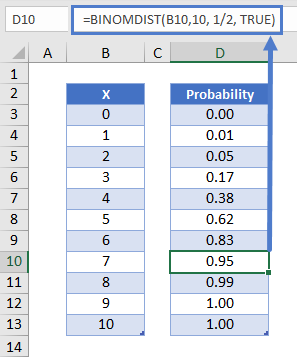
Notice that to calculate the cumulative probability we set the last argument to TRUE instead of FALSE.
Mathematically, this formula can be expressed as follows:
BINOM.DIST.RANGE – Find Probability of Range of Values
While BIMOMDIST serves as a way to find the probability of a single discrete point, the BINOM.DIST.RANGE function allows us to find the probability of achieving a certain range of successes.
Using the heads-or-tails example, we can find the probability that between 6 and 8 of our 10 attempts land as heads with the following formula.
=BINOM.DIST.RANGE(10, 0.5, 6, 8)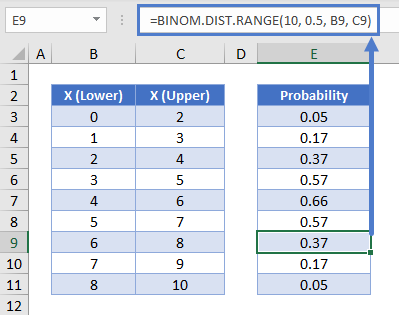
Binomial Expected Value – E(x)
For a binomial distribution of n number of Bernoulli trials, we can express the expected value for the number of successes:
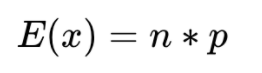
This can be calculated in Excel like so:
=B5*B6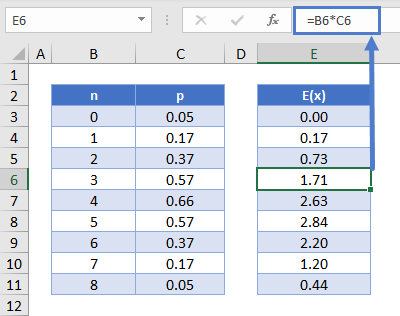
Binomial Variance – Var(x)
To calculate the variance of the distribution, use the formula:
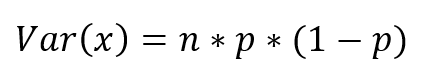
This can be calculated in Excel like so:
=B6*C6*(1-C6)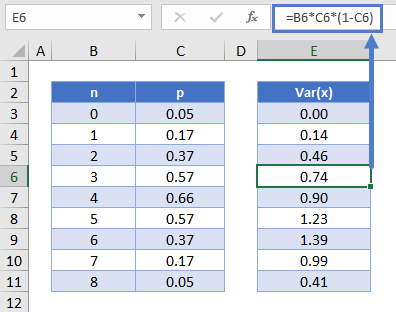
Contents
- 1 What is binomial Dist range excel?
- 2 How do you run a binomial test in Excel?
- 3 What does E mean in Poisson distribution?
- 4 What are the conditions for binomial expansion?
- 5 What is the difference between Poisson and binomial distribution?
- 6 How do you create a Poisson distribution in Excel?
- 7 What are the mean and variance for a binomial distribution?
- 8 What’s the difference between binomial PD and binomial CD?
- 9 How do you expand a binomial expansion?
- 10 Is Binomial Expansion same as Taylor series?
- 11 Is binomial distribution discrete or continuous?
- 12 What are the features of binomial distribution?
- 13 Is binomial distribution normal?
- 14 What is Poisson function in Excel?
- 15 How do you create a Poisson distribution?
- 16 What is cumulative in Poisson Excel?
What is binomial Dist range excel?
The BINOM. DIST. RANGE function is categorized under Excel Statistical functions.It will calculate the binomial distribution probability for the number of successes from a specified number of trials falling into a specified range.
How do you run a binomial test in Excel?
We will enter the following formula into Excel: P(x ≥ 46) = 1 – BINOM. DIST(45, 50, 0.8, TRUE) = 1 – 0.9815 = 0.0185.
How to Perform a Binomial Test in Excel
- number_s: number of “successes”
- trials: total number of trials.
- probability_s: the probability of success on each trial.
- cumulative: If TRUE, then BINOM.
What does E mean in Poisson distribution?
The following notation is helpful, when we talk about the Poisson distribution. e: A constant equal to approximately 2.71828. (Actually, e is the base of the natural logarithm system.) μ: The mean number of successes that occur in a specified region.
What are the conditions for binomial expansion?
Properties for the binomial expansion include: the number of terms is one more than n (the exponent ), and the sum of the exponents in each term adds up to n . Applying (nr−1)an−(r−1)br−1 ( n r − 1 ) a n − ( r − 1 ) b r − 1 and (nk)=n! (n−k)!k! ( n k ) = n !
What is the difference between Poisson and binomial distribution?
Binomial distribution is one in which the probability of repeated number of trials are studied. Poisson Distribution gives the count of independent events occur randomly with a given period of time. Only two possible outcomes, i.e. success or failure. Unlimited number of possible outcomes.
How do you create a Poisson distribution in Excel?
In This Article
- Select a cell for POISSON. DIST ‘s answer.
- From the Statistical Functions menu, select POISSON. DIST to open its Function Arguments dialog box.
- In the Function Arguments dialog box, enter the appropriate values for the arguments.
- Click OK to put the answer into the selected cell.
What are the mean and variance for a binomial distribution?
The binomial distribution has the following properties: The mean of the distribution (μx) is equal to n * P . The variance (σ2x) is n * P * ( 1 – P ). The standard deviation (σx) is sqrt[ n * P * ( 1 – P ) ].
What’s the difference between binomial PD and binomial CD?
For example, if you were tossing a coin to see how many heads you were going to get, if the coin landed on heads that would be a “success.” The difference between the two functions is that one (BinomPDF) is for a single number (for example, three tosses of a coin), while the other (BinomCDF) is a cumulative probability
How do you expand a binomial expansion?
To get started, you need to identify the two terms from your binomial (the x and y positions of our formula above) and the power (n) you are expanding the binomial to. For example, to expand (2x-3)³, the two terms are 2x and -3 and the power, or n value, is 3.
Is Binomial Expansion same as Taylor series?
The binomial expansion is a Taylor expansion with a finite number of terms. This is the case for the expansion of f(x)^n where f(x) is a polynomial and n is a natural number. If f(x) is not a polynomial and/or n is not a natural number, the Taylor expansion has an infinite number of terms.
Is binomial distribution discrete or continuous?
The binomial distribution is a common discrete distribution used in statistics, as opposed to a continuous distribution, such as the normal distribution.
What are the features of binomial distribution?
1: The number of observations n is fixed. 2: Each observation is independent. 3: Each observation represents one of two outcomes (“success” or “failure”). 4: The probability of “success” p is the same for each outcome.
Is binomial distribution normal?
The main difference between normal distribution and binomial distribution is that while binomial distribution is discrete. This means that in binomial distribution there are no data points between any two data points. This is very different from a normal distribution which has continuous data points.
What is Poisson function in Excel?
A common application of the Poisson distribution is predicting the number of events over a specific time, such as the number of cars arriving at a toll plaza in 1 minute.
How do you create a Poisson distribution?
The Poisson Distribution formula is: P(x; μ) = (e–μ) (μx) / x! Let’s say that that x (as in the prime counting function is a very big number, like x = 10100. If you choose a random number that’s less than or equal to x, the probability of that number being prime is about 0.43 percent.
What is cumulative in Poisson Excel?
Excel has two functions that can calculate it: POISSON(x, mean, cumulative). When the last argument (cumulative) is set to TRUE, POISSON returns the cumulative probability that the observed value of a Poisson random variable with specified mean will be less than or equal to x .
The BINOM.DIST Function is ordered under Excel Statistical capabilities. It works out the binomial distribution likelihood for the number of triumphs from a predetermined number of preliminaries. This binomial distribution Excel guide will tell you the best way to utilize the capability, bit by bit. The binomial distribution is a factual measure that is regularly used to show the likelihood of a particular number of victories happening from a particular number of free preliminaries. The two structures utilized are:
- The Probability Mass Function: Ascertains the likelihood of there being precisely x triumphs from n autonomous preliminaries.
- The Cumulative Distribution Function: Computes the likelihood of there being all things considered x triumphs from n autonomous preliminaries.
In the monetary examination, the BINOM.DIST capability can help in finding out, for instance, the likelihood of distributing a smash hit book from a scope of books to be distributed by an organization.
Formula for Binomial Distribution
=BINOM.DIST(number_s,trials,probability_s,cumulative)
The BINOM.DIST utilizes the accompanying contentions:
- Number_s (required argument): This is the number of accomplishments in preliminaries.
- Trials (required argument): This is the number of autonomous preliminaries. It should be more noteworthy than or equivalent to 0.
- Probability_s (required argument): This is the likelihood of progress in every preliminary.
- Cumulative (required argument): This is a legitimate worth that decides the type of capability. It can either be:
- TRUE: Utilizes the aggregate conveyance capability.
- FALSE: Utilizes the likelihood mass capability.
How to Use the Binomial Distribution Function in Excel?
To comprehend the purposes of the BINOM.DIST capability, let us think about a model. Example: Assume we are given the accompanying information,
Step 1: The equation for ascertaining binomial distribution utilizing the total distribution capability is displayed underneath,
Step 2: We come by the outcome underneath.
Step 3: The recipe for working out binomial distribution utilizing the likelihood mass capability is displayed beneath:
Step 4: We come by the outcome beneath.
A Few Notes About the BINOM.DIST Function
- The BINOM.DIST capability will shorten all mathematical qualities to Integer.
- #VALUE! error – Occurs when any of the contentions given is non-numeric.
- #NUM! error – Occurs when:
- The given likelihood is under nothing or more noteworthy than 1.
- The given number_s is under nothing or more noteworthy than the number of preliminaries.
Содержание
- Обзор функции БИНОМРАСП
- Что такое биномиальное распределение?
- Пример биномиального распределения
- Примеры биномиального распределения в Excel
- Таблица и диаграмма биномиального распределения
- Биномиальное кумулятивное распределение вероятностей
- Биномиальное ожидаемое значение — E (x)
- Биномиальная дисперсия — Var (x)
В этом руководстве будет показано, как работать с биномиальным распределением в Excel и Google Таблицах.

Обзор функции БИНОМРАСП
Функция БИНОМРАСП в Excel позволяет нам вычислять две вещи:
- В вероятность определенного количества бинарных исходов выпадение (например, вероятность подбросить монету 10 раз и ровно 7 попыток выпадения орла).
- В совокупная вероятность (например, вероятность того, что монета упадет орлом где-нибудь от 0 до 7 раз).
Что такое биномиальное распределение?
Биномиальное распределение охватывает диапазон вероятностей любого двоичного события, которое повторяется во времени. Например, вы подбрасываете честную монету 10 раз. Конечно, вы «ожидаете», что будет 5 орлов и 5 решек, но вы все равно можете получить 7 решек и 3 решки. Биномиальное распределение позволяет нам измерить точные вероятности этих различных событий, а также общее распределение вероятностей для различных комбинаций.
Вероятность любого индивидуального числа успехов в рамках биномиального распределения (также известного как испытание Бернулли) выглядит следующим образом:

Где:
n = количество испытаний
x = количество «успехов»
p = вероятность успеха для любого отдельного испытания
q = вероятность неудачи для любого отдельного испытания, также обозначается как 1-p.
Пример биномиального распределения
В приведенном выше примере, где вы находите вероятность выпадения 7 из 10 орлов на честной монете, вы можете подставить следующие значения:
| 1234 | n = 10х = 7р = 0,5q = 0,5 |
После решения вы получите вероятность 0,1172 (11,72%), что ровно 7 из 10 флипов выпадут на орел.
Чтобы найти индивидуальную и совокупную вероятности в Excel, мы будем использовать функцию БИНОМРАСП в Excel. Используя приведенный выше пример с 7 из 10 выпадающих орлов, формула Excel будет выглядеть так:
| 1 | = БИНОМРАСП (7; 10; 1/2; ЛОЖЬ) |

Где:
- Первый аргумент (7) — это x
- второй аргумент (10) равен n
- Третий аргумент (½) равен p
- Четвертый аргумент (ЛОЖЬ), если ИСТИНА, заставляет Excel вычислять кумулятивную вероятность для всех значений, меньших или равных x.
Таблица и диаграмма биномиального распределения
Теперь давайте создадим таблица распределения вероятностей в Excel. Распределение вероятностей вычисляет вероятность каждого количества событий.
| 1 | = БИНОМРАСП (B10,10; 1/2; ЛОЖЬ) |

Читая эту таблицу: вероятность того, что ровно 7 из 10 монет выпадет орлом, составляет около 12%.
Мы можем создать диаграмму из приведенной выше таблицы распределения биномиальной вероятности.

Диаграмма биномиального распределения
Обратите внимание, что биномиальное распределение для этого эксперимента достигает максимума при x = 5. Это потому, что ожидаемое количество орлов при подбрасывании справедливой монеты 10 раз равно 5.
Биномиальное кумулятивное распределение вероятностей
В качестве альтернативы вы можете сосредоточиться на кумулятивном распределении вероятностей. Это измеряет вероятность успеха, меньшее или равное определенному числу.
В графическом виде это выглядит так:

Чтобы вычислить кумулятивную вероятность, вы можете просто суммировать отдельные вероятности, рассчитанные в предыдущем разделе.
Или вы можете использовать функцию БИНОМРАСП так:
| 1 | = БИНОМРАСП (B10; 10; 1/2; ИСТИНА) |

Обратите внимание, что для расчета кумулятивной вероятности мы устанавливаем последний аргумент в ИСТИНА вместо ЛОЖЬ.
Математически эту формулу можно выразить следующим образом:

BINOM.DIST.RANGE — найти вероятность диапазона значений
В то время как БИМОМРАСП служит способом определения вероятности одной дискретной точки, функция БИНОМРАСП.РАСП позволяет нам найти вероятность достижения определенного диапазона успехов.
Используя пример орла или решки, мы можем определить вероятность того, что от 6 до 8 из наших 10 попыток окажутся орлом, по следующей формуле.
| 1 | = ДИАПАЗОН.РАСП (10; 0,5; 6;  |

Биномиальное ожидаемое значение — E (x)
Для биномиального распределения n попыток Бернулли мы можем выразить математическое ожидание количества успешных попыток:

Это можно рассчитать в Excel так:

Биномиальная дисперсия — Var (x)
Чтобы вычислить дисперсию распределения, используйте формулу:

Это можно рассчитать в Excel так:

Размещено в Без рубрики