
Let’s learn about what is excel and top 10 uses of excel in business with the Tech Learn, the most reputed and trustworthy online platform to learn anything and everything.
What is Microsoft Excel?
Microsoft Excel is used for creating grids of numbers, formulas requiring calculations and text. Thus, it is a spreadsheet program which is tremendously useful for every organizations and businesses. It is mainly used for recording the income, expenditures, chart data, plan budgets, and briefly present financial results.
List of Most Popular Uses of Microsoft Excel in Business
- Storing and Analyzing data
- Make your work easier
- Spreadsheets and Data recovery
- Mathematical formulas make calculation easy
- Security
- Add complexity to data presentations
- Online access
- Manage expenses
- Assist in developing future strategy
- Keeps data combined at one place
1. Storing and Analyzing data in Excel
With the help of MS Excel, one can easily analyze a very large amount of data for checking the new trends. Charts and graphs help you in summarizing and storing the data in a better way. Look into screen shoot

2. Make your work easier
MS Excel provides outstanding tools which help in saving out time by making our work very easy. There are great tools for filtering, sorting and searching. Combining these wonderful tools with pivot tables, tables etch can make you finish your very faster.
3. Spreadsheets and Data recovery
One of the best uses of excel is that in case If your data get lost for some reasons then you can easily get it back without any issue. Also, there are spreadsheets which makes work easier and steadier.
4. Mathematical formulas make calculation easy
Another outstanding use of excel is that lot of formulas are there for doing different operations like finding average, sum etc. which make you to do big calculations very easily.
5. Security
Security is must as it keeps your personal data. MS Excel keep all your file safe by password-protected with the help of visual basic programming.
6. Add complexity to data presentations
Next use of MS Excel is that it helps you in adding more sophistication to your data presentations which means that you can improve the data bars, you can highlight any specific items that you want to highlight and make your data much more presentable easily.
7. Online access
The best use of excel is that no matter where you are, you have your device or not but you can easily excess it online from anywhere and anytime. Use excel online – https://office.live.com/start/excel.aspx
Learn – Free Online Courses with certificate
8. Manage expenses
You can manage your expenses with the help of Microsoft excel. You can easily make a table of your expenses and with the help of the mathematical formulas provided by MS Excel, you can calculate the total amount easily. watch this video to learnin detail how to manage expenses in excel – https://youtu.be/i9NRF7JcV7k?t=406
9. Assist in developing future strategy
It gives you a facility of making chart and graphs so with the help of making graphs you can set a goal for yourself and pie charts allow you to check your progress level.
10. Keeps data combined at one place
This is also one of the best uses of excel. You can choose a single location to str your data which allow you to find out your files easily. It saves your time as there’s no need to check the files in different folders.
This article covers brief description about the uses of excel, what is excel formula and features of excel. The aim of the article is to provide all the necessary knowledge that you must have about Microsoft Excel. For more information about information security, new trends in technology and happenings in the world, keep visiting the Tech Learn.
Frequently asked questions for excel uses
- What are the uses of Excel?
Top 10 uses of excel:
1. Storing and Analyzing data
2. Make your work easier
3. Spreadsheets and Data recovery
4. Mathematical formulas make calculation easy
5. Security
6. Add complexity to data presentations
7. Online access
8. Manage expenses
9. Assist in developing future strategy
10. Keeps data combined at one place - What are the 3 common uses for Excel?
In all industries different uses of excel. But if we talk about uses of excel in business these here are 3 common uses:
1. Manage Data
2. Manages company expenses
3. Reporting - What are the benefits of using Excel?
Top 3 benefit of using excel in business:
1. You can easily mange all data
2. Best benefit of excel, you can access online your worksheet
3. Save time – through Mathematical formulas you can easily calculate.
List of Top 12 Important Uses of Microsoft Excel
There are plenty of uses of excel, and the list goes on, but here we have listed some of the important uses of Microsoft excel to start the things for a beginner.
- Get Quick Totals
- Data Analysis and Interpretation
- Plenty of Formulas to Work with Data
- Data Organising and Restructuring
- Data Filtering
- Goal Seek AnalysisThe Goal Seek in excel is a “what-if-analysis” tool that calculates the value of the input cell (variable) with respect to the desired outcome. In other words, the tool helps answer the question, “what should be the value of the input in order to attain the given output?”
read more - Flexible and User-Friendly
- Online Access
- Building Dashboards
- Interactive ChartsCharts visuals are better in data depiction, but interactivity gets it better. Interactivity is when the user sees specific values in the excel chart in a more effective, efficient and crystal clear way.read more and Graphs
- Dynamic Formulas
- Automation Through Excel

Now let us discuss each of them in detail along with an Example –
#1 – Get Quick Totals
Getting total or subtotalThe SUBTOTAL excel function performs different arithmetic operations like average, product, sum, standard deviation, variance etc., on a defined range.read more is common, so Excel provides a quick sum of numbers with its AutoSum option. For example, look at the below data in Excel.
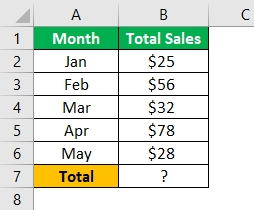
We have monthly numbers above, so to get the quick total in cell B7, press the Auto Sum shortcutThe Excel SUM Shortcut is a function that is used to add up multiple values by simultaneously pressing the “Alt” and “=” buttons in the desired cell. However, the data must be present in a continuous range for this function to function.read more key ALT + = sign.
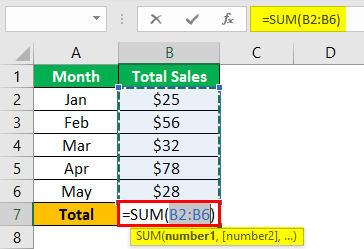
As you can see, it has inserted the SUM function in excel. Press the “Enter” key to get the result.
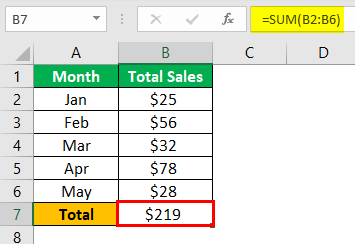
We have a quick total of the numbers above.
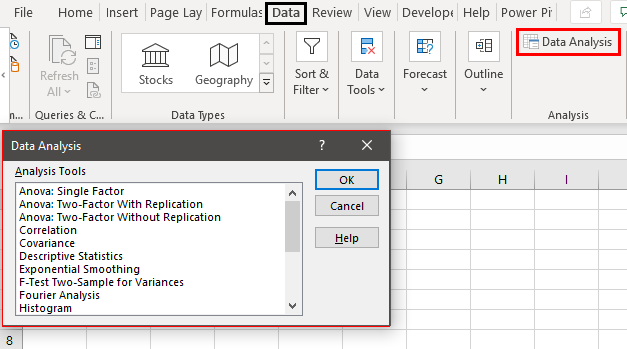
#2 – Data Analysis & Interpretation
The spreadsheet contains data, so telling the story behind the data is what the decision-makers need to make vital decisions in the business world. So, when the data is available with Excel, we can use MS Excel features like pivot tableA Pivot Table is an Excel tool that allows you to extract data in a preferred format (dashboard/reports) from large data sets contained within a worksheet. It can summarize, sort, group, and reorganize data, as well as execute other complex calculations on it.read more and formulas to analyze the data and interpret the numbers quickly and efficiently.
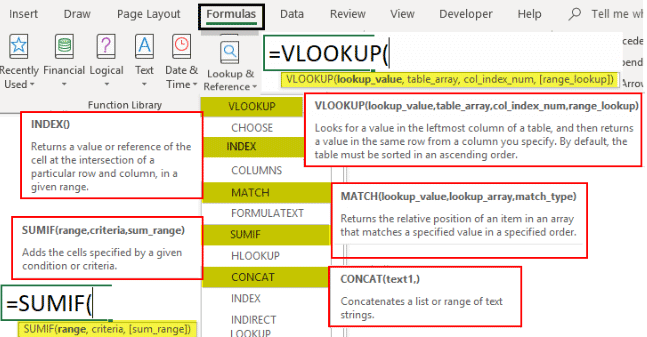
#3 – Plenty of Formulas to Work with Data
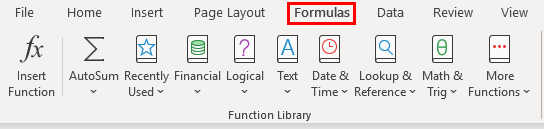
MS Excel comes with plenty of built-in functions to work with data. There are 450+ functions in excel,Excel functions help the users to save time and maintain extensive worksheets. There are 100+ excel functions categorized as financial, logical, text, date and time, Lookup & Reference, Math, Statistical and Information functions.read more, so these functions are categorized as “Financial,” “Logical,” “Text,” “Date & Time,” “Lookup & Reference,” “Math & Trig,” “Statistical,” “Engineering,” “Cube,” “Information,” and “Web.”
#4 – Data Organizing & Restructuring
You cannot get the data ready to use, so we can organize the data using Excel tools. We can reorganize the data according to the users’ needs.
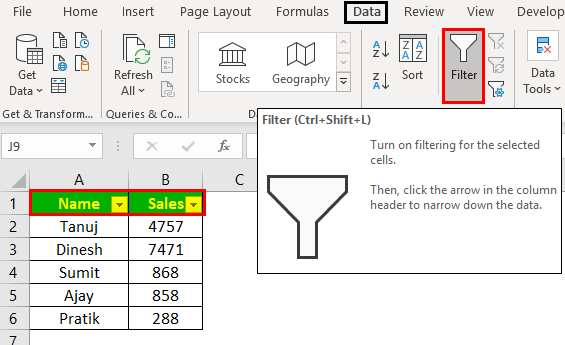
#5 – Data Filtering
Using the option of “Filter” in Excel, we can filter the particular data from the number of rows of data. For example, we can apply a single-column filter and the filter to multiple columns to match multiple criteriaCriteria based calculations in excel are performed by logical functions. To match single criteria, we can use IF logical condition, having to perform multiple tests, we can use nested IF conditions. But for matching multiple criteria to arrive at a single result is a complex criterion-based calculation.read more to filter the data.
#6 – Goal Seek Analysis
When the target is set, and at a certain project stage, we may need to review that target achievement. So, using Excel, we can track all those things and identify what needs to be done in the remaining steps to achieve the desired goals.

#7 – Flexible and User-Friendly
When you compare MS Excel with other spreadsheets, you will find MS Excel as relatively friendly and flexible enough to fit the needs of the users. First, however, one needs the proper training to start things in Excel.
#8 – Online Access
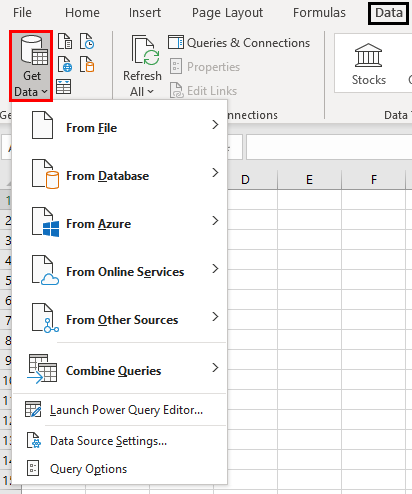
Not all the time, we get the done offline, so some of the data needs to be fetched from online websites. We can import data from “MS Access File,” “Text File,” “From Web,” “From SQL Servers,” “From XML Data Import,” etc. So, getting the data to Excel is not a constraint.
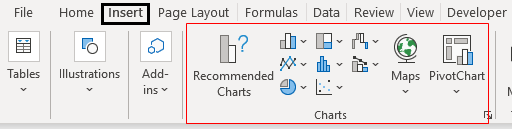
#9 – Building Dashboards
When the story behind the data is read to tell, end users may want to see those summary results in a single page view. So using MS Excel, we can build dashboards that can tell the stories in a single page view. So, not only can we build a dashboard, but it also makes the dashboard interactive.

#10 – Interactive ChartsCharts visuals are better in data depiction, but interactivity gets it better. Interactivity is when the user sees specific values in the excel chart in a more effective, efficient and crystal clear way.read more and Graphs
When the Excel formulas are applied, we can make them dynamic so that when the data range gets an addition or deletion, our formula shows the updated results instantly.
#11 – Dynamic Formulas
When the excel formulasThe term «basic excel formula» refers to the general functions used in Microsoft Excel to do simple calculations such as addition, average, and comparison. SUM, COUNT, COUNTA, COUNTBLANK, AVERAGE, MIN Excel, MAX Excel, LEN Excel, TRIM Excel, IF Excel are the top ten excel formulas and functions.read more are applied, we can make them dynamic so that when the data range gets an addition or deletion, our formula shows the updated results instantly.
#12 – Automation Through Excel
At last, when you move to the advanced level of MS Excel, you may get bored with daily work in Excel. In that case, we can automate the reports in Excel by using the VBA codingVBA code refers to a set of instructions written by the user in the Visual Basic Applications programming language on a Visual Basic Editor (VBE) to perform a specific task.read more language.

Recommended Articles
This article is a guide to the Uses of Excel. Here, we discuss the top 12 important uses of Microsoft Excel, including getting quick totals, data analysis and interpretation, plenty of formulas to work with data, data filtering, etc., and examples and downloadable Excel templates. You may learn more about Excel from the following articles: –
- Divide Cell in Excel
- Excel Count Colored Cells
- Excel Negative Numbers
- Scroll Bars in Excel
Excel may seem like a basic spreadsheet tool, but it has many use cases. Here are some of the practical uses of Excel in daily life.

Excel has long been considered the best tool for data analysts. But Excel’s uses are not restricted to people who work on data regularly. As a layman, there are plenty of Excel uses, which can ease your day-to-day work responsibilities. You can do everything from maintaining attendance in an office/school to creating elaborate budgets to manage your monthly expenditures in Excel.
Excel’s flexibility, multi-faceted usage, and easy-to-use functions make it one of the most preferred applications. If you’re a regular Excel user, here are a few ways to use the application in some related fields.
1. Information Management

Excel has widespread uses in a business environment, especially when managing common frameworks. From using it to drive sales reporting to preparing inventory trackers, there is a bit of everything in Excel. Here are some things you can use Excel within the information management domain:
- Sales Inventory Tracker: Excel has proved its worth within the supply chain management sector. Since it can hold multiple rows of data, it’s a preferred choice for businesses and organizations dealing with products and services. Whenever you are tracking inventory, you can create plenty of pivots and functions to keep track of the various product levels. This way, you can never go wrong with your inventory management and stay on top of your orders and reorders. For best results, you can create an automated data entry form in Excel to ease your data management woes.
- Attendance Trackers: As an employee-centric company, you can use Excel to track your employees’ reporting time, manage their attendance, and create elaborate dashboards to follow their regular work schedules. Each element ties into a more extensive dashboard, wherein you can get a consolidated snapshot of your employees’ whereabouts.
- Performance Reporting: Imagine you need to calculate your employees’ performance metrics and key person indicators (KPIs) monthly. Excel offers everything from managing essential records to having everything in one go. Work with elaborate dashboards, apply various formulas and use their multi-faceted VBA functions to automate your regular jobs.
2. Time Management

Did you know you can use Excel sheets to create your productivity and time trackers? Yes, you read that right; Excel has a vast untapped potential to use its time-driven functions to perform various date- and time-driven specifics. Some common uses of Excel for time management include:
- Daily Planners
- Project ROTAs
- Roadmap Trackers for managing process training timelines
The list is not exhaustive; there are plenty of other ways to use Excel for time management. To take things up a notch, you can even create a Pomodoro Tracker in Excel to stay focused on your tasks.
3. Goal Planning & Tracking Progress

Goal planning is an essential task in every project management field. For example, you can create elaborate time-tracking tools like Gantt charts and other task-driven goal sheets to drive productivity within Excel.
By creating and defining milestones, you can track progress against your goals and map the progress against each aspect with relative ease. You can automate some tasks to track your progress as other collaborators add their progress to a common workbook.
4. Budget Management & Finance Tracking
![]()
Excel is every accountant’s friend; when you have to create detailed monthly spending trackers for your organization, you can use various in-built accounting and math-related functions to keep track of your finances, budgets, and accounts. Organizations and enterprises of various shapes, sizes, and forms use Excel in conjunction with other accounting and finance tools to enhance their accounting standards.
You can create detailed accounting and finance-related tasks to enhance your reporting. In fact, with pivots, conditional formatting, and formulas, you can create in-built alerts within Excel to highlight important aspects relevant to your business.
5. Data Analysis
Data analysis is an integral part of every organization, and many data analysts continue to favor Excel for performing data-driven tasks. You can do everything from creating elaborate performance reporting to analysis-driven hypothesis calculations in Excel. Excel’s functionality and versatility with other data analysis systems and tools have taken precedence over every other tracking system on the market.
It integrates with multiple software, and you can store endless rows of data within sheets. You can combine multiple Excel workbooks with Python and other programming languages, without lifting a finger.
6. Data Visualization

Businesses and enterprises rely on data to fuel their insights. These insights are helpful when you have to make well-informed decisions to predict the future.
What’s the best way to derive insights? It’s simple; you visualize data, so people can quickly understand what you’re trying to tell them. Create multiple graphs, or load these data sheets into visualization software like Tableau and PowerBI to bring your data to life.
Excel’s versatility comes to the fore, since you can create elaborate graphs and visualizations within the application without venturing over to other platforms. Nonetheless, it’s good to know that external integration options are available if you ever need to go down that route.
7. Expense Management

Homemakers and householders use Excel to keep track of their daily expenditures. Imagine having a simple sheet that houses all your monthly income and every possible minute expenditure, from the big spending to the small expenses.
Add formulas to auto-calculate your residual income and spending prowess for the month. While you don’t need to create elaborate accounting trackers for yourself, you can always work with simple trackers to manage your income and monthly expenditures. If you are a fan of paper-based expense trackers, you can even use free printable expense trackers to help you stay on budget.
8. Quick Calculations

Excel has become a go-to tool for people who want to perform different calculations. Imagine you wanted to calculate your next mortgage installment, but instead of using a pen and paper to make the calculations, you could quickly create an Excel workbook and start making estimates.
Excel, as an application, is handy and quite useful for performing quick calculations since it has a variety of functional formulas to help you get going.
Use of Excel in Daily Life
Excel is a wondrous language, and you can make the most of it, especially if you master the various functionalities, formulas, and procedures. However, to ensure you are using it correctly, you need to learn it from the experts. Plenty of free and paid courses are available on some famous platforms, including Udemy and a few other platforms. You can pick and choose a course that matches your learning requirements.
What are the uses of MS Excel in daily life? And also in businesses too. Well, there are a lot. Nowadays, people are in a hurry. They need to perform various operations in their daily life. But to perform these operations, they need to do some calculations. So how can they perform calculations easily? The most effective answer to this question is the use of excel.
Excel helps individuals and businesses to perform difficult calculations in no time. MS Excel is the most famous spreadsheet software in the world. In this blog, we will discuss various uses of excel in our life. But before we get started with the uses of Excel, let’s have a look at what MS Excel is.
However, if you are looking for Excel assignment help, then don’t worry. At statanalytica.com, we provide the best Excel assignment help at an affordable price. So, don’t waste your time get the help now!
MS Excel
MS Excel is one of the major parts of the MS office suite.
It is one of the most powerful spreadsheet software in the world.
The spreadsheet contains a table with various numbers of rows and columns.
These rows and columns are used to put the values.
You can easily manipulate these values using some complex arithmetic operations with the help of excel formulas.
Apart from that, MS Excel also offers programming support, which makes it better than other spreadsheet software.
You can do the programming with excel via Microsoft Visual Basic for Applications. On the other hand, there are many excel project ideas that you can use to improve your skills.
It also has the ability to get data from external sources via Microsoft’s Dynamic Data Exchange.
Apart from that, it also offers extensive graphic support to the users.
The most common uses of MS excel are performing basic calculations, creating pivot tables, and creating macros.
Importance Of MS Excel In Our Daily Life And Business Life
Following are some importance of Excel that are related to our daily life and business lives.
1. Easy Computation Solutions
MS Excel has the ability to do several numbers of arithmetic calculations. With the help of different formulas, it can add, multiply, subtract, and divide lots of numbers simultaneously. Moreover, it can easily be re-do if the value is changed or added.
2. Options Of Formatting
Excel has various formatting options, like highlighting, italics, colors, etc., that enable businesses to show and bring out the essential data differently.
3. Availability Of Online Access
MS Excel is part of the Office 365 productivity Suite. It means businesses’ employers and employees can easily access their files over the cloud network.
4. Analysis Charts
MS Excel enables its users to create analysis charts easily. You can create Pie charts or Clustered Columns by filtering and correctly inputting data in just a few clicks. Even Excel allows you to customize the colors and boundaries of the diagrams.
5. All Data At One Place
Excel contains over 10 lakh rows and 16 thousand columns in the spreadsheet. You can also import data, add pictures and other objects through the insert tab. Excel enables you to put all the data you collected from different files in one place easily.
Now let’s move on to the uses of Excel in our daily life. Here we go:-
USES OF EXCEL: 8 Important Uses Of Microsoft Excel
1. Education
There are various uses of MS Excel in education. Even Excel is making teaching a lot easier for teachers.
The teachers use tables, shapes, charts, and other tools in excel to present the topics to the students.
Moreover, the teachers are also using formulas to teach the students about mathematical computations.
In education, the data visualization of MS excel is the key to the teachers.
Now the students can easily understand the topic because of the visualization, especially when the teachers are going to represent the stats, then they use bars and charts.
Apart from that, the use of MS Excel in schools and colleges to create timetables.
There are various pre-built templates in MS excel.
You can use these templates to create the timetable.
Besides, excel also offers formulas that are useful for multiple education purposes.
It is one of the best uses of Excel.
You can use these templates to create the timetable.
Besides, excel also offers formulas that are useful for multiple education purposes.
2. Business
Excel plays a crucial role in business. Even every business owner is using excel.
The use of excel in business varies from organization to organization.
The business can use MS Excel to perform goal setting, budgeting process, and planning, etc.
Now the business can easily manage their daily operations because of excel.
Apart from that, they are also able to predict their performance.
The excel financial formulas are doing a tremendous job for the business.
MS Excel is offering the IF formula, which is quite helpful in creating hundreds of logic in the business calculations.
MS Excel is quite handy for business operations.
All you need to do is visit the template menu to take full advantage of it.
The best part of the pre-built template is, you need not create anything from scratch.
3. Goal Setting and Planning
We all have daily goals or weekly goals.
Therefore to manage our daily tasks for the goals. We can use MS excel.
In MS Excel, all we need to do is accomplish the daily task along with the remark column.
Whenever we complete our daily tasks, we write on the remark columns that we are done with the task.
It is also helpful for planning purposes.
With the help of excel, we can calculate everything in advance as part of our planning.
4. Business Owners
The previous point highlighted the use of MS Excel for business.
But at this point, we will share with you the uses of MS Excel for business owners.
We know that business owners also need to perform various tasks from their end.
Some of these tasks are work progress, team management, and payouts details, etc.
One of the significant tasks for the business owner is to track the marketing campaign progress. However, if you have any pending marketing homework help then you can get our marketing help at a very affordable price.
Excel makes it simple and easy for business owners.
All they need to do is select the prebuilt template to start creating the sheet.
5. Housewives
It helps housewives to manage their daily expenses as well as grocery.
With the use of excel, they can create the report for weekly and monthly expenses.
It also helps them to track their expenses.
Most housewives are also helping their children to learn the basic skills of MS Excel.
In this way, the statistics students also get ready from the beginning of the academics.
Apart from that, Excel knowledge also emerges from housewives to earn a possessive income.
There are lots of part-time jobs available for housewives.
It is one of the best uses of Excel.
Also, Read
- Excel vs Quickbooks; Best Points You Need To Know
- How to Find Z Score in Excel | Best Ways to Find it Like A Pro
- A Guide On Frequency Distribution Excel For Beginners
6. Data Analysis And Data Science
Data analysis is one of the most emerging fields in the business perspective.
The business needs to perform various operations on the data.
The reason is companies are not using a single source.
They use multiple sources such as their blog, eCommerce sites, social media, offline data, and more.
All these jobs need time and energy. Sometimes it becomes overwhelming for the business to manage the data. In this case, excel plays a crucial role in the business.
Excel offers the filter function, which is quite handy for the data analyst to understand the data. Nowadays, excel is also used in the field of data science.
There are lots of functions that are helping in Big Data technologies.
The programming features of Excel with VBA make it one of the best options for data science technologies.
There are lots of operations that can be performed with the use of excel.
7. Daily Progress Report
Excel is also helpful in creating a daily progress report. Most of the companies track their daily progress with the help of excel.
Especially in project-based companies where the clients need a weekly report from the company.
For this, the company uses the daily progress report to showcase the daily work progress to the client.
Excel offers the table with the date and time.
You can also add the manual columns such as client, tasks, duration, and status as per the business requirements.
Apart from the companies, the daily progress report is also helpful in academics.
The teachers and the students can track their daily progress with the help of excel.
It is one of the best uses of Excel.
8. Career Development
When we talk about career development.
MS Excel is also playing a crucial role in this sector. Excel teaches you the most prominent skills of management.
With the help of excel, we try to calculate everything in advance.
Because in our life, we need to perform various calculations to run our daily life.
If you get good command over MS Excel, you are also eligible to get the best job in data analytics or data science.
Excel helps you in career management, time management, learning management, life management, and so on.If you are a student, then you can manage all your expenses with the help of excel.
5 Uses Of MS Excel In Businesses
At a very basic level, MS Excel is used for storing, analyzing, sorting, and reporting. However, it is extremely popular in businesses because it is fairly easy to use.
1. Business Analysis
Excel is used to do business analysis. Through this, businesses make decisions with collected data. Generally, companies gather data on a daily basis that is related to product sales, website traffic, insurance claim, etc.
2. People Management
It is one of the top uses of Excel in businesses. MS Excel is a powerful way to collect information about people. Through excel, personal information of employees, customers, supporters, etc., can be stored and recovered efficiently.
3. Managing Operations
Excel is heavily dependent on the daily operations of numerous businesses. Business activities generally involve complex logistics. Inventory flows require to be managed, so that company’s operations run smoothly. In simple words, keeping track of supplier and client transactions, listing critical dates, and managing times and schedules. It is only possible through MS Excel.
4. Report Of Performance
MS Excel can do monitoring and reporting of performance effectively. A simple way to transform data into a performance report in Excel is to build a pivot table. By creating a pivot table and linking it to data, you can get extra useful information from the dataset. If you need to analyze huge volumes of data then will probably be easier to connect this dataset with a reporting tool.
5. Office Administration
MS Excel stores and enters the administrative data. Then this data is used for accounting and financial reporting and business analysis, and performance reporting. Moreover, Excel supports office administration in daily tasks such as invoicing, paying bills, etc.
Top 5 Cool Things You Can Try Right Now Using Excel
You can’t ignore Excel’s important role in daily work because it deals with big data. However, many useful tips and tricks for beginners and advanced users are still inevitably overlooked. Here are five cool things you can try right now using Excel.
1. Play with numbers
Excel’s main function is to work with numbers. Excel makes sorting, retrieving, and analyzing a huge (or even small!) quantity of data a breeze.
When it comes to using Excel for anything numbers-related, there are a few general categories to keep in mind.
Calculation:
Do you ever find yourself repeating the same calculations? You may create a completely personalized calculator by programming your frequently used formulae in Excel. That way, all you have to do is type in your numbers, and Excel will calculate the result for you—no effort necessary. Isn’t it cool?
Charts:
The number of pie charts, line charts, scatter charts, bar charts, area charts, and column charts is endless. Excel can turn rows and columns of figures into attractive charts. And it is sure to become one of your favorite features if you need to convey data in a more visual and consumable way.
2. Making Plans
Let’s get away from the numbers for a moment —Excel can help you plan and organise a lot of things that don’t require multiple rows of figures.
Worksheet for goal setting:
Excel always helps to have something to keep you focused and on track. And it would either it’s career objectives, fitness goals, or money goals. You may use excel to build a variety of spreadsheets, logs, and planning papers to track your progress and, ideally, cross the finish line.
Schedules and calendars:
Do you need to create a content schedule for your blog or website? Are you looking for lesson plans for your classroom? Do you or your family have a daily schedule? Excel may be surprisingly powerful when it comes to multiple calendars. Try this today to schedule your work.
3. Involving Others
Do you need to get information from others? One method is to use survey tools and forms. But, don’t worry, you can make them all in your own Excel.
Quizzes:
Are you trying to assess someone else’s — or even your own — for the understanding of a topic? You may create a bank of questions and answers in one worksheet and then have Excel quiz you in another.
Forms:
Excel is an excellent tool for designing forms. And it starts from basic to complex. You may even create numerous drop-down menus so that users can choose from a predefined list of options.
4. Getting things done
Do you want to increase your productivity? Excel can easily come to your rescue with various functions that can help you manage your tasks and to-dos with simplicity.
Timesheets:
You already know that keeping track of your time may help you be more productive. There are many attractive applications and tools to help you in meeting these demands. Consider Excel as the actual time-tracking tool. It continues to be a possible alternative to time sheets today.
Checklist:
Similarly, you may make a basic checklist to cross off the items you’ve bought or completed. And it can be related to a shopping list to a list of to-dos for planned marketing tasks.
5. Excel just for fun.
With the help of excel, you can do a variety of other interesting things for fun.
Cloud of words:
Word clouds are not the most scientific way to describe facts. However, they are a fun (not to mention attractive) method to determine which words are used the most. You guessed it—Excel can be used to make one.
Logbooks from the past:
Whether you want to keep track of the different tasks you have completed, the exercises you have done, or something else completely, Excel is what you have for sorting and logging those things.
3 Powerful Excel Functions That Make Work
The following are the most useful functions that we can use in our daily life.
1. The SUM Function
This function is the most used function when it comes to computing data on Excel. This function is used to sum a group of numbers in a specific set of cells.
It means you do not need to type a long cumbrous formula to calculate the sum of the data.
The SUM function is performed by typing the formula on the function bar, highlighting the cells you want to add, and pressing “ENTER”.
- The Syntax formula for SUM function is “=SUM(Cell numbers)”.
- You can also use the Σ symbol to add the data you need.
- Moreover, “ALT+” also helps to add the numbers.
2. The TEXT Function
The TEXT function is a useful tool that helps in converting the date or numbers into a text string in a particular format. Keep in mind the text formula only works to convert numeric values to text.
The TEXT function’ formula is =”Text” (Value, format_text).
Value refers to the particular number you want to convert to text.
Format_text refers to the format of the conversion.
3. The AVERAGE Function
The AVERAGE function is used for getting the average of the data. As the function of SUM, it is commonly used in computing and analyzing the data on the spreadsheet.
The syntax formula for the AVERAGE function is “=AVERAGE(Cell number).
Some Of The Documents That You Can Create in Excel
Microsoft Excel is a versatile software that allows users to create various documents. Here is the list of some of the documents that you can create in excel, which are as follows:
1. Spreadsheets
Excel is primarily used for creating spreadsheets, which are documents that organize and analyze data in rows and columns. Spreadsheets can be used for budgeting, financial analysis, inventory management, and more.
2. Charts and graphs
Excel allows users to create charts and graphs to visualize data, such as bar charts, line charts, pie charts, and scatter plots.
3. Calendars
Excel can create calendars for scheduling appointments, meetings, or events.
4. Invoices
Excel can create invoices with item descriptions, prices, taxes, and totals.
5. Budgets
Excel is useful for creating personal or business budgets, where users can track their expenses and income.
6. Forms
Excel can be used to create forms for data collection, such as surveys or questionnaires.
7. Project plans
Excel can create project plans, including timelines, budgets, and resource allocation.
8. Gantt charts
Excel allows users to create Gantt charts and visual representations of project schedules that help track progress and identify potential issues.
9. Data entry forms
Excel can create forms that make it easier to input and organize data.
10. Contact lists
Excel can create lists that include names, addresses, phone numbers, and other relevant information.
Well, these are some of the documents you can try and make in excel.
Conclusion
The more you learn, the more you can earn with excel. The same philosophy applies to MS excel.
If you develop your excel skills to the peak level, you are eligible to get reputed jobs in analytics.
As we have seen, there are lots of uses for excel. But here, we have mentioned a few.
There are many more uses to excel in the world. Excel makes life easier for us.
Now we can perform a complete calculation without having a strong command of math and statistics.
All this becomes possible only because of MS excel. So don’t be the one who is not aware of MS excel.
Start learning excel today from the experts.
Also, get the best excel assignment help from MS excel experts at nominal charges.
FAQs
Q1. What is Excel used for?
Excel is generally used to manage data and perform financial analysis. On the other hand, it is used in every business and company of all sizes. The main uses of Excel include:
1. Customer relationship management (CRM)
2. Time management
3. Task management
4. Data entry
5. Data management
6. Financial modeling
7. Accounting
8. Financial analysis
9. Charting and graphing
10. Programming
11. You can do almost anything that needs to be organized!
Q2. What are the benefits of MS Excel in your life as a student?
The benefits of Excel in student’s lives are as follows:
1. The Best way to store data.
2. Able to perform calculations
3. Every tool for data analysis
4. Print report easily
5. Transform and clear data
Q3. What are the three most common uses for Excel?
The three most common uses for MS Excel are creating budgets, producing graphs and charts, and storing and sorting the data.
What are the uses of Microsoft Excel in the workplace? The list of ways that businesses use the spreadsheet program is long. But we’ve broken it down to a top 10 list after analyzing data on 800 job ads (using Excel by the way).
The most common business uses of MS Excel are business analysis, managing lists of people, operations management, and performance reporting. The software is also handy for office administration, project management, and managing programs, contracts and accounts.
At a basic level, Excel is using for storing information, analysing and sorting, and reporting. The platform is popular in business because an Excel spreadsheet is highly visual and fairly ease to use.
1. Business Analysis
The number 1 use of Microsoft Excel in the workplace is to improve business performance through analysis. This is essentially using collected data to inform decision making.
Businesses naturally gather data in their day-to-day activities, which may be data on product sales, website traffic, spending on supplies, insurance claims, etc. Analysis is the activity of converting data into something useful to the people who run the business.
For example, you could run a profitability report by day of the week. If the business always loses money on a Sunday, that information management could be used to make a decision to not open on Sundays.
Job examples: business analyst, business planning analyst, business solutions analyst, claims analyst, collections analyst, credit officer, data analyst, data and audience analyst, finance business analyst, investment operations portfolio analyst, junior data analyst, regional finance analyst, senior data analyst, senior finance analyst, senior portfolio analyst.
2. People Management
You may be surprised to learn that one of the top uses of Microsoft Excel in business is to manage people. An Excel spreadsheet is a powerful way to organise information about people, whether they are employees, customers, supporters, or training attendees.
Using Excel, information about an individual person can be stored and retrieved efficiently. A spreadsheet row or column can be used for an individual record that may include information like name, email address, start date, items purchased, subscription status, and last contact.
Job examples: client growth coordinator, client management and administration, client relationship manager, client service manager, client service specialist, employer service consultant, HR administrator, human resources administrative assistant, human resources administrator, human resources adviser, human resources officer, junior HR analyst, reconciliation and payments officer, relationship manager.
3. Managing Operations
Excel is relied on heavily to manage the day-to-day operations of many businesses.
While Amazon uses sophisticated custom software for operations management, Microsoft Excel is an important tool for many smaller businesses (or parts of larger businesses). An advantage of Excel is that it’s relatively low tech, allowing it to be used by many people and without the risk of programming bugs.
Business activities can often involve quite complicated logistics. Inventory flows need to be controlled so that you can keep operations running smoothly – and without overstocking on particular items. That means keeping track of supplier and client transactions, listing critical dates, and managing times and schedules.
Job examples: business operations analyst, data operations manager, graduate program – supply chain and operations, in market supply chain analyst, operational business analyst, operational enablement associate, operational knowledge management specialist, supply chain associate, supply chain specialist.
4. Performance Reporting
Performance monitoring and reporting is a specialised type of company analysis that can be done effectively using Microsoft Excel. For example, many accountants still use Excel (partly because it’s compatible with cloud-based accounting software).
A common way to convert data into a performance report in Excel is to create a pivot table. By inserting a pivot table and linking it to data, you can extra useful information from the dataset quickly. Pivot tables have numerous in-built functions that allow for tasks such as counting and summing certain types of data within the dataset.
Job examples: financial accountant, forecast analyst / sales support, performance analyst, performance analyst – procurement, professional services operations analyst, reporting analyst, reporting development analyst, sales coordinator, sales operations analyst.
5. Office Administration
Underlining the importance of Microsoft Excel, office administrators use Excel to enter and store key administrative data. The same data may be subsequently used for accounting and financial reporting, as well as operations analysis and performance reporting.
Apart from recordkeeping, Excel is useful in office administration for supporting day-to-day tasks such as invoicing, paying bills, and contacting suppliers and clients. It’s an all-purpose tool for keeping track of and managing office activities.
Job examples: administration assistant, administration officer, administration supervisor, administrative assistant, business operations and office manager, junior clerical and administrative officer, office admin manager, office support – maintenance / general duties.
6. Strategic Analysis
With respect to uses of Excel, strategic analysis is where business decisions are closely connected to the data and formulas on spreadsheets. You apply Excel to guide actions such as investments and asset allocations.
As an example, based on an Excel model, you may decide to take out currency insurance. Spreadsheet analysis is designed to inform business decisions in a specific way.
Job examples: asset manager – realty management division, mergers and acquisitions valuations – analyst, membership and campaigns strategist, portfolio administration associate, portfolio analyst, portfolio associate – wealth management, portfolio management officer – asset finance.
7. Project Management
Although project managers have access to purpose-built project management (PM) software, an Excel workbook is often an effective alternative.
Projects are business activities that typically have a budget and start and end dates. Project plans can be placed into a workbook, which can then be used to track progress and keep the project on schedule. In an Excel sheet, you can create a Gantt chart to map out tasks in terms of durations and key dates.
An advantage of using Excel is that you can easily share the project workbook to others, including to people who are unfamiliar with, or lack access to, custom PM software.
Job examples: project analyst, project assistant / officer (IT), project business analyst.
8. Managing Programs
Microsoft Excel is a good platform for managing programs. It can be adapted to handle the specific characteristics of a given program. And, because MS Excel is widely known, program records can easily be managed by multiple people and, when the time comes, handed over to a new manager.
A program is like a project, but may be ongoing and can depend on participation by users. Excel helps managers allocate resources, keep track of progress, and maintain participant records. Pivot tables are useful here because you can quickly create a pivot table to summarize large amounts of data in a simple cross-tabular format.
Job examples: event coordinator, learning and development officer, learning and development coordinator, manager – internships, programs and office coordinator, records and results coordinator, training administrator.
9. Contract Administration
Contract administrators like to use Microsoft Excel because it provides a no-fuss means of recording contract details, including dates, milestones, deliverables and payments.
Many different contract management templates are available, and these can be adapted to suit the particular contract type or stage of the contract lifecycle.
Job examples: building contract administrator, contracts administrator, estimator / contracts administrator, graduate contracts administrator, lease administrator, quote and tender administrator.
10. Account Management
Account managers are generally required to be competent Excel workbook users since they receive and need to maintain customer records. Excel is commonly used in account management since it provides a simple way to share and maintain client files.
The job of an account manager is to nurture relationships with existing clients of the business. Key goals are to achieve customer loyalty and repeat sales. It’s a marketing kind of role and a popular career for MBA graduates.
Job examples: account coordinator, advertising manager, design studio account manager, digital account manager, junior account manager.
Why You Need Excel Skills in Business
If this list hasn’t convinced you already, Excel spreadsheet skills are very useful in the workplace. Your skills can also be easily adapted to other spreadsheets programs such as Google Sheets.
Not all jobs use Excel and those that do are often considered ‘middle skill‘ jobs. However, Excel is widely used. Having good spreadsheet skills gives you the ability to work on all sorts of different tasks. And you can more easily get value out of information that’s being shared in workbooks.
Once you know how to use Excel, you’ll find yourself using it more and more. You can also quickly expand from doing basic tasks such as sorting lists through to writing formulas and creating nice-looking charts and pivot tables. It’s an accessible platform that can be used to do both simple and highly sophisticated business tasks.
One of the FASTEST ways to Learn Excel is to learn some of the Excel TIPS and TRICKS, period and if you learn a single Excel tip a day you can learn 30 new things in a month.
But you must have a list that you can refer to every day instead of searching here and there. Well, I’m super PROUD to say that this is the most comprehensive list with all the basic and advanced tips that you can find on the INTERNET.
In this LIST, I have covered 300+ Excel TIPS and TRICKS which you can learn to Level Up your Excel Skills.
1. Add Serial Numbers
If you work with large data then it’s better to add a serial number column to it. For me, the best way to do this is to apply the table (Control + T) to the data and then add 1 in the above serial number, just like below.

To do this, you simply need to add 1 to the first cell of the column and then create a formula to add 1 to the above cell’s value. As you are using a table, whenever you create a new entry in the table, Excel will automatically drop down the formula and you will get the serial number.
2. Insert Current Date and Time
The best way to insert the current date and time is to use the NOW function which takes the date and time from the system and returns it.

The only problem with this function is it’s volatile, and whenever you recalculate something it updates its value. And if you don’t want to do this, the best way is to convert it to hard value. You can also use the below VBA code.
Sub timestamp()
Dim ts As Date
With Selection
.Value = Now
.NumberFormat = "m/d/yyyy h:mm:ss AM/PM"
End With
End Sub
Or these methods to insert a timestamp in a cell.
3. Select Non-Continues Cells
Normally we all do it this way, hold the control key, and select cells one by one. But I have found that there is a far better way for this. All you have to do is, select the first cell and then press SHIFT + F8.
This gives you add or remove selection mode in which you can select cells just by selecting them.
4. Sort Buttons
If you deal with data that needs to sort frequently then it’s better to add a button to the quick access toolbar (if it’s not there already).

All you need to do is click on the down arrow on the quick access toolbar and then select “Sort Ascending” and “Sort Descending”. It adds both buttons to the QAT.
5. Move Data
I’m sure you think about copy-paste but you can also use drag-drop for this.
Simply select the range where you have data and then click on the border of the selection. By holding it move to the place where you need to put it.
6. Status Bar
The status bar is always there but we hardly use it to the full. If you right-click on it, you can see there are a lot of options you can add.
7. Clipboard
There is a problem with normal copy-paste that you can only use a single value at a time.
But here is the kicker: When you copy a value, it goes to the clipboard and if you open the clipboard you can paste all the values which you have copied. To open a clipboard, click on the go to Home Tab ➜ Editing and then click on the down arrow.

It will open the clipboard on the left side, and you can paste values from there.

8. Bullet Points
The easiest way to insert bullet points in Excel is by using custom formatting and here are the steps for this:
- Press Ctrl + 1 and you will get the “Format Cell” dialogue box.
- Under the number tab, select custom.
- In the input bar, enter the following formatting.
- ● General;● General;● General;● General
- In the end, click OK.

Now, whenever you enter a value in the cell Excel will add a bullet before that.
9. Worksheet Copy
To create a copy of a worksheet in the same workbook drag and drop in the best way.
You just need to click and hold the mouse on the sheet’s name tab and then drag and drop it, to the left or right, where you want to create a copy.
10. Undo-Redo
Just like sort buttons you can also add undo and redo buttons to the QAT. The best part about those buttons is you can use them to undo a particular activity without pressing the shortcut key again and again.

More Basic Tips: Delta Symbol | Degree Symbol | Formula to Value | Concatenate a Range of Cells | Insert a Check Mark Symbol in Excel | Convert Negative Number into Positive | Highlight Blank Cells in Excel
11. AutoFormat
If you deal with financial data, then auto format can be one of your best tools. It simply applies the format to small as well as large data sets (especially when data is in tabular form).

- First of all, you need to add it to the quick access toolbar (here are the steps).
- After that, whenever you need to apply the format, just select the data where you want to apply it and click on the AUTO FORMAT button from the quick access toolbar.
- It will show you a window to select the formatting type and after selecting that click OK.
The AUTOFORMAT is a combination of six different formattings and you have the option to disable any of them while applying it.
12. Format Painter
The simple idea with the format painter is to copy and paste formatting from one section to another. Let’s say you have specific formatting (Font Style and Color, Background Color to a Cell, Bold, Border, etc.) in the range B2:D7, and with format painter, you can copy that formatting to range B9: D14 with a click.
- First of all, select the range B2:D7.
- After that, go to the Home Tab ➜ Clipboard and then click on “Format Painter”.
- Now, select cell C1 and it will automatically apply the formatting on B9: D14.
The format painter is fast and makes it easy to apply to format from one section to another.
Related: Format Painter Shortcut
13. Cell Message
Let’s say you need to add a specific message to a cell, like “Don’t delete the value”, “enter your name” or something like that.
In this case, you can add a cell message for that particular cell. When the user will select that cell, it will show the message you have specified. Here are the steps to do this:

- First, select the cell to which you want to add a message.
- After that, go to the Data Tab ➜ Data Tools ➜ Data Validation ➜ Data Validation.
- In the data validation window, go to the Input Message tab.
- Enter the title, and message, and make sure to tick mark “Show input message when the cell is selected”.
- In the end, click OK.

Once the message is shown you can drag and drop it to change its position.
14. Strikethrough
Unlike Word, in Excel, there is no option on the ribbon to apply strikethrough. But I have figured out that there are 5 ways to do it and the easiest of all of them is a keyboard shortcut.
All you need to do is select the cell where you want to apply the strikethrough and use the below keyboard shortcut.
Ctrl + 5
And if you are using MAC then:
⌘ + ⇧ + X
Quick Note: You can use the same shortcut keys if you need to do this for partial text.
15. Add Barcode
It is one of those secret tips that most Excel users are unaware of. To create a bar-code in Excel all you need to do is install this bar-code font from ID-AUTOMATIC.
Once you install this font, you will have to type the number in a cell for which you want to create a bar code and then apply the font style.

learn more about this tip
16. Month Name
Alright, let’s say you have a date in a cell, and you want that date to show as a month or a year. For this, you can apply custom formatting.

- First, select the cell with a date and open formatting options (use Ctrl + 1).
- Select the “Custom” option and add “MMM” or “MMMMMM” for the month or “YYYY” for the year format.
- In the end, click OK.
Custom formatting just changes the formatting of the cell from date to year/month, but the value remains the same.
17. Highlight Blank Cells
When you work with large data sheets it’s hard to identify the blank cells. So, the best way is to highlight them by applying a cell color.
- First, select all the data from the worksheet using the shortcut key Ctrl + A.

- After that, go to Home Tab ➜ Editing ➜ Find & Select ➜ Go to Special.

- From Go to Special dialog box, select Blank and click OK.

- At this point, you have all the blank cells selected and now apply a cell color using font settings.

…but you can also use conditional formatting for this
18. Font Color with Custom Formatting
In Excel, we can apply custom formatting and in custom formatting, there is an option to use font colors (limited but useful).
For example, if you want to use the Green color for positive numbers and the red color for negative numbers then you need to use the custom format.
[Green]#,###;[Red]-#,###;0;

- First, select the cells where you want to apply this format.
- After that open the format option using the keyboard shortcut Ctrl + 1 and go to the “Custom” category and the custom format in the input dialogue box.
- In the end, click OK.
19. Theme Color
We all have some favorite fonts and colors which we use in Excel. Let’s say you received a file from your colleague and now you want to change the font and colors for the worksheet from that file. The point is, you need to do this one by one for each worksheet and that takes time.
But if you create a custom theme with your favorite colors and fonts then you can change the style of the worksheet with a single click. For this, all you have to do is apply your favorite designs to the tables, colors to the shapes and charts, and font style, and then save it as a custom theme.

- Go to the Page Layout Tab ➜ Themes ➜ Save Current Theme. It opens a “Save As” dialogue box, names your theme, and saves it.
- And now, every time you need just one click to change any worksheet style to your custom style.
20. Clear Formatting
This is a simple keyboard shortcut that you can use to clear formatting from a cell or range of cells.
Alt ➜ H ➜ E ➜ F
Or, otherwise, you can also use the clear formatting option from the Home Tab (Home Tab ➜ Editing ➜ Clear ➜ Formats).

21. Sentence Case
In Excel, we have three different functions (LOWER, UPPER, and PROPER) to convert text into different cases. But there is no option to convert a text into a sentence case. Here is the formula which you can use:
=UPPER(LEFT(A1,1))&LOWER(RIGHT(A1,LEN(A1)-1))

This formula converts the first letter of a sentence into capital and the rest all in small (learn how this formula works).
22. Random Numbers
In Excel, there are two specific functions that you can use to generate random numbers. First is RAND which generates random numbers between 0 and 1.

And second is RANDBETWEEN which generates random numbers within the range of two specific numbers.

ALERT: These functions are volatile so whenever you re-calculate your worksheet or hit enter, they update their values so make sure to use them with caution. You can also use RANDBETWEEN to generate random letters and random dates.
23. Count Words
In Excel, there is no specific function to count words. You can count characters with LEN but not words. But, you can use the following formula which can help you to count words from a cell.
=LEN(A1)-LEN(SUBSTITUTE(A1,” “,”))+1

This formula counts the number of spaces from a cell and adds 1 to it after that which equals the total number of words in a cell.
24. Calculate the Age
The best way to calculate a person’s age is by using the DATEDIF. This mysterious function is specifically made to get the difference between a date range.
And the formula will be:
=”Your age is “& DATEDIF(Date-of-Birth,Today(),”y”) &” Year(s), “& DATEDIF(Date-of-Birth,TODAY(),”ym”)& ” MONTH(s) & “& DATEDIF(Date-of-Birth,TODAY(),”md”)& ” Day(s).”
25. Calculate the Ratio
I have figured out that there are four different ways to calculate the ratio in Excel but using a simple divide method is the easiest one. All you need to do is divide the larger number into the smaller ones and concatenate it with a colon and one and here’s the formula you need to use:
=Larger-Number/Smaller-Number&”:”&”1″

This formula divides the larger number by the smaller one so that you can take the smaller number as a base (1).
26. Root of Number
To calculate the square root, cube root, or any root of a number the best way is to use the exponent formula. In the exponent formula, you can specify the Nth number for which you want to calculate the root.
=number^(1/n)
For example, if you want to calculate a square root of 625 then the formula will be:
=625^(1/2)

28. Month’s Last Date
To simply get the last date of a month you can use the following dynamic formula.
=DATE(YEAR(TODAY()),MONTH(TODAY())+1,0)

29. Reverse VLOOKUP
As we all know there is no way to look up to left for a value using VLOOKUP. But if you switch to INDEX MATCH you can look up in any direction.

30. SUMPRODUCT IF
You can use the below formula to create a conditional SUMPRODUCT and product values using a condition.
=SUMPRODUCT(–(C7:C19=C2),E7:E19,F7:F19)
31. Smooth Line
If you love to use a line chart, then you are awesome but it would be more awesome if you use a smooth line in the chart. This will give a smart look to your chart.
- Select the data line in your chart and right-click on it.
- Select “Format Data Series”.
- Go to Fill & Line ➜ Line ➜ Tick mark “Smoothed Line”.

33. Hide Axis Labels
This charting tip is simple but still quite functional. If you don’t want to show axis label values in your chart you can delete them. But the better way is to hide them instead of deleting them. Here are the steps:
- Select the Horizontal/Vertical axis in the chart.
- Go to “Format Axis” Labels.
- In the label position, select “None”.

And again, if you want to show it then just select “Next to axis”.
34. Display Units
If you are dealing with large numbers in your chart, you can change the units for axis values.

- Select the chart axis of your chart and open the format “Format Axis” options.
- In axis options, go to “Display Units” where you can select a unit for your axis values.
35. Round Corner
I often use Excel charts with rounded corners and if you like to use round corners too, here are the simple steps.
- Select your chart and open formatting options.
- Go to Fill and Line ➜ Borders.
- In borders sections, tick mark rounded corners.
36. Hide Gap
Let’s say you have a chart with monthly sales in which June has no amount and the cell is empty. You can use the following options for that empty cell.

- Show the gap for the empty cell.
- Use zero.
- Connect data points with the line.
Here are the steps to use these options.
- Right, click on your chart & select “Select Data”.
- In the select data window, click on “Hidden and Empty Cell”.
- Select your desired option from “Show Empty Cell as”.

Make sure to use “Connect data points with the line” (recommended).
38. Chart Template
Let’s say you have a favorite chart formatting you want to apply every time you create a new chart. You can create a chart template to use anytime in the future and the steps are as follow.
- Once you have done with your favorite formatting, right-click on it & select “Save As Template”.

- Using the save as dialog box, save it in the template folder.
- To insert a new one with your favorite template, select it from templates in the insert chart dialog.

39. Default Chart
You can use a shortcut key to insert a chart, but the problem is, it will only insert the default chart, and in Excel, the default chart type is “Column Chart”. So if your favorite chart is a line chart, then the shortcut is useless for you. But let’s conquer this problem. Here are the steps to fix this:
- Go to Insert Tab ➜ Charts.
- Click on the arrow at the bottom right corner.
- Then in your insert chart window, go to “All Charts” and then select the chart category.
- Right, click on the chart style you want to make your default Select “Set as Default Chart”.
- Click OK.

40. Hidden Cells
When you hide a cell from the data range of a chart, it will hide that data point from the chart as well. To fix this, just follow these steps.

- Select your chart and right-click on it.
- Go to ➜ Select Data ➜ Hidden and empty cells.
- From the pop-up window, tick the mark “Show data in hidden rows and columns”.
41. Print Titles
Let’s say you have headings on your table, and you want to print those headings on every page you print. In this case, you can fix “Print Titles” to print those headings on each page.
- Go to “Page Layout Tab” ➜ Page Set Up ➜ Click on Print Titles.
- Now in the page setup window go to the sheet tab and specify the following things.

- Print Area: Select the entire data which you want to print.
- Rows to repeat at the top: Heading row(s) which you want to repeat on every page.
- Columns to repeat at the left: Column(s) which you want to repeat at the left side of every page (if any).

42. Page Order
Specifying the page order is quite useful when you want to print large data.
- Go to File Tab ➜ Print ➜ Print Setup ➜ Sheets Tab.
- Now here, you have two options:
- The First Option: To print your pages using a vertical order.
- The Second Option: To print your pages using a horizontal order.

If you add comments to your reports then you can print them as well. At the end of all printed pages, you can get a list of all the comments.
- Go to File Tab ➜ Print ➜ Print Setup ➜ Sheets Tab.
- In the print section, select “At the end of the sheet” using the comment dropdown.
- Click OK.
44. Scale to Fit
Sometimes we struggle to print entire data on a single page. In this situation, you can use the “Scale to Fit” option to adjust the entire data into a single page.
- Go to File Tab ➜ Print ➜ Print Setup ➜ Page Tab.
- Next, you need to adjust two options:
- Adjust % of normal size.
- Specify the number of pages in which you want to adjust your entire data using width and length.

Instead of using the page number in the header and footer, you can also use a custom header and footer.
- Go to File Tab ➜ Print ➜ Print Setup ➜ Header/Footer.
- Click on the custom header or footer button.

- Here you can select the alignment of the header/footer.

- And the following options can be used:
- Page Number
- Page Number with total pages.
- Date
- Time
- File Path
- File Name
- Sheet Name
- Image
46. Center on Page
Imagine you have less data to print on a page. In this case, you can align it at the center of the page while printing.
- Go to File Tab ➜ Print ➜ Print Setup ➜ Margins.
- In “Center on Page” you have two options to select.
- Horizontally: Aligns data to the center of the page.
- Vertically: Aligns data to the middle of the page.
Before printing a page make sure to see the changes in the print preview.
47. Print Area
The simple way to print a range is to select that range and use the option “print selection”. But what if you need to print that range frequently, in that case, you can specify the printing area and print it without selecting it every time.

Go to the Page Layout Tab, click on the Print Area drop-down, and after that, click on the Set Print Area option.
48. Custom Margin
- Go to File Tab ➜ Print.
- Once you click on print, you’ll get an instant print preview.
- Now from the bottom right side of the window, click on the “Show Margins” button.

It will show all the margins applied and you can change them just by dragging and dropping.
49. Error Values
You can replace all the error values while printing with a specific value (three other values to use as a replacement).
- Go to File Tab ➜ Print ➜ Print Setup ➜ Sheet.
- Select the replacement value from the “Cell error as” dropdown.
- You have three options to use as a replacement.
- Blank
- Double minus sign.
- “#N/A” error for all the errors.

- After selecting the replacement value, click OK.
I believe using a “Double minus sign” is the best way to present errors in a report while printing it on a page.
Related: Ignore All the Errors
50. Custom Start Page Number
If you want to start the page number from a custom number let’s say 5. You can specify that number and the rest of the pages will follow that sequence.
- Go to File Tab ➜ Print ➜ Print Setup ➜ Page.
- In the input box “First page Number”, enter the number from where you want to start the page number.
- In the end, click OK.
This option will only work if you have applied the header/footer in your worksheet.
51. Tracking Important Cells
Sometimes we need to track some important cells in a workbook and for this, the best way is to use the watch window. In the watch window, you add those important cells and then get some specific information about them in one place (without navigating to each cell).
- First, go to Formula Tab ➜ Formula Auditing ➜ Watch Window.

- Now in the “Watch Window” dialog box, click on “Add Watch”.

- After that select the cell or range of cells that you want to add and click OK.
Once you hit OK, you’ll get some specific information about the cell(s) in the watch window.
52. Flash Fill
Flash fill is one of my favorite options to use in Excel. It’s like a copycat, perform the task which you have performed. Let me give you an example.
Here are the steps to use it: You have dates in the range A1: A10 and now, you want to get the month from the dates in the B column.
All you need to do is to type the month of the first date in cell B1 and then come down to cell B2 and press the shortcut key CTRL + E. Once you do this it will extract the month from the rest of the dates, just like below.
53. Combine Worksheets
I’m sure somewhere in the past you have received a file from your colleague where you have 12 different worksheets for 12 months of data. In this case, the best solution is to combine all of those worksheets using the “Consolidate” option, and here are the steps for this.
- First, add a new worksheet and then go to Data Tab ➜ Data Tools ➜ Consolidate.

- Now in the “Consolidate” window, click on the upper arrow to add the range from the first worksheet and then click on the “Add” button.
- Next, you need to add references from all the worksheets using the above step.

- In the end, click OK.
54. Protect a Workbook
Adding a password to a workbook is quite simple, here are the steps.
- While saving a file when you open a “Save As” dialog box go to Tools General Options.

- Add a password to “Password to Open” and click OK.

- Re-enter the password and click OK again.
- In the end, save the file.
Now, whenever you re-open this file it will ask you to enter the password to open it.
55. Live Image
In Excel, using a live image of a table can help you resize it according to space, and to create a live image there are two different ways in which you can use it.
One is camera tools and the second is the paste special option. Here are the steps to use the camera tool and for paste special use the below steps.
- Select the range you want to paste as an image and copy it.
- Go to the cell and right-click, where you want to paste it.
- Go to Paste Special ➜ Other Paste ➜ Options Linked Picture.

56. Userform
A few of the Excel users know that there is a default data entry form is there which we can use. And the best part is there is no need to write a single line of code for this.

Here’s how to use it:
- First of all, make sure you have a table with headings where you want to enter the data.
- After that select any of the cells from that table and use the shortcut key Alt + D + O + O to open the user form.
57. Custom Tab
We all have some favorite options or some options which we use frequently. To access all those options in one place you create a tab and add them to it.

- First, go to File Tab ➜ Options ➜ Customize Ribbon.
- Now click on “New Tab” (this will add a new tab).
- After that right-click on it and name it and then name the group.
- Finally, we need to add options to the tab and for this go to “Choose Commands From” and add them to the tab one by one.
- In the end, click OK.
59. Text to Speech
This is an option where you can make Excel speak the text you have entered into a cell or a range of cells.
60. Named Range
To create a named range the easiest method is to select the range and create it using the “Create from Selection” option. Here are the steps to do this:
- Select the column/row for which you want to create a named range.
- Right-click and click on “Define name…”.

- Select the option to add the name for the named range and click OK.

That’s it.
61. Trim
TRIM can help you to remove extra spaces from a text string. Just refer to the cell from where you want to remove the spaces and it will return the trimmed value in the result.

62. Remove Duplicates
One of the most common things we face while working with large data is “Duplicate Values”. In Excel, removing these duplicate values is quite simple. Here’s how to do this.

- First, select any of the cells from the data or select the entire data.
- After that, go to Data ➜ Data Tools ➜ Remove Duplicates.
- At this point, you have the “Remove Duplicates” window, and from this window, select/de-select the columns which you want to consider/not consider while removing duplicate values.
- In the end, click OK.
Once you click OK, Excel will remove all the rows from the selected data where values are duplicates and show a message with the number of values removed and unique values left.

64. Remove Specific Character
In the range, A1: A5 and you want to concatenate all of them in a single cell. Here’s how to do this with fill justify.

- All you need to do is select that column and open the find and replace dialog box.
- After that click on the “Replace” tab.
- Now here, in “Find What” enter the character you want to replace and make sure to leave “Replace with” blank.
- Now click on “Replace All”.
The moment you click on “Replace All” Excel will remove that particular character from the entire column.
Related: Remove First Character from a Cell in Excel
65. Combine Text
So, you have text in multiple cells, and you want to combine all the text into one cell. No, this time not with fill justify. We are doing it with TEXT JOIN. If you use Office 365, there is a new function TEXTJOIN which is a game-changer when it comes to the concatenation of text.

Here’s the syntax:
TEXTJOIN(delimiter, ignore_empty, text1, [text2], …)
All you need to do is to add a delimiter (if any), and TRUE if you want to ignore empty cells, and in the end, refer to the range.
66. Unpivot Data
Look at the below table, you can use it as a report but you can’t use it further as raw data. No, you can’t. But if you convert this table to something like the one below you can use it easily anywhere.

But if you convert this table into something like the one below you can use it easily anywhere. So how to do this?
here are the simple steps you need to follow.
67. Delete Error Cells
Mostly while working with large data it is obvious to have error values but it’s not good to keep them. The easiest way to deal with these error values is to select them and delete them and these are the simple steps.
- First of all, go to Home Tab ➜ Editing ➜ Find & Replace ➜ Go To Special.
- In the Go To dialog box, select formula, and tick mark errors.

- In the end, click OK.
Once you click OK it will select all the errors and then you can simply delete all by using the “Delete” button.
68. Arrange Columns
Let’s say you want to arrange columns from the data using custom order. The normal way is to cut and paste them one by one.
But we also have an out-of-the-box way. In Excel, you can sort columns just like you sort rows and by using the same methods you can arrange them in a custom order.

⇢ Complete Tip
69. Convert to Date
Sometimes you have dates that are stored as text and you can use them in a calculation and further analysis. To simply convert them back to valid dates you can use the DATEVALUE function.

Other ways to convert text to date
71. Format Painter
Before I started to use format painter for applying cell formatting, I was using paste special with the shortcut key.
- Select the cell or a range from where you want to copy cell formatting.
- Go to ➜ the Home Tab ➜ Clipboard.
- Make double-click on the “Format Painter” button.
- As soon as you do this, your cursor will convert into a paintbrush.
- You can apply that formatting anywhere in your worksheet, in another worksheet, or, even in another workbook.
72. Rename a Worksheet
I always found it quicker than using a shortcut key to change the name of a worksheet. All you have to do is just double-click on the sheet tab and enter a new name.
Let me tell you why this method is faster than using a shortcut. Suppose if want to rename more than one worksheet using a shortcut key.
Before you change the name of a worksheet, you need to activate it. But if you use the mouse it will automatically activate that worksheet and edit the name with only two clicks.
73. Fill Handle
I am sure shortcut addicts always use a shortcut key to drag formulas and values in downward cells. But using a fill handle is more impressive than using a shortcut key.
- Select the cell in which you have a formula or a value that you want to drag.
- Make a double click on the small square box at the right bottom of the cell selection border.
This method only works if you have values in the corresponding column and it works only in the vertical direction.
74. Hide Ribbon
If you want to work in a distraction-free mode, you can do this by collapsing your Excel ribbon.
Just make double-click on the active tab in your ribbon and it will collapse the ribbon. And if you want to expand it back just double-click on it again.
75. Edit a Shape
You often use shapes in our worksheets to present some messages and you have to insert some text into those shapes. Besides the typical method, you can use a double click to edit a shape and insert the text into it.
You can also use this method to edit and enter text in a text box or into a chart title.
76. Column Width
Whenever you have to adjust the column width you can double-click on the right edge of the column header. It auto-sets the column width according to the column data.
The same method can be used to auto-adjust row width.
77. Go to the Last Cell
This trick can be useful if you are working with a large dataset. By using a double click, you can go to the last cell in the range which has data.
You have to click on the right edge of the active cell to go to the right side and on the left edge if you want to go to the left side.
78. Chart Formatting
If you use Control + 1 to open formatting options to format a chart, then I bet you’ll love this trick. All you have to do is just make double-click on the border of the graph to open the formatting option.
79. Pivot Table Double Click
Let’s say someone sent you a pivot table without the source data. As you already know Excel stores data in a pivot cache before creating a pivot table.
You can extract data from a pivot table by double-clicking on data values. As soon as you do this Excel will insert a new worksheet with the data which has been used in the pivot table.
There is a right-click drop-down menu in Excel that few users know about. To use this menu all you need to do is select a cell or a range of the cell and then right-click and while holding it, drop the selection to somewhere else.
81. Default File Saving Location
Normally while working on Excel I create more than 15 Excel files every day. And, if I save each of these files to my desktop it looks nasty. To solve this problem, I have changed my default folder for saving a workbook, and here’s you can do this.
- First, go to the File tab and open Excel options.
- In Excel options, go to the “Save” category.
- Now, there is an input bar where you can change the default local file location.
- From this input bar, change the location address and in the end, click OK.

From now onward, when you open the “Save As” dialog box Excel will show you the location you have specified.
82. Disable Start Screen
I’m sure just like me you hate when you open Microsoft Excel (or any other Office app) and you see the start pop-up screen. It takes time depending on your system’s speed and the add-ins you have installed. Here are the steps to disable the start-up screen in Microsoft Office.

- First, go to the File tab and open Excel options.
- In Excel options, go to the “General” category.
- From the option, drill down to the “Start-Up” options and un-tick the “Show the Start screen when this application starts”.
- In the end, click OK.
From now onward, whenever you start Excel it will directly open the workbook without showing the start-up screen.
83. Developer Tab
Before you start writing VBA codes the first thing you need to do is to enable the “Developer Tab”. When you first install Microsoft Excel, a developer wouldn’t be there. So, you need to enable it from the settings.

- First, go to the File tab and click on the “Customize Ribbon” category.
- Now from the tab list, tick marks the developer tab and click OK.
Now when you come back to your Excel window, you’ll have a developer tab on the ribbon.
84. Enable Macros
When you open a macro-enabled file, you need to enable macro options to run VBA codes. Follow these simple steps:

- First, go to the File tab and click on the “Trust Center” category.
- From here click on “Trust Center Settings”.
- Now in “Trust Center Settings”, click on macro settings.
- After that, click on “Enable all macros with Notifications”.
- In the end, click OK.
85. AutoCorrect Option
If you do a lot of data entry in Excel, then this option can be a game-changer for you. With the auto-correct option, you can tell Excel to change a text string into another when you type it.
Let me tell you an example:
My name is “Puneet” but sometimes people write it like “Punit” but the correct spelling is the first one. So, what I can do is, use autocorrect and tell Excel to change “Punit” into “Puneet”. Follow these simple steps:

- First, go to the File tab and go to options and click on the “Proofing” category.
- After that, click on “AutoCorrect Option” and this will open the auto-correct window.
- Here in this window, you have two input bars to specify the text to replace and text to replace with.
- Enter both values and then click OK.
86. Custom List
Just think like this, you have a list of 10 products that you sell. Whenever you need to insert those product names you can insert them using a custom list. Let me tell you how to do this:
- First, go to the File tab and go to options and click on the “Advanced” category.
- Now, drill down and go to the “General” section and click on “Edit Custom List…”.
- Now in this window, you can enter the list, or you can also import it from a range of cells.
In the end, click OK.
Now, to enter the custom list you have just created, enter the first entry of the list in the cell and then drill down that cell using the fill handle.
87. Apply Table
If you use pivot tables a lot then it’s important to apply the table to the raw data. With a table, there is no need to update the pivot table’s data source, and it drag-down formulas automatically when you add a new entry.

To apply the table to the data just use Ctrl + T keyboard shortcut key and click OK.
88. Gridline Color
If you are not happy with the default color of cell gridlines then you can simply change it with a few clicks and follow these simple steps for this:
- First, go to the File tab and click on the “Advanced” category.
- Now, go to the “Display options for this workbook” section and select the color you want to apply.

- In the end, click OK.
Related – Print Gridlines
89. Pin to Taskbar
This is one of my favorite one-time sets up to save time in the long run. The thing is instead of going to the start menu to open Microsoft Excel, the best way is to point it to the taskbar.

This way you can open it by clicking on the icon from the taskbar.
90. Macro to QAT
If you have a macro code that you need to use frequently. Well, the easiest way to run a macro code is to add it to the Quick Access Toolbar.

- First, go to the File tab and click on the “Quick Access Toolbar” category.
- After that, from “Choose Command from”, select Macros.
- Now select the macro (you want to add to QAT) and click on add.
- From here click on “Modify” and select an icon for the macro button.
- In the end, click OK.
Now you have a button on QAT that you can use to run the macro code you have just specified.
Related – How to Record a Macro in Excel
91. Select Formula Cells
Let’s say you want to convert all the formulas into values and the cells where you have formulas are non-adjacent. So instead of selecting each cell one by one, you can select all the cells where you have a formula. Here are the steps:
- First, go to Home Tab ➜ Editing ➜ Find & Select ➜ Go To Special.
- In the “Go To Special” dialog box, select formulas and click OK.

92. Multiply using Paste Special
To do some one-time calculations you can use the paste special option and save yourself from writing formulas.
93. Highlight Duplicate Values
Well, you can use a VBA code to highlight values but the easiest way is to use conditional formatting. Here are the steps you need to follow:

- First of all, select the range where you want to highlight the duplicate values.
- After that, go to Home Tab ➜ Styles ➜ Highlight Cells Rule ➜ Duplicate Values.
- Now from the dialog box, select the color to use and click OK.
Once you click OK, all the duplicate values will get highlighted.
94. Quick Analysis Tool
If you ever noticed that when you select a range of cells in Excel, a small icon at the bottom of the selection appears? This icon is called the “Quick Analysis Tool”.

When you click on this icon you can see some of the options which are there on the ribbon which you can directly use from here to save time.
95. RUN Command
Yes, you can also open your Excel application using the RUN command.

- For this, all you have to do is open RUN (Window Key + R) and then type “excel” into it.
- In the end, hit enter.
96. Open Specific File
I’m sure like me you also have a few or maybe one of those kinds of workbooks that you open every day when you start working on Excel. There is an option in Excel which you can use to open a specific file(s) whenever you start Excel in your system. Here are the steps.

- Go to File ➜ Options ➜ Advanced ➜ General.
- In general, enter the location (yes, you have to type) of the folder where you have those file(s) in “At startup open all the files in”.
97. Open Excel Automatically
Whenever I “Turn ON” my laptop the first thing I do is open Excel and I’m sure you do the same thing. Well, I’ve got a better idea here, you can add Excel to your system’s startup folder.

- First, open “File Explorer” by using the Windows key + E.
- Now, enter the below address into the address bar to open the folder (change the username with your actual username).
- C:UsersUserAppDataRoamingMicrosoftWindowsStart MenuProgramsStartup
- After that, open the Start Screen, right-click on the Excel App, and click Open file location.
- From the location (Excel App Folder), copy the Excel App icon and paste it into the “Startup” folder.
Now whenever you open your system, Excel will automatically start.
98. Smart Look Up
In Excel, there is an option called “Smart Lookup” and with this option, you can look up a text on the internet. All you have to do is, select a cell or a text from a cell, and go to Review ➜ Insights ➜ Smart Lookup.

Once you click on it, it opens a side pane where you’ll have information about that particular text which you have selected. The idea behind this option is to get information by seeing definitions, and images for the topic (text) from different online sources.
99. Screen Clipping
Sometimes you need to add screenshots to your spreadsheet. And for this, Excel has an option that can capture the screen instantly, and then you can paste it into the worksheet. For this go to ➜ Insert ➜ Illustrations ➜ Screen Clipping.

Related – Excel Camera
100. Locate a Keyboard Shortcut
If you use Excel 2007 to Excel 2016, then you can locate a keyboard shortcut by pressing the ALT key. Once you press it, it shows the keys for the options which are there on the ribbon, just like below.

Let’s say, you want to press the “Wrap Text” button, and the key will be ALT H W. In the same way you can reach all the options using the shortcut keys.
Related – Insert Row
101-300
- Add and Delete a Worksheet in Excel
- Add and Remove Hyperlinks in Excel
- Add Watermark in Excel
- Apply Accounting Number Format in Excel
- Delete Hidden Rows in Excel
- Deselect Cells in Excel
- Draw a Line in Excel
- Formula Bar in Excel
- Add a Button in Excel
- Add a Column in Excel
- Apply Comma Style in Excel
- Group Worksheets in the Excel
- Make Negative Numbers Red in Excel
- Merge – Unmerge Cells in Excel
- Show Ruler in Excel
- Spell Check in Excel
- Fill Handle in Excel
- View Two Sheets Side by Side in Excel
- Increase and Decrease Indent in Excel
- Insert an Arrow in a Cell in Excel
- Remove Pagebreak in Excel
- Rotate Text in Excel (Text Orientation)
- Row Vs Column in Excel (Difference)
- Delete Blank Rows in Excel
- Sort By Date, Date, and Time & Reverse Date Sort in Excel
- Find and Replace in Excel
- Make a Paragraph in a Cell in Excel
- Cell Style (Title, Calculation, Total, Headings…) in Excel
- Hide and Unhide a Workbook in Excel
- Change Date Format in Excel
- Center a Worksheet Horizontally and Vertically in Excel
- Make a Copy of the Excel Workbook (File)
- Write (Type) Vertically in Excel
- Add or Remove Grand Total in a Pivot Table in Excel
- Add Running Total in a Pivot Table in Excel
- Add Calculated Field and Item (Formulas in a Pivot Table)
- Count Unique Values in a Pivot Table in Excel
- Delete a Pivot Table in Excel
- Filter a Pivot Table in Excel
- Add Ranks in Pivot Table in Excel
- Apply Conditional Formatting to a Pivot Table
- Pivot Table using Multiple Files in Excel
- Group Dates in a Pivot Table
- Link a Single Slicer with Multiple Pivot Tables
- Move a Pivot Table
- Pivot Table Formatting
- Pivot Table Keyboard Shortcuts
- Pivot Table Timeline in Excel
- Refresh a Pivot Table
- Refresh All Pivot Tables at Once in Excel
- Sort a Pivot Table in Excel
- Apply Print Titles in Excel (Set Row 1 to Print on Every Page)
- Apply Multiple Filters to Columns
- Create a Data Validation with Date Range
- Create a Yes – No Drop Down in Excel
- Merge Cells in Excel without Losing Data in Excel
- Remove Drop Down List (Data validation) in Excel
- Formulas in Conditional Formatting
- Print a Graph Paper in Excel (Square Grid Template)
- Recover Unsaved Excel Files When Excel Crashed
- Save Excel File (Workbook) as CSV (XLSX TO CSV)
- Create a Pivot Table from Multiple Worksheets
- Create Pivot Chart in Excel
- Activate a Sheet using VBA
- Create WAFFLE CHART in Excel
- Excel Funnel Chart (Template + Steps to Create)
- Excel Gantt Chart Template
- Add a Horizontal Line in a Chart in Excel
- Add a Vertical Line in a Chart in Excel
- Create a Bullet Chart in Excel
- Create a Dynamic Chart Range in Excel
- Create a HEAT MAP in Excel (Simple Steps) + Template
- Create a Milestone Chart in Excel
- Create a Population Pyramid Chart in Excel
- Create a Step Chart in Excel
- Create a Tornado Chart in Excel
- Create Interactive Charts in Excel
- Insert a People Graph in Excel
- Top 10 ADVANCED Excel Charts and Graphs (Free Templates Download)
- Add Secondary Axis in Excel Charts
- Create a HISTOGRAM in Excel – Step by Step
- SPEEDOMETER Chart in Excel
- Thermometer Chart in Excel
- Merge [Combine] Multiple Excel FILES into ONE WORKBOOK
- Perform VLOOKUP in Power Query in Excel
- Calculate the Coefficient of Variation (CV) in Excel
- Does Not Equal Operator in Excel
- MAX IF in Excel
- Round a Number to Nearest 1000, 100, and 10 in Excel
- Round to Nearest .5, 5. 50 (Down-Up) in Excel
- Square a Number in Excel
- #DIV/0
- #SPILL!
- #Value
- 3D Reference in Excel
- Wildcard Characters in Excel
- Hide Formula in Excel
- R1C1 Reference Style in Excel
- VLOOKUP with Multiple Criteria in Excel
- Wildcards with VLOOKUP in Excel
- Average TOP 5 Values in Excel
- Calculate Compound Interest in Excel
- Calculate Cube Root in Excel
- Calculate Percentage Variance (Difference) in Excel
- Calculate Simple Interest in Excel
- Calculate the Weighted Average in Excel
- Absolute Reference (Excel Shortcut)
- Add Column (Excel Shortcut)
- Add Indent (Excel Shortcut)
- Add New Sheet (Excel Shortcut)
- Align Center (Excel Shortcut)
- Apply Border (Excel Shortcut)
- Apply and Remove Filter (Excel Shortcut)
- Auto Fit (Excel Shortcut)
- AutoSum (Excel Shortcut)
- Check Mark (Excel Shortcut)
- Clear Contents (Excel Shortcut)
- Close (Excel Shortcut)
- Currency Format (Excel Shortcut)
- Delete Cell (Excel Shortcut)
- Delete Row(s) (Excel Shortcut)
- Delete Sheet (Excel Shortcut)
- Edit Cell (Excel Shortcut)
- Fill Color (Excel Shortcut)
- Freeze Pane (Excel Shortcut)
- Full Screen (Excel Shortcut)
- Group (Excel Shortcut)
- Hyperlink (Excel Shortcut)
- Insert Cell (Excel Shortcut)
- Lock Cells (Excel Shortcut)
- Merge-Unmerge Cells (Excel Shortcut)
- Paste Values (Excel Shortcut)
- Percentage Format (Excel Shortcut)
- Select Row (Excel Shortcut)
- Show Formulas (Excel Shortcut)
- Subscript (Excel Shortcut)
- Superscript (Excel Shortcut)
- Switch Tabs (Excel Shortcut)
- Transpose (Excel Shortcut)
- Shortcut for Unhide Columns (Excel Shortcut)
- Zoom-In (Excel Shortcut)
- Pivot Table Keyboard Shortcuts
- Apply Date Format (Excel Shortcut)
- Apply Time Format (Excel Shortcut)
- Delete (Excel Shortcut)
- Open Go To Option (Excel Shortcut)
- Add Month to a Date in Excel
- Add Years to Date in Excel
- Add-Subtract Week from a Date in Excel
- Compare Two Dates in Excel
- Convert Date to Number in Excel
- Count Years Between Two Dates in Excel
- Custom Date Formats in Excel
- Get Day Name from a Date in Excel
- Get Day Number of Year in Excel
- Get First Day of the Month in Excel (Beginning of the Month)
- Get Quarter from a Date [Fiscal + Calendar] in Excel
- Get Years of Service in Excel
- Highlight Dates Between Two Dates in Excel
- Number of Months Between Two Dates in Excel
- Quickly Concatenate Two Dates in Excel
- Years Between Dates in Excel
- Add Hours to Time in Excel
- Add Minutes to Time in Excel
- Calculate Time Difference Between Two Times in Excel
- Change Time Format in Excel
- Military Time (Get and Subtract) in Excel
- Separate Date and Time in Excel
- Count Between Two Numbers (COUNTIFS) in Excel
- Count Blank (Empty) Cells using COUNTIF in Excel
- Count Cells Less than a Particular Value (COUNTIF) in Excel
- Count Cells Not Equal To in Excel (COUNTIF)
- Count Cells That Are Not Blank in Excel
- Count Cells with Text in Excel
- Count Greater Than 0 (COUNTIF) in Excel
- Count Specific Characters in Excel
- Count the Total Number of Cells from a Range in Excel
- COUNT Vs. COUNTA
- OR Logic in COUNTIF/COUNIFS in Excel
- Sum an Entire Column or a Row in Excel
- Sum Greater Than Values using SUMIF
- Sum Not Equal Values (SUMIFS) in Excel
- Sum Only Visible Cells in Excel
- Sum Random Cells in Excel
- SUMIF / SUMIFS with an OR Logic in Excel
- SUMIF with Wildcard Characters in Excel
- SUMIFS Date Range (Sum Values Between Two Dates Array)
- Add New Line in a Cell in Excel (Line Break)
- Add Leading Zeros in Excel
- Capitalize First Letter in Excel
- Change Column to Row (Vice Versa) in Excel
- Concatenate with a Line Break in Excel
- Create a Horizontal Filter in Excel
- Create a Star Rating Template in Excel
- Get the File Name in Excel
- Get Sheet Name in Excel
- Randomize a List (Random Sort) in Excel
- Separate names in Excel – (First & Last Name)
- Check IF 0 (Zero) Then Blank in Excel
- Check IF a Value Exists in a Range in Excel
- Combine IF and AND Functions in Excel
- Combine IF and OR Functions in Excel
- Compare Two Cells in Excel
- Conditional Ranking in Excel using SUMPRODUCT Function [RANKIF]
- IF Cell is Blank (Empty) using IF + ISBLANK in Excel
- IF Negative Then Zero (0) in Excel
- SUMPRODUCT IF to Create a Conditional Formula in Excel
- IFERROR with VLOOKUP in Excel to Replace #N/A in Excel
- Perform Two Way Lookup in Excel
- VLOOKUP MATCH Combination in Excel
The use of Microsoft Excel in daily life at home and office is to perform the calculation, analysis, and visualization of data and information.
Microsoft Excel is one of the most important workplace applications that help to organize the business system and processes of data and information by the use of columns and rows with formulas.
Microsoft Excel Application is developed and marketed by Microsoft Inc. for Windows, Mac OS, Cloud computing, and Android users.
In the excel spreadsheet users can do all kinds of mathematical, financial, and logical calculations, data manipulation, data analysis, and visualization of information in quick ways.
Excel is used by students, teachers, job seekers, managers, entrepreneurs, companies, retailers, distributors, freelancers, bloggers, and housewives in their daily life.
Microsoft Excel’s first version was released 31 years ago on September 30, 1985. Today, the latest version you can download is version 16.0 or Excel 2016.
Commonly people download & buy complete MS Office. Because Microsoft Office Suite includes all official applications such as Microsoft Word, PowerPoint, Excel, Publisher, and Outlook in one complete package.
The Excel spreadsheet is a group of 10,48,576 rows and 16384 columns. Excel is in a table format in which one index is called a CELL. In Excel, there are three worksheets by default. A group of worksheets is called the workbook. Workbooks and electronic spreadsheets are now synonyms of Microsoft Excel.
For a higher level of data calculation and manipulation, the use of the function library in Excel is important to utilize. The function library in Excel contains Financial, Logical, and text filtration formulas that are most important to practice for every excel learner.
Excel also provides table styles and conditional formatting options for users. That is very beneficial to the visualization of data in colors, based on a condition in the cells.
Explore: How to learn Microsoft Excel in the best way possible
Microsoft Excel software provides very wide features and functionalities for everyday official work. Let’s understand the various uses of Microsoft Excel features in daily life, based on different types of users around the world.
Top 8 Exceptional uses of Microsoft Excel
1. Uses of Microsoft Excel in Education: –
Teachers can use table styles, shapes, charts, data tools, and formulas to teach students in the classrooms. Students can learn and solve basic and logical-mathematical problems and statistics in excel.
Teachers can educate by creating a table in an Excel sheet. They can highlight more interesting cells in colors, emphasize important values and visualize data using bars and charts.
Below is the basic example 1.0 of data visualization in Microsoft Excel 2010 (Note: data used in this example is not correct it’s just for an educational example.)

The above data visualization example is easy to understand and is created by the use of two excel functions conditional formatting and chart. You can see in the first picture that the literacy rate of countries is highlighted in red color by the use of conditional formatting.
Conditional formatting is used to decorate, and design, and visually appealing data by using data bars, color scales, and icons based on figures. Such as you can see that 99% of the literacy rate cell is filled more than others and 45% of cells are filled with less color than others.
In the charts, you can see China’s data bar is bigger than the others. Charts are used to compare values visually written inside the cell. You can access this option in the Insert menu.
Another use of Excel for teachers is to schedule periods.

You can insert the above period planner by using the template function in Excel.
As a similar example if you Google then you as a teacher or student can understand the various aspects of Microsoft Excel in Education.
If you don’t want Google then visit the Template menu and select the Education category and you will find out some outstanding pre-defined templates with formulas for various educational purposes. You can see a template picture in point 2 in which I am sharing a little more about templates.
The above example can be used in a Business similar, only need to change the values. The options of Microsoft Excel are the same for all users but it depends on us, how we use a particular option.
Must Read: Importance of Microsoft Excel for Students
2. Uses of Microsoft Excel in Business: –
I don’t think the business owner, either a small or big company can be productive and managed without the use of Microsoft Excel.
Microsoft Excel application can be used in various business operations. Such as goal setting, budgeting process, and planning, team management, account management, income, and expenses calculation, product and service valuation, and management of client data, etc. in business.
The uses of Microsoft Excel in business make such daily official operations faster, more accurate, and more predictable. Because Excel provides great features such as filters, charts, conditional formatting and pivot table, and logical and financial formulas.
Let’s see below the basic account management example 2.0 in Microsoft Excel (Note: This is just for example)

In the above example 2.0 you can see the basic income and expenses report month-wise with a quote of the month at the end. In quote column I used this formula: =IF(F6>=400000,”Outstanding”,IF(F6>=300000,”Above Average”, IF(F6>=200000,”Average”,”Below Average”)))
This is just but you can understand that only with the IF formula you can create thousands of types of logic in your business calculation. The above exercise is just created manually not a big deal. But if you want to access the real power of Microsoft Excel in Business operations then visit the template menu.
As you can see in the template picture that there are various high-quality templates that business users can use in their business calculations. Such as VAT Invoices, Marketing Campaign trackers, and break-even analyses are very beneficial.
The benefit of using the template in Excel is that you don’t need to create everything from scratch, you only need to select or search and then download it. After then you can edit the downloaded template according to your choice. This is that simple!

Must Read: Importance of Microsoft Excel in Business
3. Uses of Microsoft Excel in Goal Setting and Planning: –
Goal setting and planning is a tasks that we do repeatedly each day. Goal setting and planning are very important for everyone from students to business owners. But goal setting and planning take a white paper, time, and lots of calculation but if you use Excel then it becomes very easy and environmentally friendly.
Example 3.0

In this example, you can see that it’s very easy to design the complete financial plan and goals by using formulas, raw, and columns.
Example 3.1

You can see in example 3.1 that it’s easy to track goals and plan each day on excels.
4. Uses of Microsoft Excel for Business Owners: –
Online business owners or offline can use Excel to manage their daily life work. Such as work progress, team management, payout details, and business progress. Such as if you want to track your marketing campaign progress then go to the file-new- template and search for a marketing campaign and you will be amazed by seeing pre-designed and formulated cells.
Must Read: – How to make the best use of the internet as a small business owner
5. Uses of Microsoft Excel for Housewives: –
Housewives can use Excel to manage their daily house expenses. They can create monthly expense reports. They can track their spending habits. Also if housewives learn Excel then it’s also beneficial for them to teach kids basic excel skills too.
It is because many computer teachers are unable (due to various reasons) to teach all excel skills practically to students in schools.
The use of Excel for housewives is also helpful if they are doing business or jobs or looking for part-time work. There are various online and offline jobs and projects that they can do from home by learning and using excel.
Related: –16 ways to utilize your time to become a smart housewife
6. Uses of Microsoft Excel for Data Analysis: –
Data analysis is very important to work today for an online business or website owner (eCommerce, blog, forums, etc.). Such as tracking website visitors, product sales, customer reviews, marketing campaigns, user behavior, and events Such work is very time and brain-consuming especially when things are not going according to plan.
Microsoft Excel application provides great benefits for online business owners and customers. As filtering users’ data by country, filtering users by age, adding conditional formulas in big data, etc. are common daily tasks that can be handled smartly in excel.
7. Uses of Excel in the Daily Progress Report: –
Many online and offline companies and clients make it mandatory for virtual and offline staff to maintain their daily progress reports. It is not only beneficial for employees but also for companies to track daily progress reports.
You can create a table with Date, Time, Client, Task, Duration, and status according to demand from clients or managers.
Also, the daily progress report is very beneficial for students and teachers. But all start with learning and execution. As you know the computer is a magical device that we’re using in daily life. Routinely there are various uses of computers in our life but all depend on how much you’re interested in learning.
Related: – How to teach basic computer skills
8. Uses of Excel in Career Development: –
When you learn to excel, you learn the management of daily life. In daily life, there are various things that need to be calculated. Why? Because we’re doing multiple works in daily routine. Shopping, learning, entertainment, and expenses are all small things that need to manage.
If you’re a student then it is very important for you to learn Microsoft Excel. Microsoft Excel knowledge will help you to get a job. Because as I discussed above there are almost all small and medium businesses use Excel in their daily official works.
If you’re writing about computer skills in the resume then make sure that you know about Excel and Microsoft Office and Internet research and highlight such skills.
Career Development is more about career management. Time management, learning management, work, and life management, and goal-oriented habits are very important. Such things you can learn in excel. When you create your college expenses report then at the end of the month you can analyze where you’re spending more money.
Also if you’re doing learning or doing online courses then you can use Excel to track knowledge. Such as if you learned today about Conditional formatting then create a table with Date, Topic, and Satisfaction levels. This is very beneficial because then you can understand your daily learning outcomes and the effects of knowledge on you.
For example, if you’re learning digital marketing but you’re not tracking and creating notes in one line conclusion then it’s tough to implement that knowledge later. I mean for example today you learned about PPC and CTR and then it’s really important that you can write in your diary or in Excel about it in the conclusion or in summary.
Such kind of learning management is very important. Because it happens to me often when we learn something on the internet or on blogs because of different conclusions and we often forget about the main points.
For example, if I telling you to learn English typing then it’s just a piece of advice or suggestion but if I am telling you that learning English Typing by using basic typing lessons such as ASDF; LKJ etc. then it’s really important for you to note it down and practice.
Related:- Top 11 Most important Computer Skills to learn for career development
How to use and learn Microsoft Excel for personal benefits
The 1st method is that define what you want, before googling. For example, you want to create monthly expenses report in excel then type this same line in Google and you will get tutorials. Follow the steps and you will do it.
2nd method is you can take an online course and that will be more beneficial. Because then you can learn everything stepwise.
3rd method is to take admission in a computer institute and join offline classes of basic computer or Excel basics.
Conclusions: – The more you learn about excel the more you develop the ways to use excel in your daily life. I am still learning, why you don’t learn. It’s better to spend time learning than doing likes on unnecessary things. Understand your duty as a student because learning is more important for you than entertainment in life.
In the quick & progressing lifestyle of people, there is utmost demand for shortcuts & advanced methods to understand and resolve the daily problems.
Moreover, there are multiple tasks use of Excel that we do in our daily lives such as calculating monthly expenses, budgeting & goal setting, students tacking their syllabus and various other things that most people do in casual ways rather than following simple tools that provide concrete shapes.
Here are the Best 10 uses of MS Excel in our daily lives
-
Use of Excel for Students & Teachers:
Teachers can make the best use of table styles, charts, shapes, data tools, and various formulas to educate students in the classrooms. Whereas students can enhance their learning skills to solve basic and logical statistical & mathematical problems in excel.
-
Use of Excel for Goal Setting & Planning:
Goal setting & planning are the kinds of repeated tasks carried on each day. From business owners to students to housekeepers each individual is involved with the process of goal setting and planning. The goal-setting and planning process involves white paper, time, and the immense pressure of calculations, but with the use of MS Excel, this process has become efficient, quick, easy, and environmentally friendly.
Must Read:- 5 REASONS WHY MICROSOFT EXCEL IS IMPORTANT FOR ANALYTICAL CAREER
-
Use of excel for Entrepreneurs & Business Owners:
A large chunk of the millennial population across the world is aspiring to become an entrepreneur which requires not only efficient planning but also analysis of team performance, work progress, business progress & payout detail. Whether a new business or an established business, each can derive benefits from using excel. The data can be stored, analyzed and sophisticated presented on excel sheets using multiple tables, pivot tables, data highlighters, sorters, sheet and cells organizers among others.
-
Use of Excel for Housewives:
Housewives are known to be the best keepers of monthly expenses & saving money. And thus excel can assist housewives to manage their daily house expenses which can track down the spending habits of each member of the house. Furthermore, housewives using Excel can be beneficial for them to make their kids learn basic excel skills.
Must Read:- TOP 5 MOST IN DEMAND IT JOB SKILLS YOU NEED FOR THE FUTURE
-
Use of Excel for Career Development:
Career Development revolves around career management. The tasks such as learning management, time management, work, and life management and goal-focused habits are important which can be effectively practiced on MS excel.
-
Use of excel for Monthly Expenses Report:
Based on monthly expense data entered in the excel sheet, the user can create a comprehensive monthly expenses report which can highlight the top expenditure segments and study the pattern of expenditure & required savings pattern to be followed to reach the desired goal.
Start Learning Advanced Excel VBA
-
Use of excel for Online Access:
Another important use of MS Excel is that the files can be accessed online from any part of the world anytime and anywhere. It provides the convenience of accessing the excel files over mobile phones even if there is the unavailability of laptops & lets you exercise the work easily without any problem.
-
Use of excel for Developing Future Strategies:
The data relating to future strategies such as investments and major expenses anticipated at future date can be entered in the form of charts and graphs so it can lead to identify the trends and compare each possibility. Using MS Excel, the trend lines can be expressed through graphs and charts to forecast the future value of money invested.
-
Use of Excel for Create a Calendar or Schedule:
Whether it is family-based planning for a weekly, monthly or yearly calendar or a personal appointment daily planner or a schedule for managing bill payments, homework, favorite sports team’s games, and many more, excel can make it easy to compile, filter, search, organize and simplify large amounts of data.
-
Use of Excel for Event & Project Planning:
MS Excel is being widely used in the planning of a large work project or holiday or wedding party, where it can keep track of different tasks, efforts, and deadlines, and to analyze the schedules of collaborators in the planning of the event with other participants and make use of excel sheet as a central database of all relevant information required by all members to execute the project or event.
The more a person gets deeper in learning the wide benefits of excel, the more they tend to develop smarter ways to apply MS excel in daily life.
It is better to provide some time on learning & getting hands-on excel rather than doing things in unnecessary and less productive ways.
Other than the above-mentioned benefits, various other uses of excel can be developed as per the individual requirements.
Excel. Chances are, that word alone inspires visions of lengthy spreadsheets, complicated macros, and the occasional pivot table or bar graph.
It’s true—with more than one billion Microsoft Office users globally, Excel has become the professional standard in offices across the globe for pretty much anything that requires management of large amounts of data.
But, if you think Excel is only good for making you cross-eyed while looking at a bunch of numbers and financial reports, think again. As Tomasz Tunguz points out, there are tons of uses of Excel in business (and beyond) outside of simple spreadsheets. In fact, the potential uses are seemingly endless.
There’s no way for us to compile a list that captures every one of Excel’s possible applications (even if you were up for reading a War and Peace-sized listicle).
However, in an effort to demonstrate the power and flexibility of everybody’s favorite spreadsheet tool, we’ve pulled together different ways that you could use Excel—both professionally, personally, and just for the fun of it.
Free Excel crash course
Learn Excel essentials fast with this FREE course. Get your certificate today!
Start free course
All about numbers
Of course, the core purpose of Excel all boils down to numbers. If you need to sort, retrieve, and analyze a large (or even small!) amount of data, Excel makes it a breeze.
Here are a few broad categories to keep in mind when it comes to implementing Excel for anything numbers-related.
1. Calculating
Find yourself running the same calculations over and over again? Build yourself a totally customized calculator in Excel by programming your commonly-used formulas. That way, you just need to punch in your digits and Excel will spit the answer out for you—no elbow grease required.
2. Accounting
Budget plans, forecasts, expense tracking, financial reports, loan calculators, and more. Excel was pretty much designed to meet these different accounting needs. And, considering that 89 percent of companies utilize Excel for its various accounting functions, it obviously fits the bill.
Excel even has numerous different spreadsheet templates to make all of those processes that much easier.
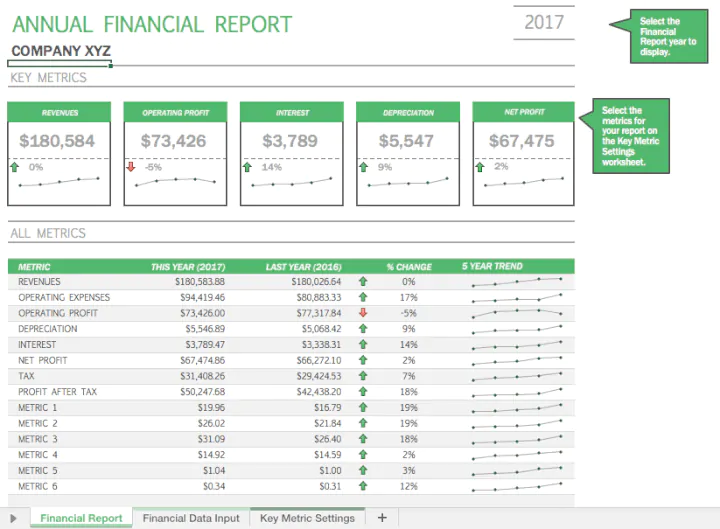
3. Charting
Pie charts, scatter charts, line charts, bar charts, area charts, column charts—the list goes on and on. If you need to find a way to represent data in a more visual and digestible way, Excel’s ability to transform rows and columns of digits into beautiful charts is sure to become one of your favorite things about it.
Want more information about the types of charts you can create in Excel? This article is a helpful resource.
Want to learn more?
Take your Excel skills to the next level with our comprehensive (and free) ebook!
4. Inventory tracking
Tracking inventory can be a headache. Fortunately, Excel can help to keep employees, business owners, or even individuals organized and on top of their inventory—before any major problems crop up.
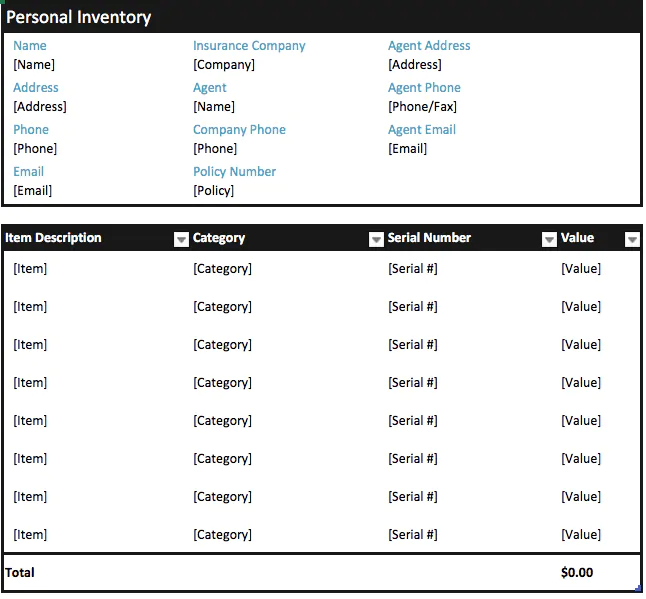
Making a plan
Let’s move on from the numbers—there are plenty of things that Excel can help you plan and organize that don’t necessarily involve endless rows of digits.
5. Calendars and schedules
Need to map out a content calendar for your blog or website? Lesson plans for your classroom? A PTO schedule for you and all of your co-workers? A daily schedule for you or your family? When it comes to various calendars, Excel can be surprisingly robust.
6. Seating charts
From a large corporate luncheon to a wedding, arranging a seating chart can be a royal headache. Fortunately, Excel can make it a total breeze. If you’re a real whiz, you’ll be able to automatically create your seating chart using your spreadsheet of RSVPs. Need help getting this done? This article provides a detailed walkthrough of how you can create a seating chart in Excel.

7. Goal planning worksheet
From professional goals to fitness goals to financial goals, it helps to have something to keep you focused and on track. Enter the beauty of Excel. Using the tool, you can create various worksheets, logs, and planning documents to help you monitor your progress—and, hopefully, cross the finish line.
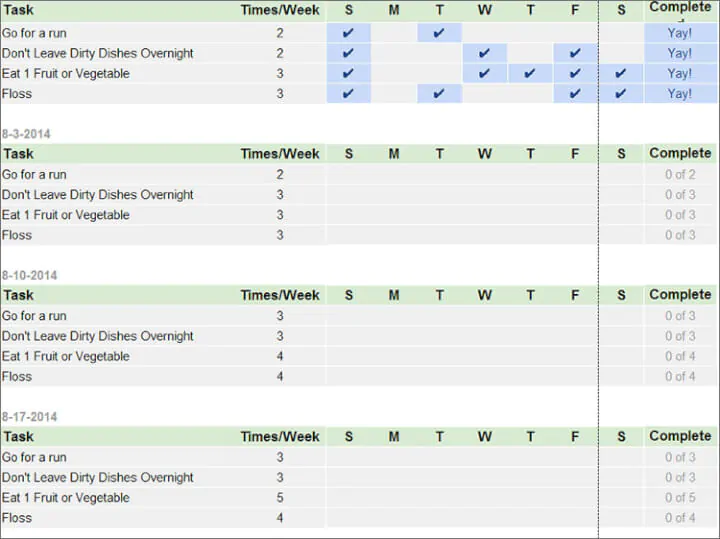
8. Mock-ups
Excel might not be the first platform you think of when it comes to design. But, believe it or not, you can use the tool to put together various mock-ups and prototypes. In fact, it’s a surprisingly popular choice for creating website wireframes and dashboards.
Getting stuff done
Want to kick your productivity into high gear? Well, Excel can swoop in and save the day with a variety of uses that can help you tackle your tasks and to-dos with ease and organization.
9. Task list
Say goodbye to your standard pen and paper to-do list. With Excel, you can make a far more robust task list—and even track your progress on those larger to-dos that are currently on your plate.
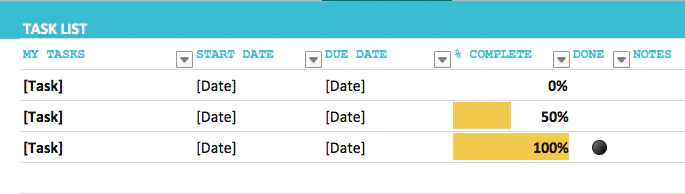
10. Checklist
Similarly, you can create a simple checklist that allows you to tick off the things you’ve purchased or accomplished—from a grocery list to a roster of to-dos for an upcoming marketing campaign.
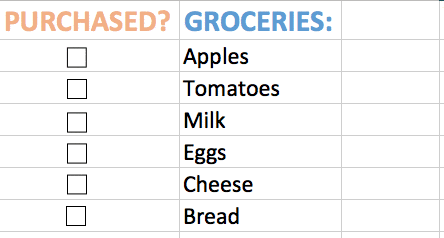
11. Project management charts
We’ve already touched on the fact that Excel is a total beast when it comes to creating charts. And, this concept holds true when it comes to various charts for project management.
From waterfall charts to manage your team’s progress to kanban style boards (just like Trello!) to keep things organized, there are tons of ways that Excel can help keep your project on track.

12. Time logs
You know that tracking time can be a huge asset to you and your productivity. While there are plenty of fancy apps and tools to help meet that need, you can think of Excel as the original tool for logging your time. And, it still serves as a suitable option today.
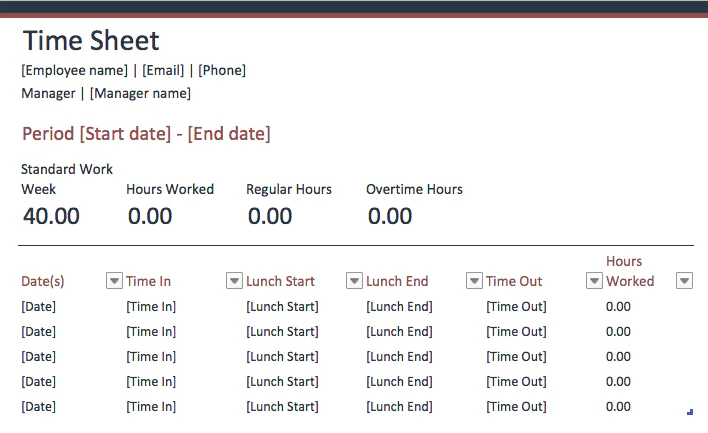
Involving other people
Need to collect information from other people? Survey tools and forms are one option. But, rest assured, you can also create your own in Excel.
13. Forms
From simple to complicated, Excel is a great option for creating forms. You can even program various drop-down menus so that users can select their choice from a pre-set list.
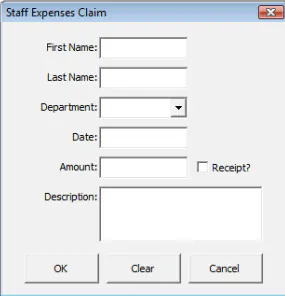
14. Quizzes
Trying to test somebody else’s—or even your own—knowledge of a subject? In Excel, you can create a bank of questions and answers in one worksheet, and then instruct Excel to quiz you in another.
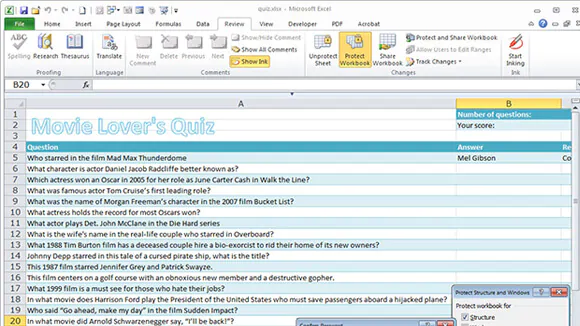
Staying in touch
Managing relationships is crucial to your success both professionally and personally. Fortunately, Excel makes it easy to keep in touch.
15. CRM
Need a lightweight CRM to stay top of mind for your customers? You can make one in Excel. And, the best part? Building your own means it will be totally customizable. Sales Hacker also put together a nifty set of free sales excel templates you can use to help get started!
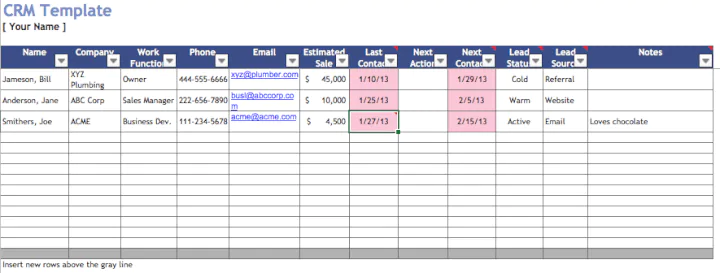
16. Mailing list
Data doesn’t just have to involve numbers. Excel is also great at managing and sorting large amounts of names and addresses—making it the perfect solution for your invite list for that company holiday party or the mailing list for that large promotion or campaign.
Using Excel, you can also mail merge—which makes it that much easier to print address labels and other necessary materials.
You can also apply a similar concept to create things like directories, RSVP lists, and other rosters that involve a large amount of information about people.
Just for fun
Excel doesn’t need to be all work and no play. There are plenty of other fun things you can create using the spreadsheet tool.
17. Historical logs
Whether you want to keep track of the various craft beers you’ve tasted, the workouts you’ve completed, or something else entirely, you can think of Excel as your go-to resource for keeping those things sorted and logged.
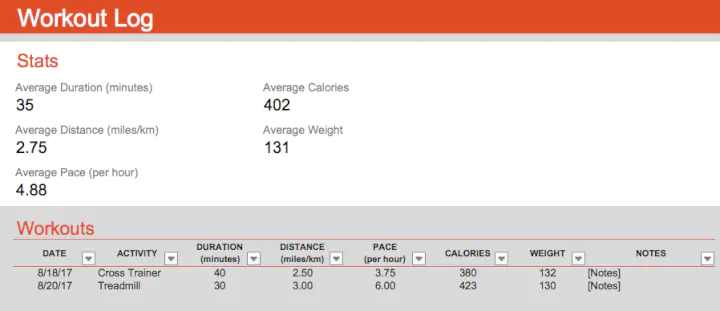
18. Sudoku puzzles
Love Sudoku puzzles? As it turns out, you can make your own in Excel. Or, if you find yourself stuck on a particularly challenging one, you can enlist the help of Excel to help you get it figured out!
Need help creating the Sudoku solver and generator? This post will get you well on your way!
19. Word cloud
Word clouds might not be the most scientific representations of data. But, they’re a fun (not to mention beautiful way) to gain an understanding of what words are being utilized most. You guessed it—you can create one using Excel. Here’s how to use information from Excel to create a word cloud in Wordle.
20. Art and animations
The capabilities of Excel likely extend far beyond what you’d initially anticipate. In fact, many people have used the tool to create some downright awesome art—from pixelated portraits to animations.
21. Trip planner
Have a vacation coming up? Make sure you have everything covered by creating yourself a helpful itinerary before you pack your bags and head out. Excel even has a handy trip planner template you can use to make sure you don’t miss anything (from your budget to airline information!).
Over to you
This might seem like a lengthy list. But, rest assured, it barely scratches the surface of all of the different things—aside from simple spreadsheets—that Excel is capable of. From lists to charts to design mock-ups, the different uses of Excel are seemingly limitless.
Feeling intimidated? Don’t worry — you can learn Excel online, all at your own pace, and become a spreadsheet ninja in no time.
Do you have something cool you like to create using Excel? Let us know in the comments!
Free Excel crash course
Learn Excel essentials fast with this FREE course. Get your certificate today!
Start free course