
The balance sheet is a very important financial statement that summarizes a company’s assets (what it owns) and liabilities (what it owes). A balance sheet is used to gain insight into the financial strength of a company. You can also see how the company resources are distributed and compare the information with similar companies.
Advertisement
No balance sheet statement is complete (in my opinion) without an income statement to go along with it. As a small business owner, I find the income statement to be more useful in the general operation of the business, but the balance sheet is still a critical accounting tool that provides a key piece of information.
The balance sheet informs company owners about the net worth of the company at a specific point in time. This is done by subtracting the total liabilities from the total assets to calculate the owner’s equity, also known as shareholder’s equity (for corporations) or simply the net worth.

Download
⤓ Excel
For: Excel 2007 or later & Excel for iPad/iPhone
⤓ Google Sheets
Other Versions
Template Details
License: Private Use (not for distribution or resale)
«No installation, no macros — just a simple spreadsheet» — by
Description
Download our free Balance Sheet template, designed for the small-business owner. It includes common financial ratios and works well for a two-year comparison. See below for more information on the different asset and liability categories.
Balance Sheet Essentials
The Accounting Equation: Assets = Liabilities + Owner’s Equity
Current Assets
The term current in a balance sheet generally means «short-term» which is usually one year or less. Common current assets includes cash (cash, coin, balances in checking and savings accounts), accounts receivable (amounts owed to your business by your customers usually within 10-60 days), inventory (goods for sale), and prepaid expenses (e.g. insurance and rent).
Long-Term Assets
These assets include long-term investments, cost of property and equipment (e.g. land, buildings, equipment, tools, furniture, computers, vehicles, etc.) offset by accumulated depreciation, intangible assets (e.g. patents, contracts, trademarks, copyrights, and goodwill), and other assets (like deferred income tax arising from the loss of value of property that cannot be reported as a tax deduction until the property is sold).
Current Liabilities
These include the obligations to be paid within one year, including accounts payable, short-term loans, income taxes payable, wages, unearned revenue (e.g. service contracts), and the current portion of long-term debt (e.g. mortgage payments payable within 12 months).
Long-Term Liabilities
These include long-term debt (e.g. notes, mortgages), capital lease obligations (e.g. leases structured as loans), and deferred income tax (e.g. the tax due on the increase in value of an investment security that isn’t paid until the security is sold).
Owner’s Equity (or Stockholders’ Equity for corporations)
This is basically the amount left over when you subtract Total Liabilities from Total Assets. In includes the owner’s investment(s) and retained earnings (the portion of the profits reinvested in the business). For corporations, there are usually more categories (see the references below).
Balance Sheet References
- Financial Accounting: Reporting and Analysis by M.A. Diamond, E. K. Slice, and J.D. Slice., 2000.
- Balance Sheet, Fixed Assets, Intangible Assets, Deferred Tax, Shareholders’ Equity at wikipedia.org
Disclaimer: This balance sheet spreadsheet and the information on this page is for illustrative and educational purposes only. We do not guarantee the results or the applicability to your financial situation. You should seek the advice of qualified professionals regarding financial decisions.
|November 21, 2013||Mapping, SUBTOTAL, SUMIFS
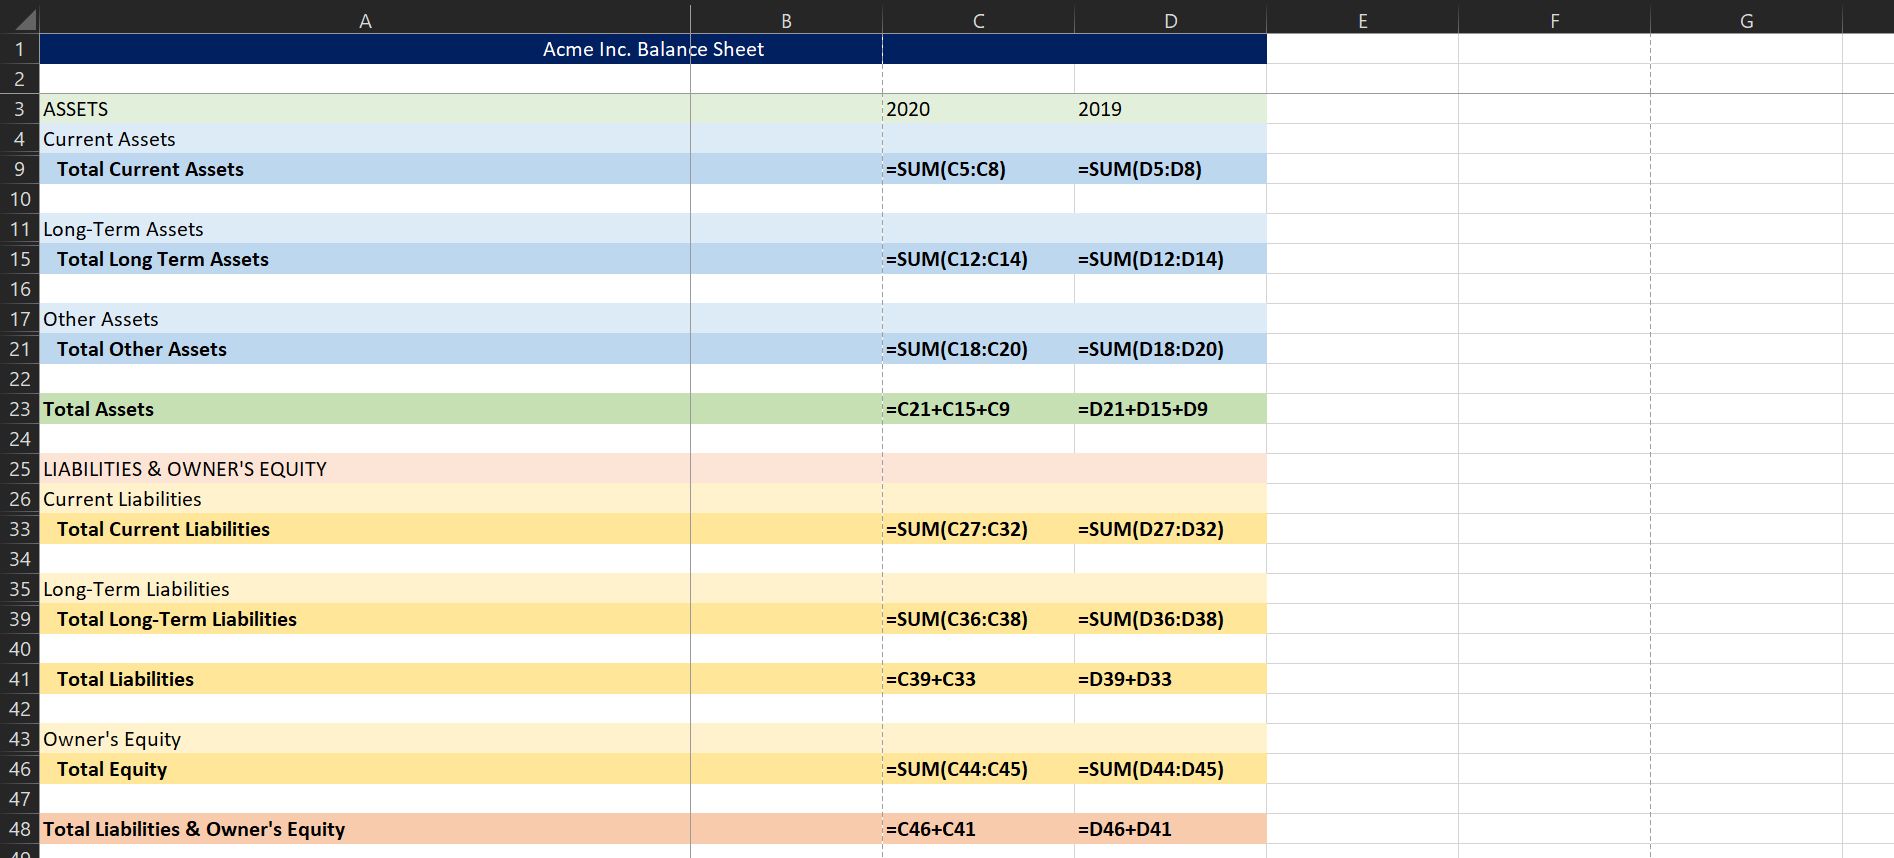
Excel Balance Sheet
This post illustrates how to create a financial statement such as a balance sheet with built-in Excel features and functions. Our primary objective is to build a workbook that efficiently pulls values from the trial balance into the balance sheet.
Overview
For the purpose of this post, let’s assume we have a data sheet that contains the source data for the report, we’ll call this data the trial balance. Next, we’ll assume that we need to get the data from the data sheet into the report sheet in an automated way. In order to efficiently retrieve the amounts, or account balances, into the report (balance sheet) we’ll use Excel’s built-in conditional summing function SUMIFS. If you’ve not explored this amazing function, I wrote a blog post that discusses the SUMIFS Function so feel free to check it out if you would like to review the function’s syntax.
Let’s take a look at the data sheet containing the data for the report, our simplified trial balance.

Excel Trial Balance with Account Balances
Now, let’s take a look at our desired balance sheet layout.

Excel Balance Sheet structure
One challenge that Excel users face when building a report such as a balance sheet is the fact that the report labels don’t match the data labels. For example, the account name in the trial balance is Checking, but the value needs to be reflected in the balance sheet as Cash. We need to provide Excel with these label translations so that we can use the SUMIFS function to retrieve the correct account balances for each report line.
In the screenshot below, I’ve updated the trial balance and mapped the account names to the financial statement labels.
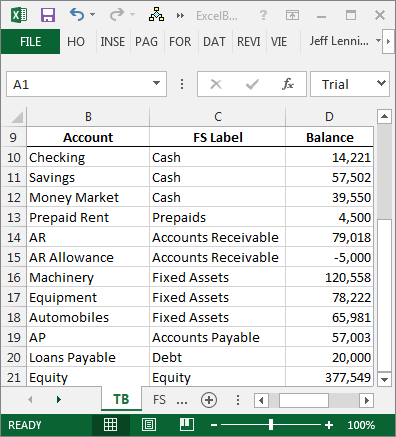
Trial balance with account balances mapped to the financial statement lines
Also note that in some cases, many accounts are mapped to one report line, for example, AR and AR Allowance are both mapped to the Accounts Receivable balance sheet line.
Once we have defined the mapping, we can easily compute the financial statement values with the SUMIFS function. For example, we could use the following formula in cell C7 in our balance sheet:
=SUMIFS(TB!D:D,TB!C:C,B7)
Where:
- TB!D:D is the sum range, the account balance column on the TB trial balance worksheet
- TB!C:C is the criteria range, the report label column on the TB trial balance worksheet
- B7 is our report label
We can fill the formula throughout the report to complete the balance sheet. The completed report is shown below.
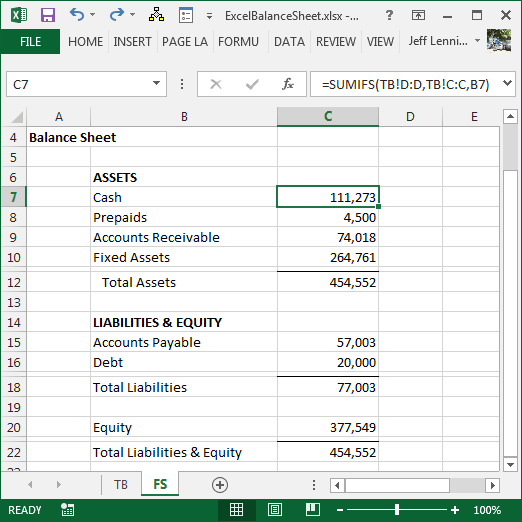
Excel Balance Sheet with amount formulas
And there you have it!
Note: for recurring-use workbooks, you can set up the mapping in a dedicated worksheet and then use lookup functions to retrieve the report labels into the trial balance, or conversely, use SUMIFS to retrieve the trial balance values into the map itself.
Additional Considerations
In addition to achieving the key objective, which was to automatically group and pull account balances into the balance sheet, here are a few finer points to consider when building recurring-use reporting workbooks.
- Build dynamic formula-based report headers
- Indent with the indent command, not with leading spaces or into a new column
- Use an error check sheet to ensure all data from the trial balance made it to the balance sheet
- Use a start here sheet to store global settings
- Use the SUBTOTAL function rather than SUM to compute the balance sheet totals
- Use skinny rows between the last data row and the formula row
Notes
- If you have not played with the SUBTOTAL function before, please enroll into the FREE Better Summing online course so you can learn the details of this marvelous function!
- The SUBTOTAL function and skinny rows were covered in Excel University Volume 1.
- Additional post concepts including mapping tables, dynamic headers, errorck, start here, and indentation, are derived from Excel University Volume 2. For more information or details, please feel free to pick up a copy of the book or enroll into the online course.
Conclusion
Feel free to download the file that was used to create the screenshots above, which includes the formulas, and remember, Excel rules!
ExcelBalanceSheet
Содержание
- Create a Balance Sheet with Excel
- Overview
- Additional Considerations
- Notes
- Conclusion
- Balance Sheet: Definition, Examples, Templates in Excel!
- So, What is a Balance Sheet, and What are the benefits of preparing it?
- How to create a Balance Sheet in Excel?
- What to look in the Balance Sheet at?
- What is the difference between the Income Statement and Balance Sheet?
- How do you prepare an Income Statement from a Balance Sheet?
- Where profit and loss show in the Balance Sheet?
- How do you record loss in the Balance Sheet?
- Is the Balance Sheet prepared first?
- Does Excel have a Balance Sheet template?
Create a Balance Sheet with Excel
This post illustrates how to create a financial statement such as a balance sheet with built-in Excel features and functions. Our primary objective is to build a workbook that efficiently pulls values from the trial balance into the balance sheet.
Overview
For the purpose of this post, let’s assume we have a data sheet that contains the source data for the report, we’ll call this data the trial balance. Next, we’ll assume that we need to get the data from the data sheet into the report sheet in an automated way. In order to efficiently retrieve the amounts, or account balances, into the report (balance sheet) we’ll use Excel’s built-in conditional summing function SUMIFS. If you’ve not explored this amazing function, I wrote a blog post that discusses the SUMIFS Function so feel free to check it out if you would like to review the function’s syntax.
Let’s take a look at the data sheet containing the data for the report, our simplified trial balance.
Excel Trial Balance with Account Balances
Now, let’s take a look at our desired balance sheet layout.
Excel Balance Sheet structure
One challenge that Excel users face when building a report such as a balance sheet is the fact that the report labels don’t match the data labels. For example, the account name in the trial balance is Checking, but the value needs to be reflected in the balance sheet as Cash. We need to provide Excel with these label translations so that we can use the SUMIFS function to retrieve the correct account balances for each report line.
In the screenshot below, I’ve updated the trial balance and mapped the account names to the financial statement labels.
Trial balance with account balances mapped to the financial statement lines
Also note that in some cases, many accounts are mapped to one report line, for example, AR and AR Allowance are both mapped to the Accounts Receivable balance sheet line.
Once we have defined the mapping, we can easily compute the financial statement values with the SUMIFS function. For example, we could use the following formula in cell C7 in our balance sheet:
- TB!D:D is the sum range, the account balance column on the TB trial balance worksheet
- TB!C:C is the criteria range, the report label column on the TB trial balance worksheet
- B7 is our report label
We can fill the formula throughout the report to complete the balance sheet. The completed report is shown below.
Excel Balance Sheet with amount formulas
And there you have it!
Note: for recurring-use workbooks, you can set up the mapping in a dedicated worksheet and then use lookup functions to retrieve the report labels into the trial balance, or conversely, use SUMIFS to retrieve the trial balance values into the map itself.
Additional Considerations
In addition to achieving the key objective, which was to automatically group and pull account balances into the balance sheet, here are a few finer points to consider when building recurring-use reporting workbooks.
- Build dynamic formula-based report headers
- Indent with the indent command, not with leading spaces or into a new column
- Use an error check sheet to ensure all data from the trial balance made it to the balance sheet
- Use a start here sheet to store global settings
- Use the SUBTOTAL function rather than SUM to compute the balance sheet totals
- Use skinny rows between the last data row and the formula row
Notes
- If you have not played with the SUBTOTAL function before, please enroll into the FREE Better Summing online course so you can learn the details of this marvelous function!
- The SUBTOTAL function and skinny rows were covered in Excel University Volume 1.
- Additional post concepts including mapping tables, dynamic headers, errorck, start here, and indentation, are derived from Excel University Volume 2. For more information or details, please feel free to pick up a copy of the book or enroll into the online course.
Conclusion
Feel free to download the file that was used to create the screenshots above, which includes the formulas, and remember, Excel rules!
Источник
Balance Sheet: Definition, Examples, Templates in Excel!
A Balance Sheet is one of the general-purpose financial statements (the other two are the Income Statement and Cash Flow Statement) that companies present to their shareholders. Small and middle-companies do it annually, and bigger ones do it quarterly. Although unincorporated businesses are not normally required to prepare balance sheets, it is often beneficial to do it. In this article, we will refer to both incorporated and unincorporated businesses as ‘companies’.
So, What is a Balance Sheet, and What are the benefits of preparing it?
A Balance Sheet is a ‘snapshot’ of the company’s financial situation at a certain point in time, normally at the end of the fiscal year. It answers three important questions:
- How much of value the company owns?
- How much it owes to its creditors?
- How much money would left for the company’s shareholders, if the company sells off all its assets, and pays off all its debts?
Things of value that the company owns are called Assets.
Although most assets are tangible, certain intangible items, such as, for example, money owed to the company by its customers, are considered assets, as long as it is probably that the company will be able to collect them from the debtors.
These are typical examples of assets:
- Cash: petty cash, money in bank accounts, short-term certificates of deposit;
- Accounts Receivable: money to be received from customers for goods sold or services provided by the company;
- Inventory: merchandise, goods manufactured for sale, materials;
- Prepaid Expenses, for example, rent paid upfront;
- Fixed Assets: property, machinery and equipment, trucks, cars and vans, and similar valuable long-term items.
Depending on the nature of their business, some companies may hold other classes of assets as well (marketable securities, financial investments, intangible assets, work in progress).
Money that the company owes to its creditors is called Liabilities.
Liabilities may arise from formal agreements, statutory requirements, or business customs and usual practices, as long as it is probably that the company will be required to spend money to settle the liability.
Typical examples of liabilities are:
- Accounts Payable: money owed to the company’s suppliers for goods and services purchased from them;
- Loans repayable, and interest payable on them;
- Wages and salaries payable;
- Taxes payable;
- Prepayments received from customers.
What is left of the company assets’ value after deducting liabilities is called Shareholder Equity. Sometimes it is referred to as Net Assets.
Although Shareholder Equity is a residual value, it is also broken down to several items. Typically, it encompasses the following:
- Share Capital: money paid in by the shareholders in exchange for equity shares. In the case of the sole entrepreneurship, it is money provided to the business by its owner;
- Retained earnings: earned net profit not yet distributed to shareholders;
Shareholder Equity may include other items as well, such as revaluation and other reserves, and additional paid-in capital.
As a business owner, how can you benefit from having a balance sheet prepared on a regular basis?
Firstly, it provides you with a quick snapshot of your business’s net assets, i.e. how much you own, and how much you can pay to yourself as dividends.
Secondly, it is easy to evaluate from balance sheet important financial metrics, such as Current Ratio and Debt (Debt-to-Equity) Ratio, indicating how healthy financially your business is.
Thirdly, by comparing balance sheets at different reporting dates you will be able to detect trends in your business and take timely action, if necessary.
How to create a Balance Sheet in Excel?
Normally, it is your accountant or bookkeeper who should prepare a balance sheet for you. However, if you are an owner of a small business, in most cases you will be able to do it yourself.
First, determine a reporting date. Except for rare special cases, financial statements must be prepared at the end of the last day of your fiscal year. You probably will be preparing the balance sheet in some time after the reporting date; however, you must present the items as they existed at the reporting date, not at the date when you are preparing the statement. For example, you must present there debts extinguished after the reporting date, if they were outstanding on that date.
Second, write down all your assets along with their values. If you maintained regular records, you can simply take respective figures from your books. Even if you did not, you still should be able to list your assets, and assign values to them. Value your inventory at the price you paid to buy them, or, if you are unable to trace back the purchase, at the price you would have paid to purchase such items. However, you should not value fixed assets, such as machinery, equipment and motor vehicles, at the purchasing price. Because these items gradually lose their value over time, due to wear and tear, and obsolescence, value them at the price you would be able to sell them for in present condition.
Sort all your assets into two categories. In the Current Assets category, include cash, accounts receivable, inventory, and other items that you expect to spend, sell or utilise within next twelve months; all other items include in the Non-Current Assets category.
Third, list all your obligations that existed at the reporting date. Although it may seem quite straightforward, there are traps that you ought to avoid. Do not forget to include in liabilities taxes which are payable in arrears. For example, sale tax or income tax resulting from your operation prior to the end of the reporting period are normally payable after the reporting date. Nevertheless, you must include them in liabilities at the date of the balance sheet. Similarly, wages that were paid shortly after the reporting date still must be presented in liabilities at that date.
Similarly to the assets, sort all your liabilities into two categories. Current Liabilities include those payable within next twelve months, whereas Non-Current Liabilities are those payable in more than one year after reporting date.
Next, calculate total value of all assets and liabilities. If you put them into Balance Sheet Excel template, it will be done automatically. A difference between total assets and total liabilities provides a value of Shareholder Equity.
Although you may stop at this point, it is advisable to break down Shareholder Equity into specific items. At very least, you should separate invested owner capital from retained earnings to see whether, and how much, the company’s capital increased over initial shareholder investment.
What to look in the Balance Sheet at?
As we have said, a Balance Sheet is a valuable source of information about the company’s financial situation.
First, look at the Shareholder Equity value. It must be positive, and ideally more that the value of shareholder investments (the sum of common shares and additional invested capital). If it is less, it may be due to accumulated losses, or over-distribution. In such a case, you should decide whether additional investment is necessary to cover the losses. In some cases, there may be legal obligation of shareholders to compensate the company for over-distribution.
However, if Shareholder Equity becomes negative, it means that the company cannot repay all its debts using existing assets, and will soon go bust, unless the shareholders put in additional money to keep the company afloat.
Next, look at the metric called the Current Ratio. Divide total value of current assets by the total value of current liabilities. This ratio should be more than 1, ideally 1.2 or more. It means that the company is liquid, i.e. well able to pay their short-term obligations out of existing current assets. If Current Ratio falls below 1, the company, though not outright insolvent, experiences difficulties in paying their current debts. However, too high ratio is not very good either. The Current Ratio exceeding 3 indicates that the company holds excessive assets that most probably are used inefficiently.
Next two metrics are the Debt Ratio and the Debt-To-Equity Ratio, both indicating degree of financial risk associated with using debt for financing the company’s operation. The Debt Ratio shows what share of the company’s assets is financed by debt; normally, it should be 0.7 or less, but this may vary for different industries. The Debt-To-Equity Ratio shows how heavily the company’s financial position is leveraged, i.e. how much of debt, as compared to equity, the company uses to finance its operation. The more its value, the more associated financial risk. Acceptable financial leverage for most industries varies from 60/40 (Debt-To-Equity Ratio 1.5) to 70/30 (Debt-To-Equity Ratio 2.33), and may be even 80/20 (Debt-To-Equity Ratio 4) for capital-intensive industries such as development.
What is the difference between the Income Statement and Balance Sheet?
Both are so-called general-purpose financial statements, i.e. standard financial statements intended primarily for a company’s shareholders. This is the only similarity though. While a Balance Sheet is a snapshot of the company’s financial position at a certain point in time called the reporting date, an Income Statement helps us to understand what happened to the company between successive reporting dates. It answers the following questions:
- How much of sales revenue and other income the company earned between two reporting dates (this is called the reporting period);
- How much of cost associated with sales of goods and services the company incurred during the reporting period;
- How much other expenses, such as general, administrative, and marketing expenses the company incurred;
- How much it cost for the company to pay for its debt (interest expense);
- What is the gross profit before tax, how much of income tax the company paid, what is its net profit that can be distributed to the shareholders, or used to expand its business.
Both the Balance Sheet and the Income Statement are widely used by financial analysts to assess how robust the company’s business is. If you only want to track some of your income and expenses, then you may use specifically prepared templates. For example we have Etsy Seller Spreadsheet for Etsy sellers to track their incomes and expenses, as well as a Rental Income & Expenses Excel Template for landlords. Someka also offers Rental Property Template in Google Sheets.
How do you prepare an Income Statement from a Balance Sheet?
You cannot. This is because of the different nature of both statements, as discussed above.
If, for example, you look at two pictures of the same person, ten years between them, you definitely will be able to tell certain changes. However, it is not probably that you will be able to say definitely what happened to that person during that time.
The same with financial statements. Suppose, accounts receivable, as shown in the balance sheet at the previous reporting date, were $1000, and now they are $500. Can we learn anything from these figures? No, because there could be a number of scenarios leading to the same outcome. These are just a few of them:
- The company sold nothing, but collected $500 from its customers;
- The company sold nothing, and wrote down $500 of uncollectable receivables;
- The company sold goods worth $500, and collected $1000 from its customers;
- Turn on your imagination to produce more.
Where profit and loss show in the Balance Sheet?
A Balance Sheet shows accumulated annual profits and losses in a single position called the Retained Earnings, which is part of Shareholder Equity.
Each time a company gets profit, it increases the balance of retaining earnings in the Balance Sheet by the amount of net profit, less distribution to shareholders.
Each time a company incurs loss, it decreases the balance of retaining earnings in the Balance Sheet by the amount of the loss.
How do you record loss in the Balance Sheet?
It is simple. Loss is presented as a negative amount in place of profit. However, if you previously recorded positive retained earnings, it will become negative only after losses completely offset accumulated profit. Diminishing balance of retained earnings in the Balance Sheet may indicate that the company incurs a loss; however, it may be due to the distribution of previous years’ profit as well.
Is the Balance Sheet prepared first?
Nowadays, most businesses, even the smallest, use accounting computer software to keep their records. If all transactions are registered correctly and timely, a full set of financial statements can be produced by the software instantly.
In the past, however, many small businesses, especially those relying heavily on cash transactions (small groceries, pubs, etc.), only kept records of cash receipts and payments. Probably, some of them still do. To properly calculate their net earnings, they needed to adjust cash receipts and payments by the change of inventory balances during the reporting period. Thus, they made a count of their inventories at each reporting date, and then those numbers went into the calculation of profit. Therefore, yes, they needed to prepare a balance sheet first.
Does Excel have a Balance Sheet template?
Yes, there are a lot of them.
Microsoft alone developed few, and other developers too.
Why then you may want to use Someka’s Balance Sheet Excel template?
There are a number of reasons:
- It is user-friendly;
- It features perfect graphic visualization and allows a user to instantly calculate important financial ratios;
- It is a commercial-grade template developed accordingly to high standards, yet free.
Источник
Balance Sheet Template is a ready-to-use template in Excel, Google Sheets, and OpenOffice that helps you to gain insights into the financial strengths of the company.
Moreover, this Balance sheet template gives you a snapshot of your financial position at a specific time. Usually, the businesses prepare a Balance Sheet quarterly, half-yearly, or yearly.
What Is Balance Sheet?
Balance Sheet is a financial statement of a company. It shows the assets, liabilities, equity capital, total debt, etc. at a given point of time.
In simple terms, a balance sheet shows:
- What your business owns. (Assets)
- What it owes. (Liabilities)
- What money is left for the owner? (Owner’s Equity)
For the balance sheet to reflect the true picture, both heads (liabilities & assets) should tally.
Thus, Assets = Liabilities + Equity.
Components of a Balance Sheet
There are two major components of a balance sheet: Assets and Liabilities.
Assets
Assets are the resources or things that your company owns. It consists of two categories: Current Assets and Long-term Assets. An asset is anything tangible or intangible that you own or hold and has a positive economic value.
Current Assets include the following items:
- Cash
- Accounts Receivable
- Stock/Inventory
- Prepaid Expenses
- Short-Term Investments
Long Term Assets include the following:
- Long-term Investments
- Property, Land, and Equipment. Accumulated Depreciation of all will be deducted from these assets.
- Intangible Assets
Other items include Deferred Income Tax.
Liabilities
Liabilities on are debts or obligations to be paid by a company. It is the amount that the company owes to its creditors.
Liabilities consist of 3 parts: Current Liabilities, Long-term liabilities, and Owner’s Equity.
Current Liabilities include the following:
- Short-term Loans
- Income Taxes Payable
- Accrued Salaries and Wages
- Unearned Revenue
- Current Portion of Long-term Loans
Long-term Liabilities include:
- Long-term Debt/Loans
- Deferred Income Tax
Liabilities include all payments to be made by your company. Therefore, any payable loans, accounts payable, unpaid credit card bills, or unpaid taxes must be included.
Owner’s Equity
Another very important head in the balance sheet is the owner’s equity. Your assets should be equal to total liabilities and owners’ equity.
We use the term Owner’s equity when the company is a sole proprietorship. Shareholder’s equity is used when it is a corporation.
In simple terms, the Owner’s Equity is the claim on the assets of a business. Those Assets which remain after deducting liabilities.
Eventually, Equity includes opening investments, contributions, owner’s capital, or retained earnings.
Thus, Equity = Assets – Liabilities.
Owner’s Equity includes:
- Owner’s Investment
- Retained Earnings
We have created a Balance Sheet Template that summarizes the company’s assets, liabilities, and equity. This will give your lender or investors an idea of the health of the company.
This template can be helpful to Accounts Assistants, Accountants, and Auditors, etc.
Excel Google Sheets Open Office Calc
Click here to Download All Financial Statement Excel Templates for ₹299.
You can also download other templates like Cash Flow Statement, Trial Balance, and Profit and Loss Account.
Let’s discuss the contents of the Balance Sheet Template.
Contents of Balance Sheet Template
This template has 3 sections: Asset, Liabilities, and Owner’s Equity. Owner’s Equity is a part of Liabilities and hence falls under the liabilities section.
Let’s understand what items we will be included in each section.
Asset
Insert the following items:
Cash on hand: All Cash including cash in hand + money in the bank.
Accounts Receivable: Receivable includes the total of your outstanding invoices. This does not include any invoices that are still in “draft” status.
Stock Inventory: Stock Inventory that your company holds for the ultimate purpose of resale. Sold items will not include in the Inventory.
Machinery or Equipment: Any Equipment/tangible items purchased for business usage. This equipment will not be bought for reselling.
Reimbursable expenses: Any reimbursable expenses that are already paid and will be reimbursed by another party.
You can customize the Assets section according to your needs.
Liabilities
Insert the following items:
Accounts Payable: This includes money that you owe to other parties other than loans. An example of this would be any unpaid invoice for any service. It can be advertising, electricity, telephone bills, etc.
Taxes Payable: Unpaid Taxes that you owe the government.
Current Loans Payable: Loans from banks or investment from the investors that you have not paid back yet.
Long Term Loans Payable: The Long-term loans that are yet to be paid.
You can customize the Liabilities section as required.
Owner’s Equity
Insert the following items in the Owner’s Equity.
Owner’s Capital: Capital is the owner’s investment in the company. You need to add the net income earned by the company. Whereas deduct any withdrawals by the owner from it.
Note: The owner’s bank account and the business bank account two are separate entities.
Retained earnings: Net income retained by the corporation and distributed to its owners as dividends.
Important Financial Ratios From Balance Sheet
In the end, we have included some important financial ratios from the Balance Sheet than can be helpful for further analytics:
- Debt Ratio.
- Current Ratio.
- Working Capital.
- Assets to Equity Ratio.
- Debt to Equity Ratio.
Advantages of A Balance Sheet
As the name states, it keeps business things in balance. As per the accounting rule, the total assets must be equal to liabilities and equity. Hence, if they don’t balance there is a mistake in the accounting process.
A balance sheet helps in calculating and analyzing financial ratios. Moreover, these ratios are helpful in comparing your competitors as well as your company’s financial strengths.
A balance sheet is also helpful in getting credit from financial institutes. Furthermore, seeing a balance sheet, n investor can make a decision for investment.
Limitation Of A Balance Sheet
Long-term assets are recorded on book value. Whereas, the actual market value is less of those assets. Therefore, these overvalued/undervalued assets distort the company’s wealth.
A balance sheet often misses the internally acquired assets. Furthermore, it also doesn’t take into consideration the assets that cannot be measured in monetary terms. These assets include irreplaceable technical workforce, online sales channels, loyalty, honesty, etc.
Moreover, the balance sheet records some of the assets in estimates that again doesn’t provide the true financial picture of the company.
We thank our readers for liking, sharing, and following us on different social media platforms, especially Facebook.
If you have any queries or questions, share them in the comments below. We will be more than happy to help you.
Frequently Asked Questions
How do you create a balance sheet?
You need to follow these 5 step process to prepare a balance sheet:
- Determine the reporting date and period.
- Identify your Assets.
- Identify your Liabilities.
- Calculate Shareholders’ Equity
- Add Total Liabilities to Total Shareholders’ Equity and Compare to Assets.
What does a strong balance sheet look like?
Simply having assets more than its liabilities cannot make a balance sheet strong. Strong balance sheets will have the following:
- Intelligent working capital.
- Positive Cash Flow.
- Proper capital structure.
- Income-generating assets.
What are the two types of balance sheets?
There are two types of balance sheets: Personal and Business. The personal Balance sheet displays an individual’s personal assets and liabilities. Whereas, the Business Balance Sheet consists of accounts payable, accounts receivables, intangible assets, etc.
Why is it called a balance sheet?
According to the balance sheet equation Asset – Liabilities = Owner’s Equity, each side of this equation must balance at the end of the period.
Who invented the balance sheet?
It is presumed that Luca Pacioli, a Franciscan Monk, presented the concept of balance sheet in the 15th Century.
What items are not presented on the balance sheet?
Off-balance sheet assets do not appear on the balance sheet. These OBS assets include leaseback agreements, operating leases, etc.
Where is TDS shown in the balance sheet?
TDS is a liability. It is the amount of tax we owe to the Government that we collect on behalf of the Government.
What is the difference between vertical and horizontal balance sheets?
Businesses that operate at lower scales will use vertical balance sheet. It consists of a single column to report the amounts.
Whereas, businesses that operate on a bigger scale, and have different branches/departments, prepare horizontal balance sheets. It is an additional balance sheet that displays the performance of each department/branch.
Whether you have a small business or a huge multinational corporation, you need to understand how your company grows. You should therefore keep track of your company’s finances by reviewing various financial statements.
The Income Statement, for example, shows how the organization makes and spends money. Alternatively, the Cash Flow Statement lets you see how much cash you have available, enabling you to budget your expenses correctly.
Lastly, there is the balance sheet, which is also one of the basic financial statements. Here’s a quick guide to help you make your own in Microsoft Excel.
What Is a Balance Sheet, and Why Do You Need One?

A Balance Sheet will let you see the breakdown of your company’s assets, liabilities, and equity. In one glance, you’ll see how much of the company came from retained earnings, owner’s equity, and loans.
With this information on hand, you can compute its return on investment and its various financial ratios. You can then compare these values against similar companies in the same industry. This will give you a sense of how the business is performing versus its peers in the industry.
1. Select the Time to Cover
As with other financial statements, you have to pick a period to cover. Typically, this starts on January 1st and ends on December 31st.
However, you could also choose a different period for computation, called the fiscal year, which begins on Oct 1 and ends on September 30. Do note that whatever period you use here must be consistent across your other statements.
2. Prepare Your Accounts
To avoid the hassle of having to dig through your records when you’re making your balance sheet, you should prepare it beforehand. Make sure to have your cash flow statement, bank statements, loan account statements, and credit card balances available to you.
Before you begin, you need to know the value of the assets and inventory on hand. Don’t forget to include the amount you put down to start your business, as well as investments made by other people and entities.
3. Create the Excel File
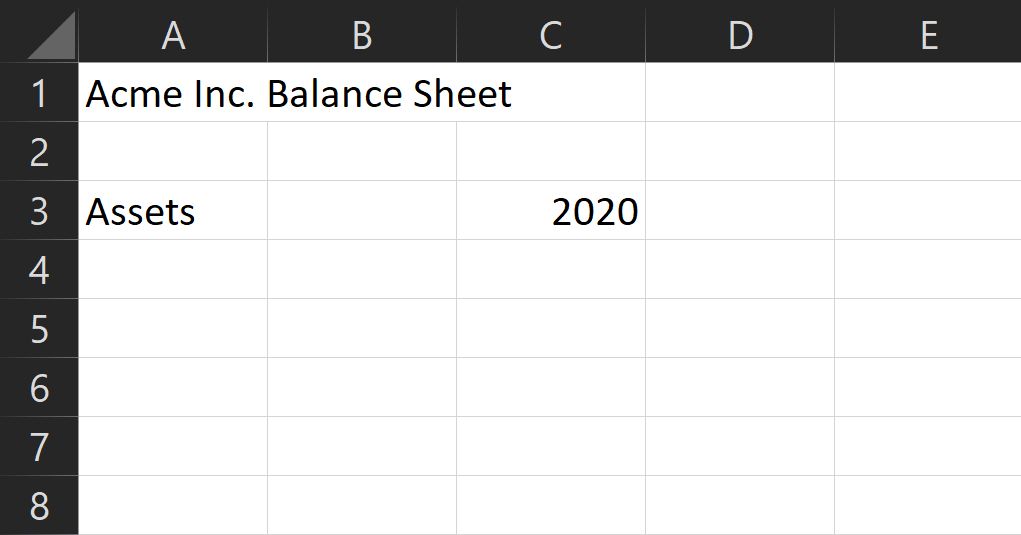
Once you know the period you’re covering and have the values you need, it’s time to create the Excel file. Open up a new file on Microsoft Excel. Put in [Company Name] Balance Sheet at cell A1 for easy identification.
Leave some space for formatting, then on the first column of the third row, write Assets. This is the section where you’ll put in the values for everything your company has. Then on the third column of the same row, write the fiscal year you’re covering.
After Assets, you have to create the corresponding Liabilities and Owner’s Equity section. Liabilities refer to the amount the company owes to third parties, including banks, suppliers, landlords, and the government.
Owner’s Equity, on the other hand, refers to the amount the owners raised for the business, plus any earning it retains in its accounts. These values in these two sections should equal the amount noted under assets—hence the term Balance Sheet.
However, before creating the Liabilities and Owner’s Equity section, you should first place the subcategories for Assets. This way, you’ll have less trouble with formatting.
4. Insert Your Categories
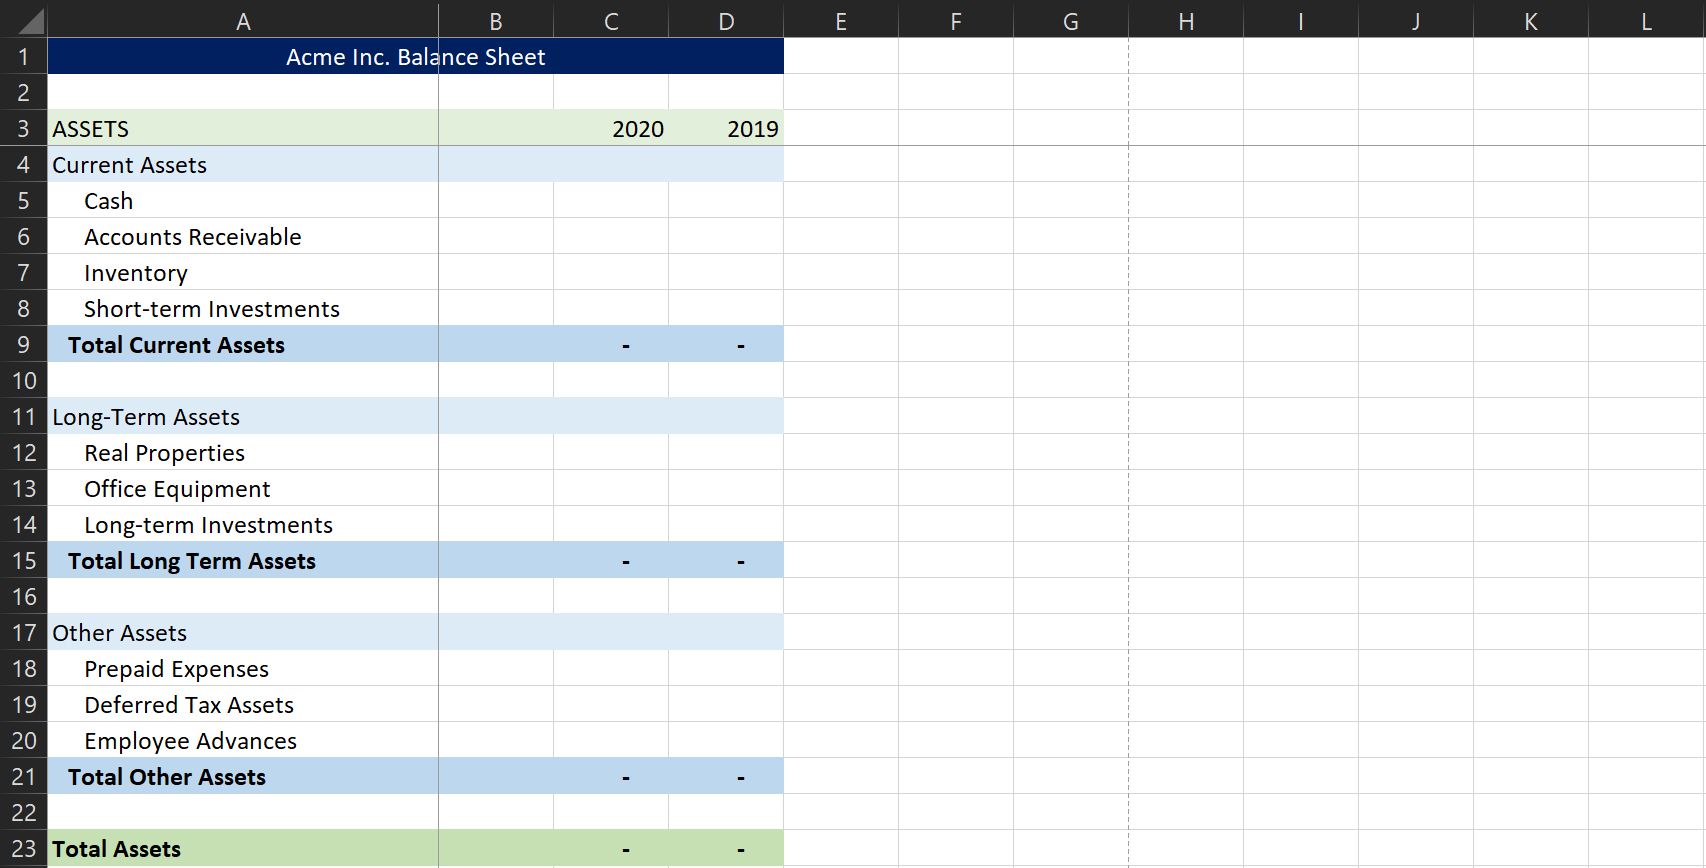
Assets
Each business and industry will have its own unique Asset subcategories. However, these are the typical sections most companies have: Current Assets, Fixed or Long-Term Assets, and Other Assets. These are then further broken down into small categories.
Current Assets are assets you can quickly liquidate. These are typically cash, accounts receivable, inventory, and short-term investments. On the other hand, Fixed or Long-Term Assets are harder to convert into currency. These could be Real Properties, Office Equipment, Long-term investments, and more.
Other Assets are usually minor items that can’t be easily defined under current or long-term assets. These could include Prepaid Expenses (like subscriptions), Deferred Tax Assets (like refunds), and Employee Advances.
While these categories apply to most businesses, your company might have a unique asset category, so you should review your operations before considering this as final.
Liabilities & Owner’s Equity

Similar to Assets, Liabilities & Owner’s Equity has three major subcategories: Current Liabilities, Long-term Liabilities, and Owner’s Equity. As the term suggests, current liabilities are obligations that the company must meet either in one year or in one operating cycle (where one operating cycle refers to the time it takes for inventory to be converted into sales).
Current Liabilities could include accounts payable to suppliers and lessors, short-term loans from banks and creditors, income taxes, payable salaries, prepaid goods and services, and the current portion of long-term debt.
Under Long-term Liabilities, you will find Long-term debt, Deferred income tax, and Pension fund benefits, if required by law.
Lastly, Owner’s Equity consists of Owner’s equity, which is the amount you put in the business. If you’re running a corporation, both this section and its subsection are called Shareholders’ Equity instead.
You will also find Retained earnings under the equity section, which is the amount the business earned in the period less dividends paid out.
5. Adding Your Values
Under Assets, add the values for each subcategory to know how much you have for each section. You then need to add each subtotal to get the total asset value of your company.
Likewise, you should also add the values for each Liability and Owner’s Equity subcategory to find how much of your company’s assets are from creditors, the owners, and earnings.
Take note that the total values for the Assets section and the Liabilities and Owner’s Equity section should match. Otherwise, there might have been an error in your accounting.
6. Some Useful Formulas
You can use the values you find in the balance sheet to look at its financial ratios. These formulas assess your business’s performance and can be used for comparison with other similar companies in the same industry.
Debt Ratio

This is the percentage of the company’s debt measured against its assets. The formula for this is Total Liabilities / Total Assets. If you get a value greater than 100%, that means its debt is greater than all its assets. High-ratios are also at a higher risk of default—but this value varies between industries.
Like real estate and utilities, capital-intensive businesses typically get higher average debt ratio values than service industry-based companies.
Current Ratio

This value shows the capacity of a company to pay its short-term loans with its liquid assets. This is computed by dividing current assets by current liabilities. If the value you get here is below zero, there is a danger a company might default on its short-term loans because of a lack of liquidity.
Working Capital

When you subtract a company’s current liabilities from its current assets, you get working capital. This amount shows how much cash and cash equivalent a company has after paying off its current obligations.
If there is a significant positive difference between the two, the company can easily grow and scale its business. But if it’s near zero, or even negative, then it might have trouble paying its loans and liabilities, or worse, could go bankrupt.
Asset-to-Equity Ratio

The Asset-to-Equity (A/E) Ratio is calculated by dividing total owner’s equity by total assets. This formula shows how much the company is funded by the owners versus the amount financed through loans.
A company with a high A/E ratio may indicate that most of its financing came from the owners, meaning it doesn’t have many obligations to pay. On the contrary, a low A/E ratio means that most of its assets came in loans or credits.
If the company has consistent cash flow, a low A/E ratio will have a low impact on its daily operations. However, it leaves it vulnerable to price, interest, and drastic changes, giving them less leeway to react.
Where to Find Balance Sheet Templates
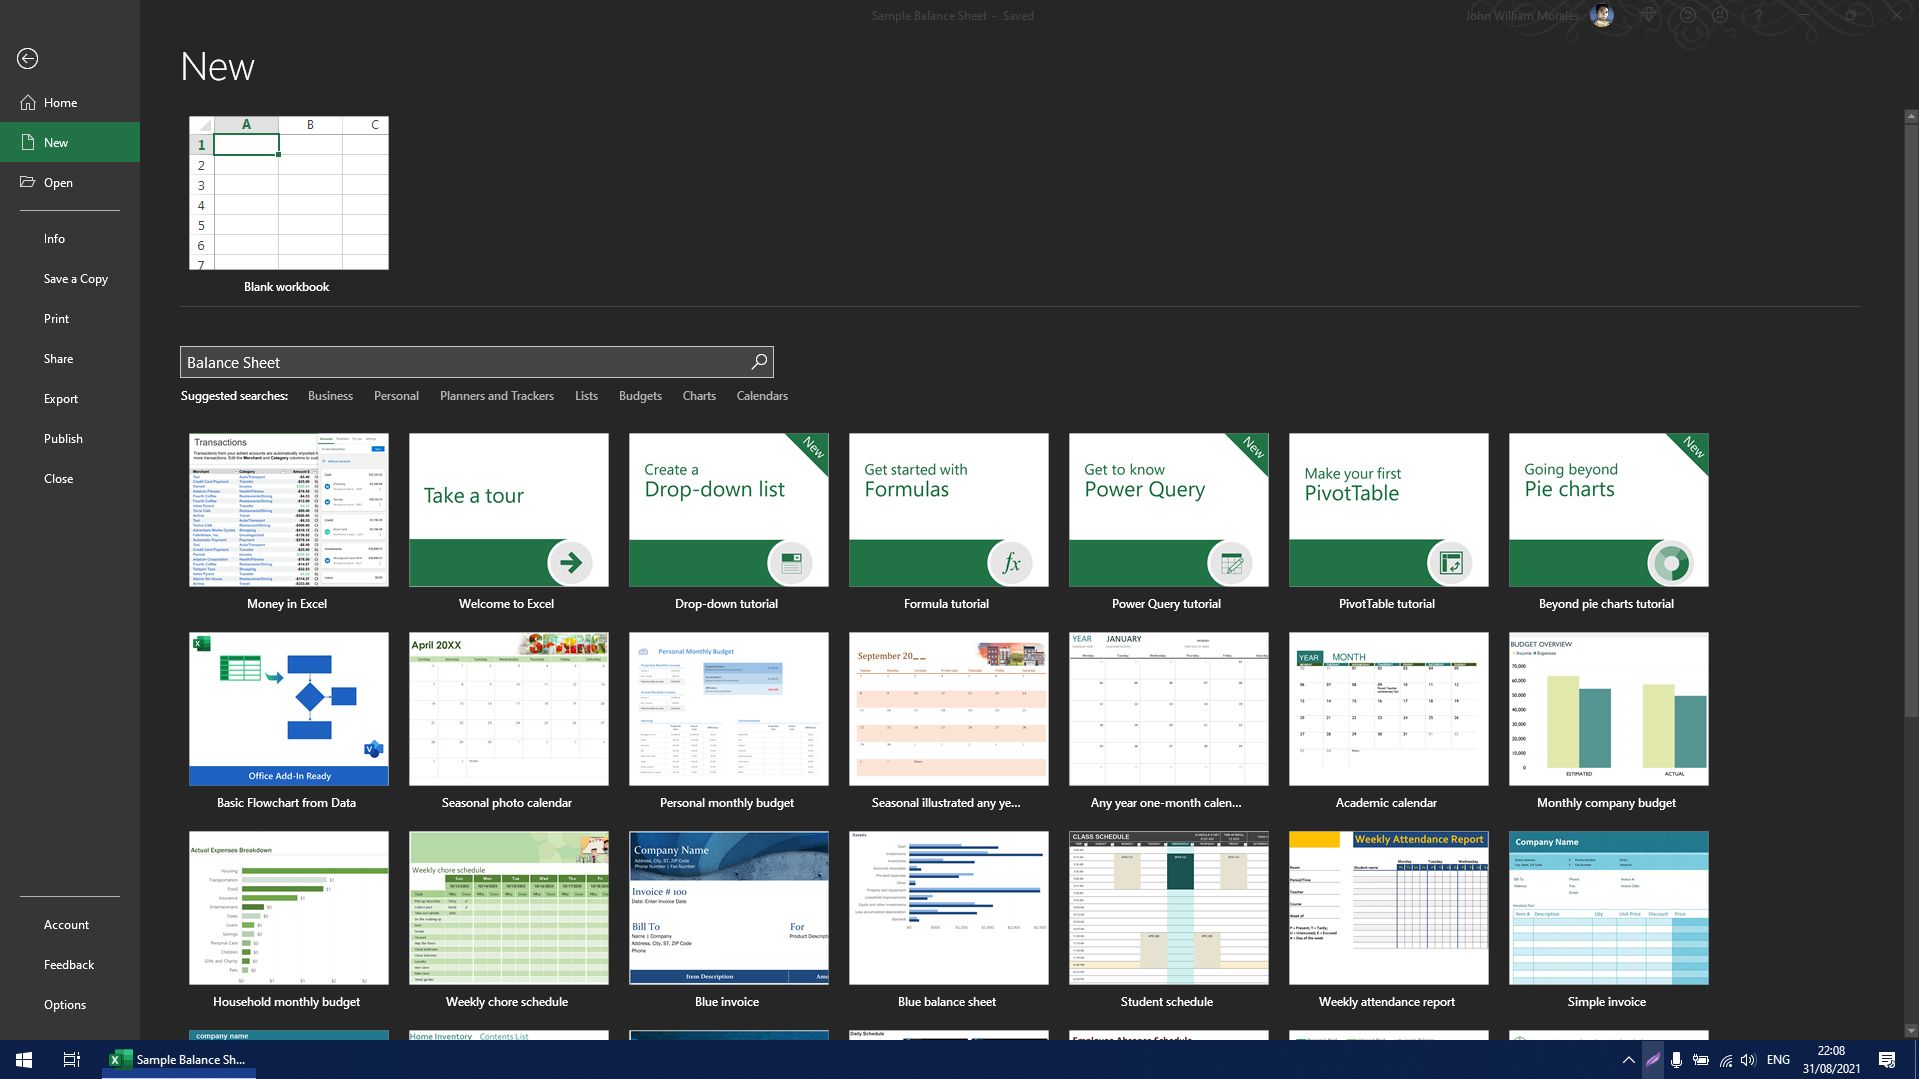
Although you may know now how to create a balance sheet, it’s sometimes better to find a template to follow. You can do that in Excel by clicking on File. Go to the New tab, then in the Search Bar, type Balance Sheet. After a quick search, Excel will give you at least three templates you can use.
Alternatively, you can also visit Vertex42, FreshBooks, or Wise.com to download a template from their website.
Keep Track of Your Business
Whatever business you have, you should keep track of how it’s going. That way, you’re not going in blindly and making decisions without numbers to back you up. After all, a good entrepreneur should know their business like the back of their hand.
A Balance Sheet, Income Statement, and Cash Flow document are just some of the essential documents you need to monitor your finances. But once your business grows and finances become complicated, hire a professional bookkeeper to ensure you get all your numbers right.
Balance Sheet Formula (Table of Contents)
- Balance Sheet Formula
- Examples of Balance Sheet Formula (With Excel Template)
- Balance Sheet Formula Calculator
Balance Sheet Formula
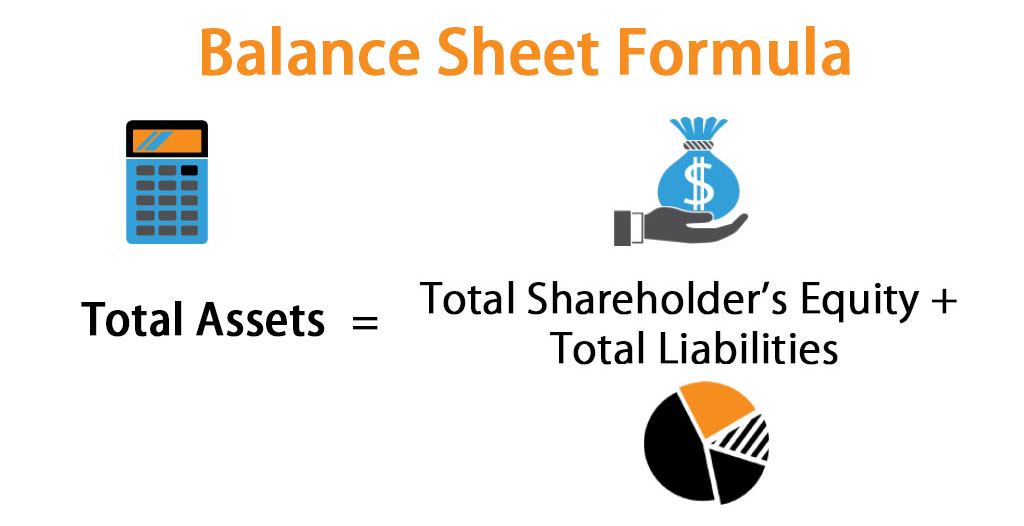
The balance sheet formula is the accounting equation and it is the fundamental and most basic part of the accounting. The balance sheet will form the building blocks for the whole double entry accounting system. The balance sheet formula will look like:
Total Assets = Total Shareholder’s Equity + Total Liabilities
Examples of Balance Sheet Formula (With Excel Template)
Let’s take an example to understand the calculation of Balance Sheet formula in a better manner.
You can download this Balance Sheet Formula Excel Template here – Balance Sheet Formula Excel Template
Balance Sheet Formula – Example #1
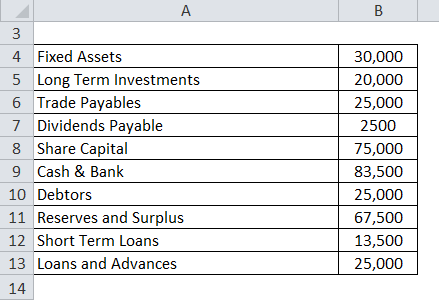
Let’s try to prepare Balance Sheet with a simple example. Following are the extracts and information available from ABC Ltd.
Solution:
Total Shareholder’s Equity is Calculated as:
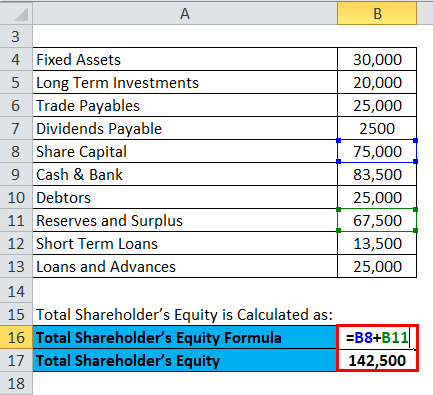
- Shareholder’s Equity = 75,000 + 67,500
- Shareholder’s Equity = 142,500
Total Liabilities is Calculated as:
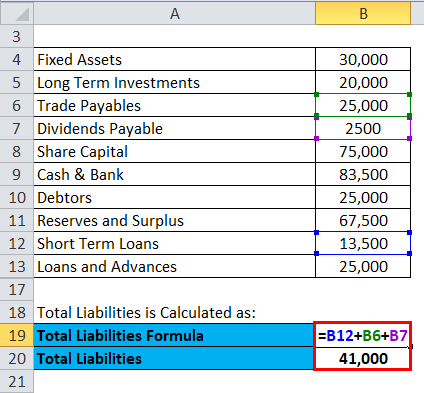
- Total Liabilities = 13,500 + 25,000 + 2,500
- Total Liabilities = 41,000
Sum of Total Shareholder’s Equity and Total Liabilities:
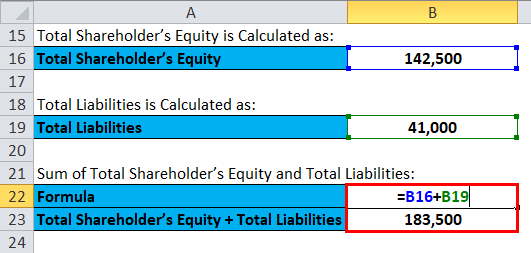
- Shareholder’s Equity + Total Liabilities = 142,500 + 41,000
- Shareholder’s Equity + Total Liabilities = 183,500
Total Assets is calculated as:
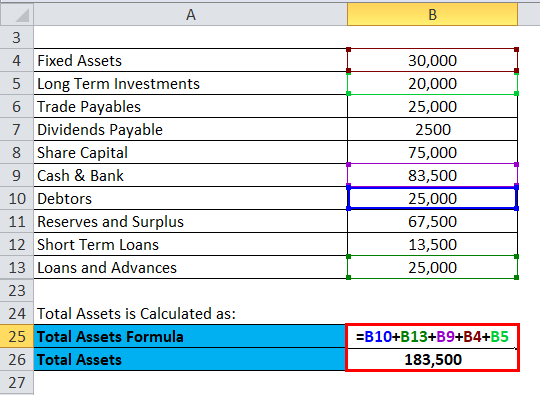
- Total Assets = 25,000 + 25,000 + 83,500 + 30,000 + 20,000
- Total Assets = 183,500
So, now we can see that the balance sheet equation says which is Total assets = Total Liabilities + Total equity’s shareholders and in this case, it is 183,500.
Balance Sheet:
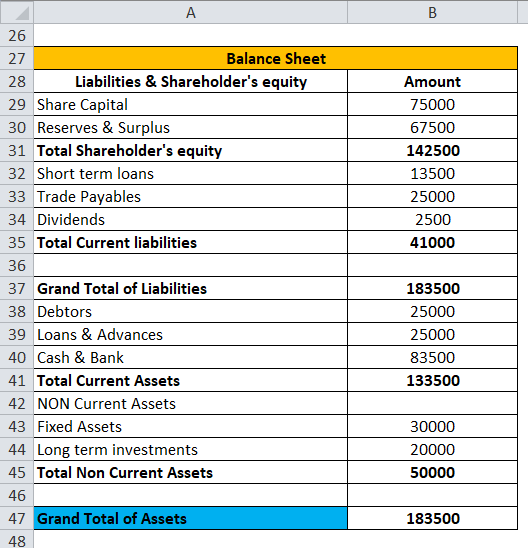
Now in the above given balance sheet, we have calculated Grand total of assets using total current assets and total non-current assets.
Balance Sheet Formula – Example #2
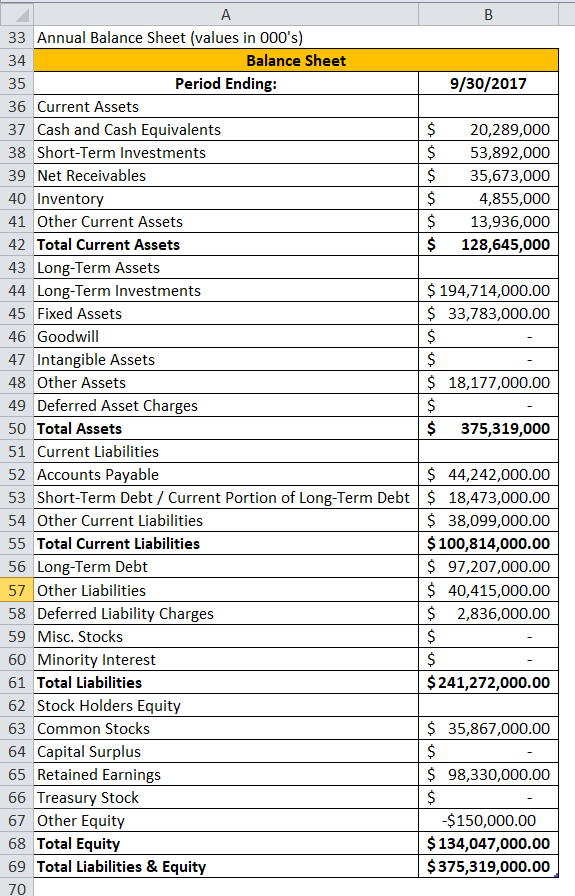
Below extract from Apple Inc. financial statements (annual report) as of 09/30/2017
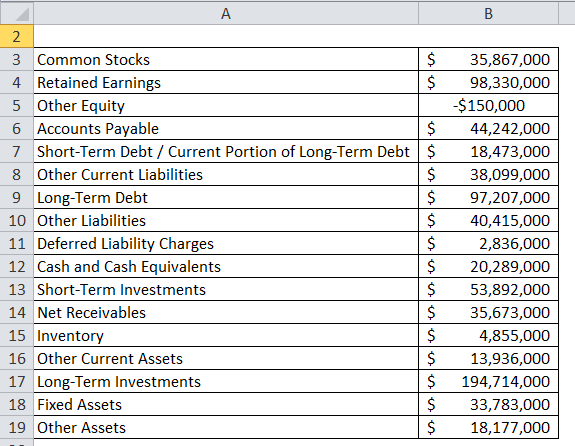
Solution:
Total Shareholder’s Equity is Calculated as:
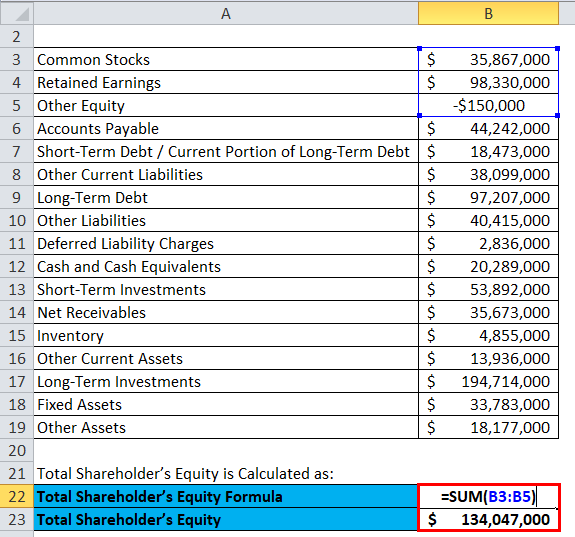
- Total Shareholder’s Equity = 3,58,67,000 + 9,83,30,000 – 1,50,000
- Total Shareholder’s Equity = 13,40,47,000
Total Liabilities is Calculated as:
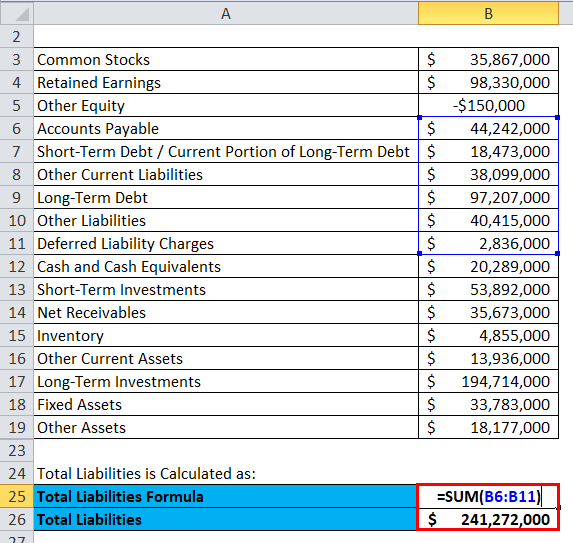
- Total Liabilities = 4,42,42,000 + 1,84,73,000 + 3,80,99,000 + 9,72,07,000 + 4,04,15,000 + 28,36,000
- Total Liabilities = 24,12,72,000
Sum of Total Shareholder’s Equity and Total Liabilities:
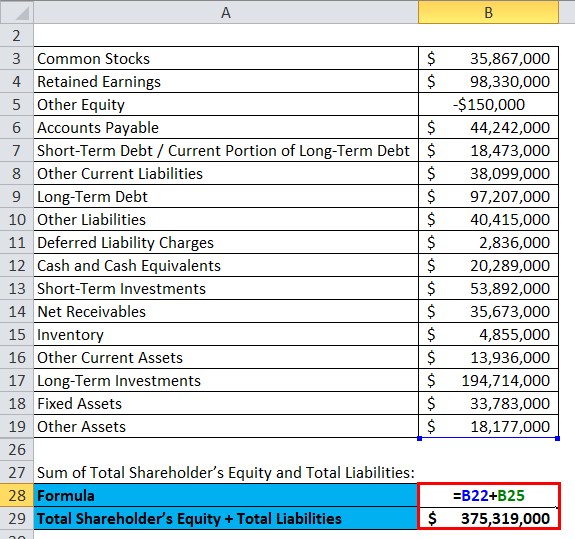
- Shareholder’s Equity + Total Liabilities = 13,40,47,000 + 24,12,72,000
- Shareholder’s Equity + Total Liabilities = 37,53,19,000
Total Assets is calculated as:
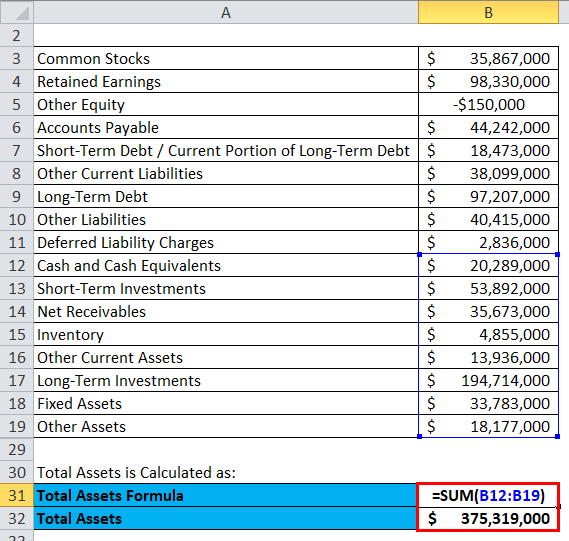
- Total Assets = 2,02,89,000 + 5,38,92,000 + 3,56,73,000 + 48,55,000 + 1,39,36,000 + 19,47,14,000 + 3,37,83,000 + 1,81,77,000
- Total Assets = 37,53,19,000
Balance Sheet:
Balance Sheet Formula – Example #3
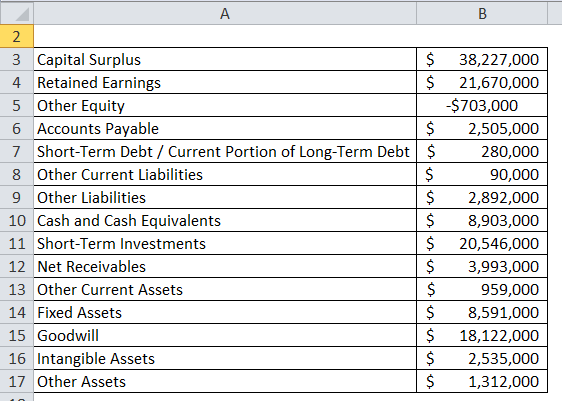
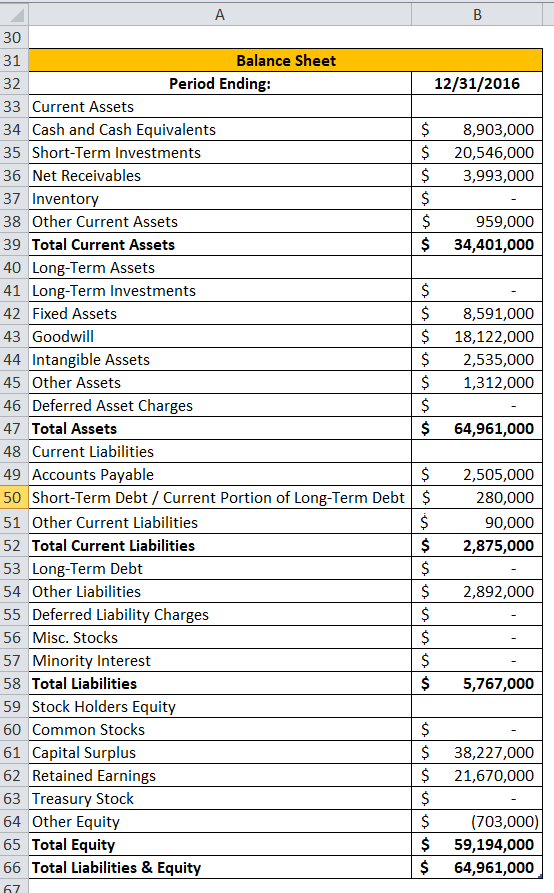
Below are extracts from Facebook financial statements (annual report) as of 09/30/2017
Solution:
Total Shareholder’s Equity is Calculated as:
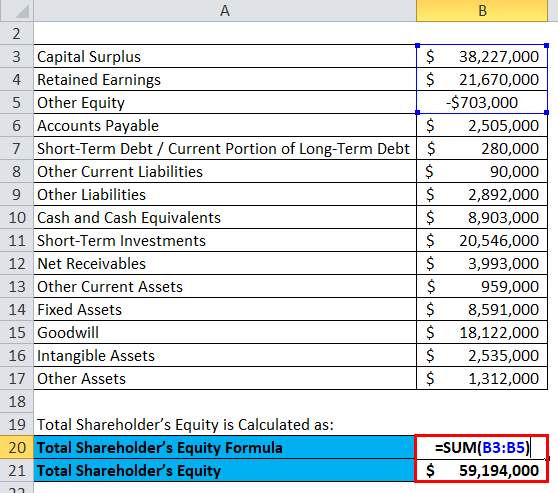
- Shareholder’s Equity = 3,82,27,000 + 2,16,70,000 – 7,03,000
- Shareholder’s Equity = 5,91,94,000
Total Liabilities is Calculated as:
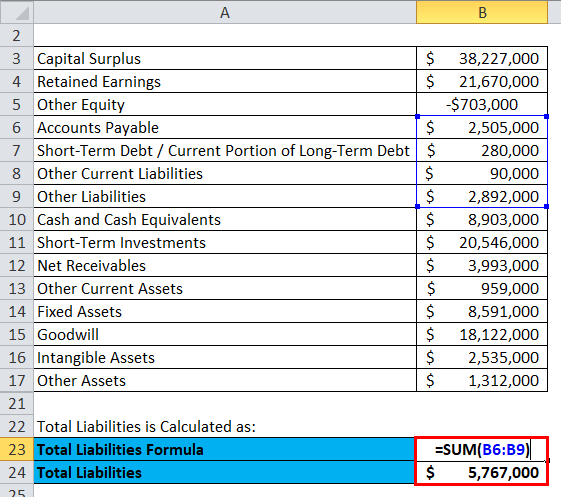
- Total Liabilities = 25,05,000 + 2,80,000 + 90,000 +28,92,000
- Total Liabilities = 57,67,000
Sum of Total Shareholder’s Equity and Total Liabilities:
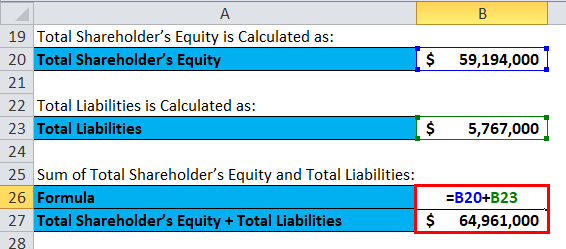
- Shareholder’s Equity + Total Liabilities = 5,91,94,000 + 57,67,000
- Shareholder’s Equity + Total Liabilities = 6,49,61,000
Total Assets is calculated as:
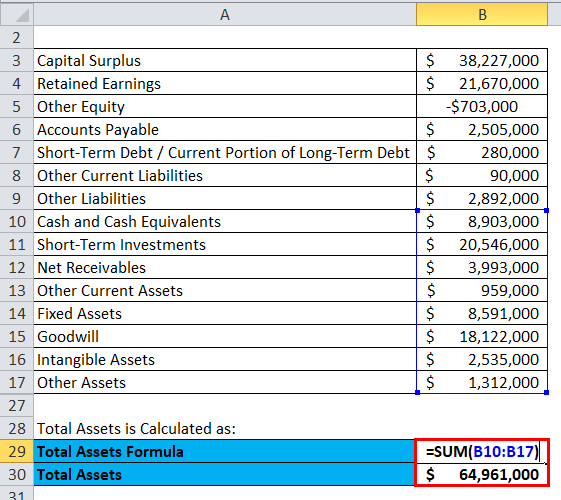
- Total Assets = 89,03,000 + 2,05,46,000 + 39,93,000 + 9,59,000 + 85,91,000 + 1,81,22,000 + 25,35,000 + 13,12,000
- Total Assets = 6,49,61,000
Balance Sheet:
Explanation of the Balance Sheet formula
In its most simple form, the balance sheet formula will try to depict what a company will own, what a company will owe and what stake the shareholders, or the owners have in the company’s business. The equation if one notice then one can conclude that it will start off with the company assets which are the resources of the company and the same has to be used in the near future like the accounts receivable, cash, and fixed assets.
Relevance and Uses of Balance Sheet Formula
Most of the cases, the company will not own its assets outright. For example, it might have borrowed a loan and same be pending on the mortgage on the building, company car, or even it might owe money to its owners or the shareholders. That is the reason the second part of the balance sheet formula is made up of the claims on assets of the company. All these claims on the assets of the company can be separated into 2 broad categories: equity and liabilities.
Liabilities are the claims on the assets of the company by the people or the other firms. A mortgaged or the bank loan is a good example. The bank will have a claim to the company’s land or the building which is mortgaged. Liabilities, on the other hand, are usually presented before equity in the balance sheet formula because the liabilities should be repaid before the shareholder’s or the owners’ claims.
Equity on another hand is the owner’s or the shareholders’ claims on the assets of the company. This will be the amount of money which the owners or the shareholders have contributed to the company for earning an ownership stake. Equity will also include retained earnings. Once all the claims by outside the companies and claims by the owners or the shareholders are summed up, then they will always equal the total assets of the company.
Balance Sheet Formula Calculator
You can use the following Balance Sheet Calculator.
| Total Shareholder’s Equity | |
| Total Liabilities | |
| Total Assets Formula = | |
| Total Assets Formula = | Total Shareholder’s Equity + Total Liabilities | |
| 0 + 0 = | 0 |
Recommended Articles
This has been a guide to Balance Sheet formula. Here we discuss How to Calculate Balance Sheet along with practical examples. We also provide a Balance Sheet Calculator with downloadable excel template. You may also look at the following articles to learn more –
- Consumer Surplus Formula
- How to Calculate Net Income?
- Calculate Asset to Sales Ratio Using Formula
- Cost of Equity Formula
- Trial Balance vs Balance Sheet | Top Differences
- Guide to Asset to Sales Ratio
- Different Types of Balance Sheet Ratios
A balance sheet is commonly called a “snapshot of a company’s financial condition”. It is a statement of the company regarding its financial position or its net worth or in simpler words a statement regarding the company’s spending and earning. There are three important financial statements in a company namely income statement, cash flow statement, and balance sheet. It is expected to carry details regarding the company’s assets, liabilities, and owner/shareholder’s equity; but there might be additions to this, depending upon the need and want of the business. A standard company balance sheet generally has two main heads:
1. Assets (what the company own)
2. Liabilities (what the company owe)
Assets = Liabilities + Equity
The above two heads must be an equal ratio for a balance sheet to be ideal otherwise it depicts that the company’s financial position is unstable which might even lead the company into bankruptcy. The ‘equity’ which we see above in the equation, is the amount or the money which the company owes to its shareholders. The difference between the assets and the liabilities is known as ‘equity’ or ‘net worth’ or ‘capital’ of a company. According to the accounting equation, net worth must equal assets minus liabilities.
Balance Sheets are usually calculated after every quarter, six months, one year, or one for each business transaction. A balance sheet sometimes may also carry details from the last year along with the current year, which makes the comparison between two consecutive years easier, it is called a comparative balance sheet.
Let’s dwell a little upon what are the three main things that form the equation of a balance sheet:
1. Asset – These are the things or resources which the company owns. There are two kinds of assets the first one is ‘current asset’ and the other one is ‘non-current asset’.
- Current Assets: – These are also known as liquid assets with a lifespan of one year or less. They can be liquidated and turned into cash easily. Current assets include cash, accounts receivable (the amount owed to your company by customers), inventory (company’s work in progress), and prepaid expenses.
- Non-current Assets: – These are non-liquid assets with a longer lifespan than a year. They cannot be liquidated easily and converted into cash. These are the company’s long-term investments such as property, equipment, vehicles, etc. Non-current assets might also include intangible assets such as patents, contract, copyright, and goodwill
1. Liabilities– These are the obligations or the duties the company owes to the outside parties (e.g. customers and creditors). They are also divided into two categories, one is ‘current liability’ and the second one is ‘non-current liabilities’ or ‘long-term liability’.
- Current Liabilities: – these are the obligations that the company has to discharge within a term of one year. They might include the debts which are due within one year, such as account payable, short-term loans, current portion of long-term loans, taxes payable, wages, rents (of building and equipment), utilities, etc.
- Long-term Liabilities: – these are the obligations or the long-term debts of the company which is to be discharged after a term of one year. Long-term liabilities may include deferred income tax (tax due on the increase in value of an investment), bank debts, principal on bonds, and any pension fund liabilities.
2. Equity- when liabilities are deducted from the total assets, equity is all that is left. When the company is a sole proprietor “owner’s equity” is used in the balance sheet and when the company is a corporation “shareholder’s equity” is used. It is also called the book value of the company. Equity includes capital stock (the amount invested by the owner or the inverters/shareholders) and the retained earnings (money used to pay the debts or reinvest in the business for the growth and expansion purpose). We can say that equity is a residual of the company after subtracting the liabilities from its assets.
Balance Sheet an Essential for Business Today
New investors and creditors before investing in a business sure would like to know about the profit and loss ratio of the company. No one would willingly invest in a business that is performing poorly or which might soon end up bankrupt. The point being made is that a prudent man would analyze a company/business’s financial position before investing in it and this is where the balance sheet comes handy. Financial stability and business performance are assessed through balance sheets by the investors and to infer as to how efficiently the company can use its resources and assess the value of their investments.
Just as much as the balance sheet is important to the outside investors, it is equally essential for the smooth running of the business. It helps the business to keep a track of their finances so that they know the areas which need attention, to know the best ways to meet their financial obligations, and to decide whether the business needs additional debts/loans or not. Balance sheets are also required because it is only through these documents that the bank ascertains if you are qualified for the loan or not.
Balance sheets can be used to track the company’s growth or downfall, whichever is the case. By comparing balance sheets of different years one can understand the growth or fall of the entity. It helps the company to meet the unforeseen expenses. Preparing balance sheets is optional for sole proprietorships and partnerships, which is not the case with companies. Nevertheless, a balance sheet is useful for monitoring the health of the business.
Balance Sheet for Excel Format
There are different types of balance sheet formats today. Common formats are the vertical balance sheet and horizontal balance sheet, but there are other formats as well, such as classified, common size, or comparative balance sheets. It is up to the companies or the individuals to select the format which best suits their taste or which they find easier to read and manage.
1. Horizontal balance sheet: in these two tables are formed. The assets appear on the left-hand side and liability plus equity appears on the right-hand side.
2. Vertical balance sheet: in this format, again there are two tables but they are one underneath another. The assets are listed in the first list and under the list of assets there is liabilities plus equity list.
The advantage of creating a balance sheet in excel is that it provides formulas and readymade tables which not only saves labour but reduces the risk of calculation mistakes as well. In an Excel spreadsheet, there are endless rows and columns which can be selected as per the users need (depending upon the choice of format). And each row or column contains cells, here we can enter our data along with the formula and in seconds we will get the desired result we need.
Excel Spreadsheet provides its users with a template balance sheet that can be used in small businesses for accounting purposes. There are endless rows and columns in an excel spreadsheet. The first thing you have to do is decide whether you want to formulate a vertical balance sheet or a horizontal balance sheet or a comparative balance sheet or any other. Once decided then the next step is to select columns and label them accordingly. There are generally two lists (assets and liabilities) in a balance sheet that contain two columns each, irrespective of the format. The asset’s list will carry the names of the assets of the company in the first column and side by side the figures or the value of those assets in the second column. The list of liabilities is also prepared similarly. One can also insert additional columns and rows in the balance sheet if they wish to.
| Assets | Liabilities | ||||
| Current Assets | Current Liabilities | ||||
| 1. | Cash | 5000 | 1. | Bank drafts | 500 |
| 2. | Inventory | 3000 | 2. | Accounts payable | 1000 |
| 3. | Accounts receivable | 2000 | |||
| Total Current Assets | =10000 | Total Current Liabilities | =1500 | ||
| Fixed Assets | Long-term Liabilities | ||||
| 1. | Land and buildings | 13000 | 1. | Mortgage | 9000 |
| 2. | Equipment | 6000 | 2. | Long-term loans | 2000 |
| Total Fixed Assets | =19000 | Total Long-term Liabilities | =11000 | ||
| Total Liabilities | =12500 | ||||
| Capital | |||||
| 1. | Shares | 10000 | |||
| 2. | Retained earnings | 6500 | |||
| Total Capital | =16500 | ||||
| TOTAL ASSETS | =29000 | TOTAL LIABILITIES AND CAPITAL | =29000 |
“Horizontal Balance Sheet Format”
To create an excel balance sheet, one has to be acquainted with the basic functions or formulas involved in its creation. There are generally three formulas involved which go into the making of an excel balance sheet viz, ‘Excel Addition Formula’, ‘Excel Subtraction Formula’, and ‘Sum Function’. We can better understand these with the help of illustrations.
For instance, we want to enter the total value of the company’s land property in one cell and there are three properties, for that we will use the Excel addition formula. Type = followed by the value of first property + second land property + third land property and the cell will show the total sum of all.
| A | B | |
| 1 | =2000+3000+6000 | |
| 2 |
And if the values are already mentioned in the spreadsheet then cell reference can be used instead of entering numbers in the cells.
| A | B | |
| 1 | =B1+B2+B3 | 2000 |
| 2 | 3000 | |
| 3 | 6000 |
Similarly, the difference can be calculated by the excel subtraction formula by replacing + operator to – operator, in the formula. This formula is used when we have to calculate owner/shareholder’s equity, or when we have to find the difference between two figures in a balance sheet.
| A | B | |
| =2000-3000-6000 | ||
| 2. | ||
| 3. |
Or
| A | B | |
| 1. | =B1-B2-B3 | 2000 |
| 2. | 3000 | |
| 3. | 6000 |
The sum function in excel is used when we wish to perform additions without using the + operator. Instead of using =2000+3000+6000, you can use =SUM followed by the reference to two or more of the cell numbers in brackets.
| A | B | |
| 1. | =SUM(B1,B2,B3) | 2000 |
| 2. | 3000 | |
| 3. | 6000 |
A cell reference is a much quicker way of getting the calculations done especially when big figures are involved.
Concluding Remark
Large to small businesses, public to private companies, sole proprietors, partnership firms, and even individuals (for personal use) recognize balance sheets as an essential tool to keep track of the financial spending and earnings. Excel balance sheets templates help them even further by reducing the workload and by proving to be efficient time-wise.
- Companies, both public and private, are required to keep the profit and loss statement and balance sheets according to the 2017’s Amendment to the Companies Act 2013. The format is provided by the legislature of India according to which both these financial statements are to be prepared; these are contained in the new Schedule III.
- Sole proprietors and partnership firms are not required by law to maintain balance sheets but it is only wise to keep one. Even though it is optional, most of the firms and sole proprietors hire accountants to keep regular track of their balance sheets along with other important financial statements.
- Individuals maintain balance sheets mostly as a part of self-discipline. A balance sheet helps in organizing the expenses and let the person know how much he can spend on one particular head of items or what are his assets and liabilities. It is popularly said that a good habit goes a long way, and a person who keeps up with his financial health is less likely to go broke at the end of each month.