
-
12-27-2020, 12:11 AM
#1

Forum Contributor
Balance Sheet Not Balanacing
Hello
This may not be the right place for this (the right forum that is) but i have had such luck in the past getting unstuck with some issues and while this one is embarrassing, I am hoping there is someone with Excel and accounting experience to help me unravel the thing.
I have had this file for years. I am just now opening it up and looking to get the statements published for a funding round. When i made a ton of adjustments to the workbook to make it more in line with the new model, the balance sheet stopped balancing and for the life of me I can not figure out why.
If anyone can check the workflow on the attached statements to see if there is a way to get the balance sheet check some to $0, that would be great. This feels like a «Monday Detail» that I am not seeing, but I am working this file in the wee hours of the morning lately.
I am hoping to wrap this up by year-end for a scheduled launch on a crowdfunding platform.
original posting: https://www.accountantforums.com/thr…lanced.169616/
Thanks in advance.
-
12-27-2020, 09:19 AM
#2
Re: Balance Sheet Not Balanacing
What did you change? Where has it ‘stopped working’? Please be very specific, directing us to certain cells where you have problems and telling us what results (values) you’d expect to see there.
Ali
Enthusiastic self-taught user of MS Excel who’s always learning!
Don’t forget to say «thank you» to anyone who has offered you help in your thread. You can reward them by clicking on * Add Reputation below theur user name on the left, if you wish.Forum Rules (updated September 2018): please read them here.
How to use the Power Query code you’ve been given: help here. More about the Power suite here.
-
12-27-2020, 11:53 AM
#3
Re: Balance Sheet Not Balanacing
Please upload the workbook not a zip file. Don’t make us jump through unnecessary hoops.
Richard Buttrey
RIP — d. 06/10/2022
If any of the responses have helped then please consider rating them by clicking the small star icon
below the post.
-
12-27-2020, 08:18 PM
#4
Re: Balance Sheet Not Balanacing
Ada,
Hopefully you have an «audit trail» of the «tons» of cells you added, changed or deleted to restructure the spreadsheets.
The logical thing is to recreate the steps, which will highlight the point at which things went «out of sync». If you can’t resolve that initial error yourself, post the «before and after» section on here and someone will be able to help you with it.
But asking a freelancer to slog through the entire suite of formulae over the Christmas break and correct any anomolies is really something you should be paying a consultant to do, rather than relying on volunteers to do it all for you free of charge when the output will benefit you commercially?Ochimus
-
12-27-2020, 10:08 PM
#5
Re: Balance Sheet Not Balanacing
For year 1, for instance, we have only the Ending balance., with unbalance btw asset and liabilities.
Of course, at begining, it started with zero for every accounts.
If Debit/Credit in pair, un-banlance issue would not happen.
Therefore, check again the General Ledger:
1) Is there any transaction with single A/C ( only debit or only credit) ?
2) If not, is debit A/C or credit A/C registered in Balance sheet?
For instant, when you buy a new truck, the transaction recorded:
Debit «Truck»/ Credit: «Cash»
But, has forgotten to add «Truck» in list of «Properly, Plant & Equipment» group.3) Does the «Retained Earnings» collect «ALL» revenue and cost?
They are main reasons may caused the unbalance issue.
If you could not figure it out, try to up load the general ledger, I will see what I can do.
-
12-28-2020, 03:00 AM
#6
Re: Balance Sheet Not Balanacing
This has now been marked as solved — is it?
-
12-28-2020, 03:10 AM
#7
Re: Balance Sheet Not Balanacing
Ada01, your thread in accountancy forum has no reply so far
Now you get it (though not sure these solutions/advices work or not), but you get it here, in this forum.
Is that real «SOLVED»? Waiting to hear from you.


 below the post.
Balancing Your Balance Sheets
Anyone who has ever juggled an integrated financial model in Excel will have asked this question at some point in their life.
Some of us ask it more often than others (!) but for everyone concerned it’s undoubtedly a headache. The following file provides a few handy hints on how to identify the two main causes of a Balance Sheet not to balancing. Importantly, the file also outlines the key techniques that you can use to locate where the errors are. No more 2am finishes trying to balance your Balance Sheet…
There are two simple approaches:
- If there is a difference in your balance sheet but that amount doesn’t change each period, then there is likely to be an issue with bringing your opening balances (or last historical period amounts) into the outputs.
An item has been omitted from the first period and remains missing for all periods, hence there is no change in the differences amount each period. Temporarily change each Opening Balance Sheet amount one by one — if the difference amount in the outputs changes then that item is part of the reason why your Balance Sheet output doesn’t balance.
-
If the amount of the difference changes each period then the source of the error is located in the heart of the calculations linking into the balance sheet.
This is much more common, and slightly more problematic…
However, the process of finding these errors is similar to the Opening Balance Sheet — enter values to see what impacts on the difference. The difference amount in an unbalanced Balance Sheet is often similar in magnitude to the amounts contained in the Balance Sheet itself. Therefore, when making changes to numbers (per point 2. above) the effect is hard to spot if you change items by similarly sized number.
The secret technique is to enter (temporary) Big Rounded Numbers into your assumptions and calculations as these become far more visible in the Balance Sheet check. See our file via the above link for a worked example of this.
Big Rounded Numbers — Your New Best Friend

Top 10 ways to fix an unbalanced balance sheet
Financial statements are a series of double entries. When we are setting up our Financial Statements, we must make sure we bring in both sides of the double entries to ensure our balance sheet balances. As Isaac Newton’s Third Law states ‘For every action there is an equal and opposite reaction’; to become a balance sheet king you must remember, ‘For every Debit, there is an equal and opposite Credit’
A balance sheet that doesn’t balance is the nemesis of many a modeller. There is nothing more infuriating than needing to deliver a model and just not being able to track down a balance sheet error, especially as the clock ticks away late into the night.
Don’t worry, I have felt the pain. The below are 10 practical steps that have been finely tuned after sleepless nights and 15 accounting exams. This article will hopefully speed up the process of debugging what is causing the imbalance and help avoid this issue reoccurring during your modelling career.
1. Make sure your Balance Sheet check is correct and clearly visible
Making the correct Balance Sheet check may seem obvious however, there are a few things we must ensure:
a) Net assets equals total equity
Starting from the most basic item, we must make sure that we have correctly linked our formula and that we are checking that net assets less total equity is equal to zero.
b) Appropriate rounding
Excel isn’t perfect, despite what we all may think, Excel only stores up to 15 significant figures. When we are building complex financial models, we will use all 15 significant figures. This can cause really small differences in our net asset and equity. However, when decision making, we may only care to the nearest dollar or cent. Using the ROUND function will ensure that our check has the level of tolerance that is material.
c) Check the absolute difference
Rather than checking each period we should create a global check of each period’s deltas. The most efficient way to do this is by summing all the deltas however, we could have an equal and opposite delta. If this occurred the global check would provide a false result. To avoid this error, always calculate the absolute difference.

d) Clearly visible throughout the model
Once we achieve a balance sheet that does balance, we need to make this check visible throughout the model. This should sit on the top ribbon of our spreadsheet, above any freeze panes you have on your calculation sheet. This will ensure that when we make any updates to model, if we cause an imbalance, we can diagnose it straight away.

There are alternative methods to Balance Sheet checks. Many modellers will use a logic check to ensure that the delta between equity and net assets is below a certain tolerance number. This works effectively as a check; however, this method won’t help identify what is causing the imbalance.
2. Check that the correct signs are applied
Once we have created our check, our next step is to make sure income and assets are positive and costs and liabilities are negative. An extremely common mistake is missing a negative sign when incorporating items into financial statements. It is so easy to miss and can be hard to pick up. However, a run through of each line item on your Cashflow, Profit and Loss and Balance Sheet will help you identify these errors and is a super easy win.
3. Ensuring we have linked to the right time period
Two of Mazars’ guiding themes are “Keep it simple” and “Get it right”, this is extremely relevant when setting up financial statements.
To “Keep it simple”, Financial Statements should just be links to calculations within the workbook, we should not be performing calculations within them, otherwise there is a high potential for us to exclude this from another section of the statements.
To “Get it right”, we should ensure that we have consistent timing across all our sheets in the model. This will mean when we are linking on our financial statements, we are linking to the same column on our calculation sheet.
For example, if our calculation timeline starts in Column J, we are linking to Column J on our calculation sheets. By doing this we will avoid any misalignment error.
We can then do a simple check that we avoided any misalignment error for each of the first columns. A quick keyboard shortcut to help this is “Ctrl + `”, which will show formulas (“Ctrl + `” will switch it back to normal)

4. Check the consistency in formulae
A key pillar of almost every modelling best practice is consistency in formulae across the row. If we don’t have that consistency, it’s highly likely that your balance sheet doesn’t balance. A way to check formulae consistency is using Go to Special > Row differences. To do this highlight your financial statements formulae and use the shortcut “Ctrl + ”. This shortcut will highlight the cells in that range that have row inconsistencies. We then suggest colouring those cells in a bright colour to pick them out easily.

From here you then need to identify what is the correct formula to use. Don’t simply copy the formula on the left across, you may have corrected the formula midway across the sheet accidently (I’ve made this mistake before).
5. Check all sums
One of the most common errors when building financial models is missing rows within your summed range. When we insert a row above a sum, the range doesn’t update to include that new row.

A quick run through each of the Balance Sheet’s closing balances and your Financial Statement calculations to make sure you haven’t made this mistake. Check a couple throughout the row as another common error is to update the sum for the first column and not copying it across the row. This can also be done through checking the consistency in formulae as suggested in point 4.
It is also important to check the lines within your Cashflow and Profit and Loss to ensure that these are flowing down to your net cashflow and net profit after tax respectively. It’s very common to miss out a line reference in your Cashflow available for debt service (CFADS) or EBIT.
6. The delta in Balance Sheet checks
The above were the easy wins and hopefully you’ve been able to find your Balance Sheet differences. However, it becomes a little trickier from this point on, as its highly likely that you excluded something within your financial statements. So how do we find something that isn’t there?
This is where we create a second check, commonly known as “Balance sheet check 2”, which calculates the delta between two balance sheet checks.

This will allow us to see patterns in how our Balance Sheet imbalance changes,
which can be more informative than the value of the total imbalance. How then do we diagnose these:
a) Look for an exact match
Firstly, check to see if you have an exact match for difference within your financial statements. If you can find an exact match of the difference with one of the line items in your financial statements, it would suggest that you have only incorporated one side of the double entry
b) Consistently the same difference
This is highly likely to be a constant expense or revenue which is not escalated. An example of what is missing is straight line depreciation.

c) Slowly increasing/decreasing difference
When this is the case, we will need to look at things that are affected by inflation or interest rates. An increasing difference would suggest an item affected by inflation such as the revenue or expense, as these values would increase over time. A decreasing difference would suggest an item affected by interest rates, this is as over time the balance will decrease and thus the associated interest and payments. This is not necessarily always the case but should hopefully generate ideas of where to focus your efforts.

d) Jumps in the difference
This is a due to recurring items that don’t happen every period. Examples of this would be debt repayments or capex spend.

e) Unbalanced for a set period
Look at the time horizon that the balance sheet is imbalanced for, was a certain facility active during this period and no other period, this could be the cause of the difference.

Although this check won’t necessarily give you the exact reason for your balance sheet not balancing this will isolate your search. In addition, hopefully when you see the second check, you’ll start to recognise the numbers that you may be missing. You’ll be surprised how familiar numbers become from across the model. The more balance sheets you debug the more familiar you’ll become with this balance sheet check two.
7. Double and half the Balance Sheet check
This is a classic accounting trick; I was taught this while doing my accounting exams and financial audit. Within point 7 we have talked about identifying the difference using patterns, if we haven’t seen a pattern or a number, we are familiar with, by doubling or halving the difference this may allow us to find it. This will often help find items where we have put the incorrect sign and in which case have done two debits for example.
8. Work from right to left
While trying to debug what’s causing your imbalance, work from right to left. We need to identify the area where your Balance Sheet isn’t balancing and thus towards the end of your forecast there are likely to be less items active, for example debt facilities. This will allow us to refine our search, we can then work back to the start of the forecast, hopefully the items that aren’t active all the way to the end could be the causes of the imbalance.

9. Opening balance testing
When reforecasting of an existing Balance Sheet, it’s very easy to make mistakes and not properly incorporate all items. A way to check where these numbers are properly incorporated is changing the numbers and see what happens to your balance sheet check. When changing numbers in your opening Balance Sheet, the retained earnings should be the balancing number (net assets less share capital).
If you change an item on your opening Balance Sheet and your Balance Sheet delta changes, we know that there is an issue with this item. If there is no movement, it means that the appropriate debits and credits have been incorporated and we can move to the next Balance Sheet item.
10. Check changes period to period of Balance Sheet items
The last chance of resolving your issue, is to go through each item on the balance sheet from period to period (remember working right to left) and checking that the balance sheet movements are reflected in the profit and loss and or the cashflow. This can be quite a time-consuming activity but is a systematic way of ensuring all debits and credits have been correctly incorporated in the financial statements and should lead to you finding the imbalance.
Before your model is good to go
A test you should do before you’re finished is to run through all scenarios. Often in our base case financial model, certain functionality won’t be active for example, a Debt Service Reserve Account (DSRA). In our base case we might not expect to use the DSRA, but it may be required in some downside cases. An easy way to do this would be to include your checks within your scenario table to ensure you can detect balance sheet imbalances in non-active scenarios.
If your balance sheet still doesn’t balance after all these steps, you may benefit from attending one of our training courses. Our full course portfolio can be found here.
|November 21, 2013||Mapping, SUBTOTAL, SUMIFS
Excel Balance Sheet
This post illustrates how to create a financial statement such as a balance sheet with built-in Excel features and functions. Our primary objective is to build a workbook that efficiently pulls values from the trial balance into the balance sheet.
Overview
For the purpose of this post, let’s assume we have a data sheet that contains the source data for the report, we’ll call this data the trial balance. Next, we’ll assume that we need to get the data from the data sheet into the report sheet in an automated way. In order to efficiently retrieve the amounts, or account balances, into the report (balance sheet) we’ll use Excel’s built-in conditional summing function SUMIFS. If you’ve not explored this amazing function, I wrote a blog post that discusses the SUMIFS Function so feel free to check it out if you would like to review the function’s syntax.
Let’s take a look at the data sheet containing the data for the report, our simplified trial balance.

Excel Trial Balance with Account Balances
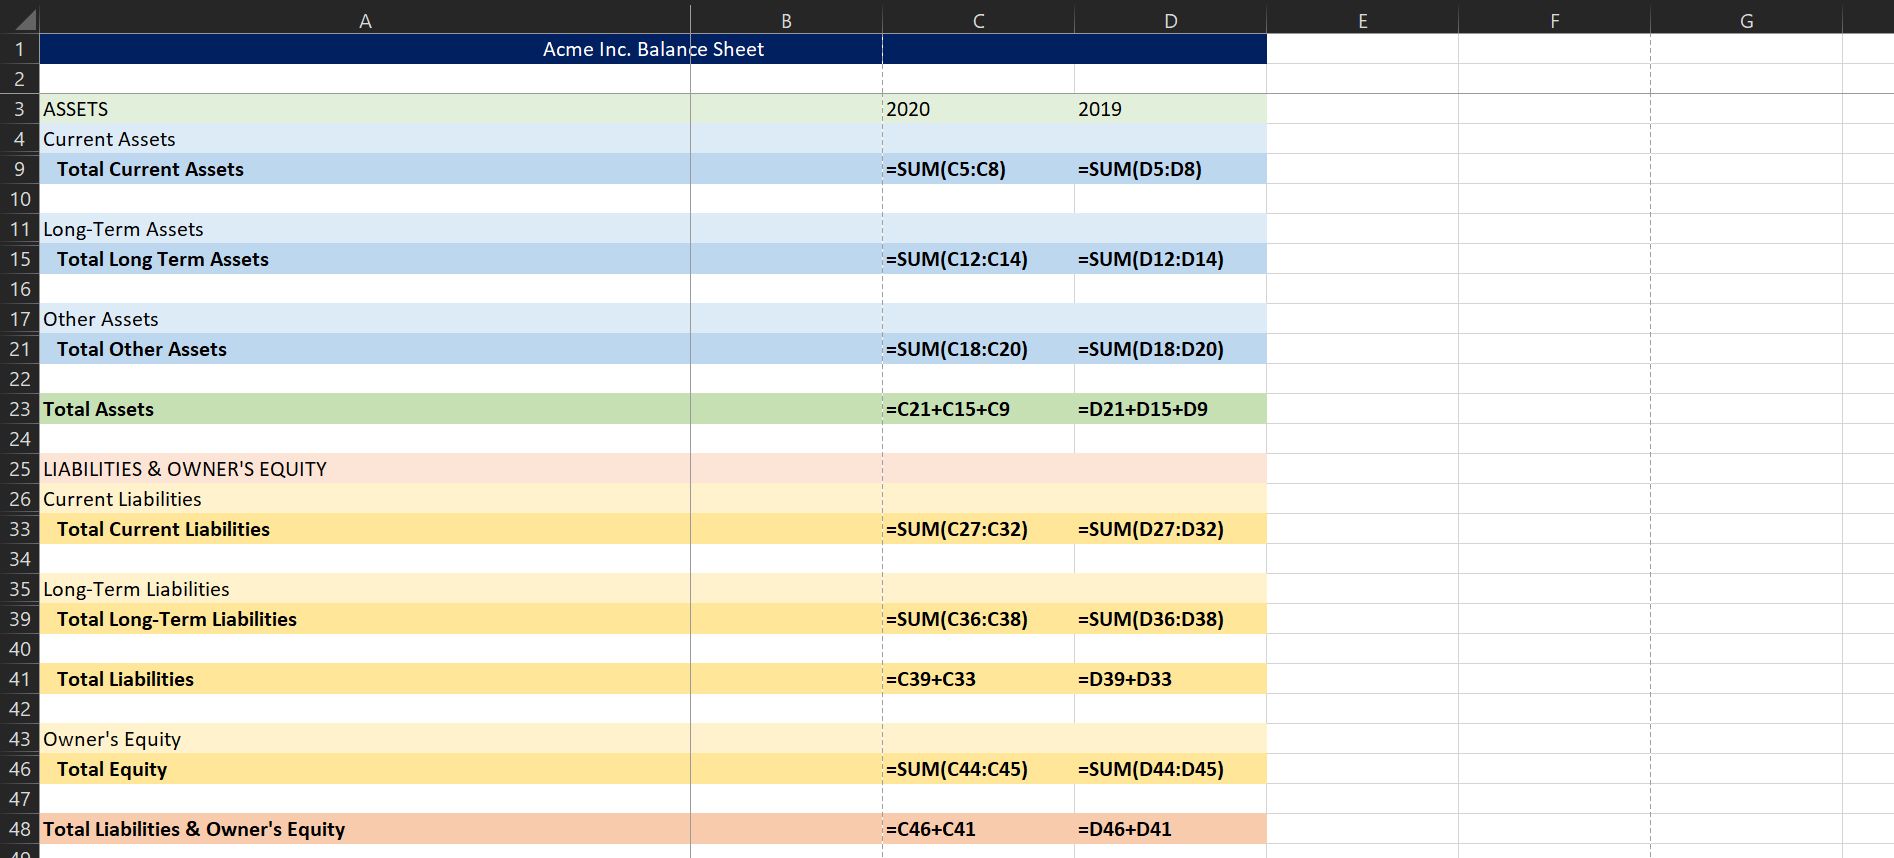
Now, let’s take a look at our desired balance sheet layout.

Excel Balance Sheet structure
One challenge that Excel users face when building a report such as a balance sheet is the fact that the report labels don’t match the data labels. For example, the account name in the trial balance is Checking, but the value needs to be reflected in the balance sheet as Cash. We need to provide Excel with these label translations so that we can use the SUMIFS function to retrieve the correct account balances for each report line.
In the screenshot below, I’ve updated the trial balance and mapped the account names to the financial statement labels.
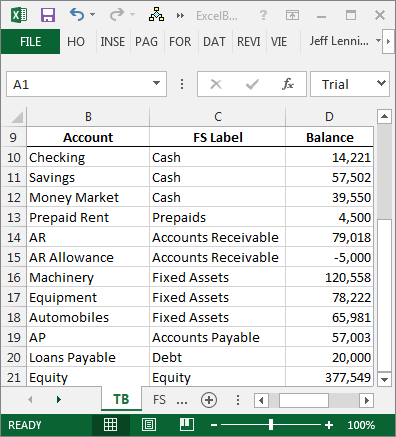
Trial balance with account balances mapped to the financial statement lines
Also note that in some cases, many accounts are mapped to one report line, for example, AR and AR Allowance are both mapped to the Accounts Receivable balance sheet line.
Once we have defined the mapping, we can easily compute the financial statement values with the SUMIFS function. For example, we could use the following formula in cell C7 in our balance sheet:
=SUMIFS(TB!D:D,TB!C:C,B7)
Where:
- TB!D:D is the sum range, the account balance column on the TB trial balance worksheet
- TB!C:C is the criteria range, the report label column on the TB trial balance worksheet
- B7 is our report label
We can fill the formula throughout the report to complete the balance sheet. The completed report is shown below.
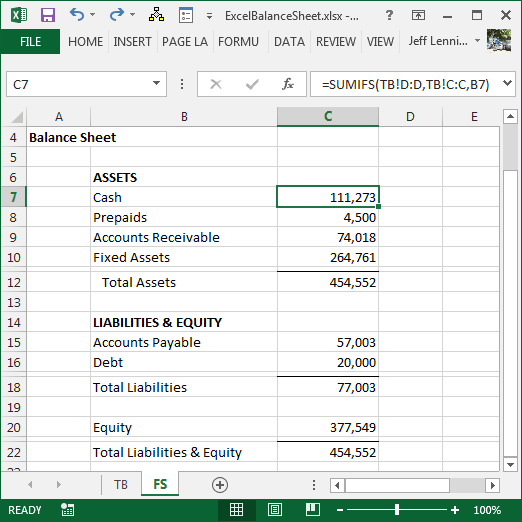
Excel Balance Sheet with amount formulas
And there you have it!
Note: for recurring-use workbooks, you can set up the mapping in a dedicated worksheet and then use lookup functions to retrieve the report labels into the trial balance, or conversely, use SUMIFS to retrieve the trial balance values into the map itself.
Additional Considerations
In addition to achieving the key objective, which was to automatically group and pull account balances into the balance sheet, here are a few finer points to consider when building recurring-use reporting workbooks.
- Build dynamic formula-based report headers
- Indent with the indent command, not with leading spaces or into a new column
- Use an error check sheet to ensure all data from the trial balance made it to the balance sheet
- Use a start here sheet to store global settings
- Use the SUBTOTAL function rather than SUM to compute the balance sheet totals
- Use skinny rows between the last data row and the formula row
Notes
- If you have not played with the SUBTOTAL function before, please enroll into the FREE Better Summing online course so you can learn the details of this marvelous function!
- The SUBTOTAL function and skinny rows were covered in Excel University Volume 1.
- Additional post concepts including mapping tables, dynamic headers, errorck, start here, and indentation, are derived from Excel University Volume 2. For more information or details, please feel free to pick up a copy of the book or enroll into the online course.
Conclusion
Feel free to download the file that was used to create the screenshots above, which includes the formulas, and remember, Excel rules!
ExcelBalanceSheet
The balance sheet is a very important financial statement that summarizes a company’s assets (what it owns) and liabilities (what it owes). A balance sheet is used to gain insight into the financial strength of a company. You can also see how the company resources are distributed and compare the information with similar companies.
Advertisement
No balance sheet statement is complete (in my opinion) without an income statement to go along with it. As a small business owner, I find the income statement to be more useful in the general operation of the business, but the balance sheet is still a critical accounting tool that provides a key piece of information.
The balance sheet informs company owners about the net worth of the company at a specific point in time. This is done by subtracting the total liabilities from the total assets to calculate the owner’s equity, also known as shareholder’s equity (for corporations) or simply the net worth.

Download
⤓ Excel
For: Excel 2007 or later & Excel for iPad/iPhone
⤓ Google Sheets
Other Versions
Template Details
License: Private Use (not for distribution or resale)
«No installation, no macros — just a simple spreadsheet» — by
Description
Download our free Balance Sheet template, designed for the small-business owner. It includes common financial ratios and works well for a two-year comparison. See below for more information on the different asset and liability categories.
Balance Sheet Essentials
The Accounting Equation: Assets = Liabilities + Owner’s Equity
Current Assets
The term current in a balance sheet generally means «short-term» which is usually one year or less. Common current assets includes cash (cash, coin, balances in checking and savings accounts), accounts receivable (amounts owed to your business by your customers usually within 10-60 days), inventory (goods for sale), and prepaid expenses (e.g. insurance and rent).
Long-Term Assets
These assets include long-term investments, cost of property and equipment (e.g. land, buildings, equipment, tools, furniture, computers, vehicles, etc.) offset by accumulated depreciation, intangible assets (e.g. patents, contracts, trademarks, copyrights, and goodwill), and other assets (like deferred income tax arising from the loss of value of property that cannot be reported as a tax deduction until the property is sold).
Current Liabilities
These include the obligations to be paid within one year, including accounts payable, short-term loans, income taxes payable, wages, unearned revenue (e.g. service contracts), and the current portion of long-term debt (e.g. mortgage payments payable within 12 months).
Long-Term Liabilities
These include long-term debt (e.g. notes, mortgages), capital lease obligations (e.g. leases structured as loans), and deferred income tax (e.g. the tax due on the increase in value of an investment security that isn’t paid until the security is sold).
Owner’s Equity (or Stockholders’ Equity for corporations)
This is basically the amount left over when you subtract Total Liabilities from Total Assets. In includes the owner’s investment(s) and retained earnings (the portion of the profits reinvested in the business). For corporations, there are usually more categories (see the references below).
Balance Sheet References
- Financial Accounting: Reporting and Analysis by M.A. Diamond, E. K. Slice, and J.D. Slice., 2000.
- Balance Sheet, Fixed Assets, Intangible Assets, Deferred Tax, Shareholders’ Equity at wikipedia.org
Disclaimer: This balance sheet spreadsheet and the information on this page is for illustrative and educational purposes only. We do not guarantee the results or the applicability to your financial situation. You should seek the advice of qualified professionals regarding financial decisions.
Balance Sheet Template is a ready-to-use template in Excel, Google Sheets, and OpenOffice that helps you to gain insights into the financial strengths of the company.
Moreover, this Balance sheet template gives you a snapshot of your financial position at a specific time. Usually, the businesses prepare a Balance Sheet quarterly, half-yearly, or yearly.
What Is Balance Sheet?
Balance Sheet is a financial statement of a company. It shows the assets, liabilities, equity capital, total debt, etc. at a given point of time.
In simple terms, a balance sheet shows:
- What your business owns. (Assets)
- What it owes. (Liabilities)
- What money is left for the owner? (Owner’s Equity)
For the balance sheet to reflect the true picture, both heads (liabilities & assets) should tally.
Thus, Assets = Liabilities + Equity.
Components of a Balance Sheet
There are two major components of a balance sheet: Assets and Liabilities.
Assets
Assets are the resources or things that your company owns. It consists of two categories: Current Assets and Long-term Assets. An asset is anything tangible or intangible that you own or hold and has a positive economic value.
Current Assets include the following items:
- Cash
- Accounts Receivable
- Stock/Inventory
- Prepaid Expenses
- Short-Term Investments
Long Term Assets include the following:
- Long-term Investments
- Property, Land, and Equipment. Accumulated Depreciation of all will be deducted from these assets.
- Intangible Assets
Other items include Deferred Income Tax.
Liabilities
Liabilities on are debts or obligations to be paid by a company. It is the amount that the company owes to its creditors.
Liabilities consist of 3 parts: Current Liabilities, Long-term liabilities, and Owner’s Equity.
Current Liabilities include the following:
- Short-term Loans
- Income Taxes Payable
- Accrued Salaries and Wages
- Unearned Revenue
- Current Portion of Long-term Loans
Long-term Liabilities include:
- Long-term Debt/Loans
- Deferred Income Tax
Liabilities include all payments to be made by your company. Therefore, any payable loans, accounts payable, unpaid credit card bills, or unpaid taxes must be included.
Owner’s Equity
Another very important head in the balance sheet is the owner’s equity. Your assets should be equal to total liabilities and owners’ equity.
We use the term Owner’s equity when the company is a sole proprietorship. Shareholder’s equity is used when it is a corporation.
In simple terms, the Owner’s Equity is the claim on the assets of a business. Those Assets which remain after deducting liabilities.
Eventually, Equity includes opening investments, contributions, owner’s capital, or retained earnings.
Thus, Equity = Assets – Liabilities.
Owner’s Equity includes:
- Owner’s Investment
- Retained Earnings
We have created a Balance Sheet Template that summarizes the company’s assets, liabilities, and equity. This will give your lender or investors an idea of the health of the company.
This template can be helpful to Accounts Assistants, Accountants, and Auditors, etc.
Excel Google Sheets Open Office Calc
Click here to Download All Financial Statement Excel Templates for ₹299.
You can also download other templates like Cash Flow Statement, Trial Balance, and Profit and Loss Account.
Let’s discuss the contents of the Balance Sheet Template.
Contents of Balance Sheet Template
This template has 3 sections: Asset, Liabilities, and Owner’s Equity. Owner’s Equity is a part of Liabilities and hence falls under the liabilities section.
Let’s understand what items we will be included in each section.
Asset
Insert the following items:
Cash on hand: All Cash including cash in hand + money in the bank.
Accounts Receivable: Receivable includes the total of your outstanding invoices. This does not include any invoices that are still in “draft” status.
Stock Inventory: Stock Inventory that your company holds for the ultimate purpose of resale. Sold items will not include in the Inventory.
Machinery or Equipment: Any Equipment/tangible items purchased for business usage. This equipment will not be bought for reselling.
Reimbursable expenses: Any reimbursable expenses that are already paid and will be reimbursed by another party.
You can customize the Assets section according to your needs.
Liabilities
Insert the following items:
Accounts Payable: This includes money that you owe to other parties other than loans. An example of this would be any unpaid invoice for any service. It can be advertising, electricity, telephone bills, etc.
Taxes Payable: Unpaid Taxes that you owe the government.
Current Loans Payable: Loans from banks or investment from the investors that you have not paid back yet.
Long Term Loans Payable: The Long-term loans that are yet to be paid.
You can customize the Liabilities section as required.
Owner’s Equity
Insert the following items in the Owner’s Equity.
Owner’s Capital: Capital is the owner’s investment in the company. You need to add the net income earned by the company. Whereas deduct any withdrawals by the owner from it.
Note: The owner’s bank account and the business bank account two are separate entities.
Retained earnings: Net income retained by the corporation and distributed to its owners as dividends.
Important Financial Ratios From Balance Sheet
In the end, we have included some important financial ratios from the Balance Sheet than can be helpful for further analytics:
- Debt Ratio.
- Current Ratio.
- Working Capital.
- Assets to Equity Ratio.
- Debt to Equity Ratio.
Advantages of A Balance Sheet
As the name states, it keeps business things in balance. As per the accounting rule, the total assets must be equal to liabilities and equity. Hence, if they don’t balance there is a mistake in the accounting process.
A balance sheet helps in calculating and analyzing financial ratios. Moreover, these ratios are helpful in comparing your competitors as well as your company’s financial strengths.
A balance sheet is also helpful in getting credit from financial institutes. Furthermore, seeing a balance sheet, n investor can make a decision for investment.
Limitation Of A Balance Sheet
Long-term assets are recorded on book value. Whereas, the actual market value is less of those assets. Therefore, these overvalued/undervalued assets distort the company’s wealth.
A balance sheet often misses the internally acquired assets. Furthermore, it also doesn’t take into consideration the assets that cannot be measured in monetary terms. These assets include irreplaceable technical workforce, online sales channels, loyalty, honesty, etc.
Moreover, the balance sheet records some of the assets in estimates that again doesn’t provide the true financial picture of the company.
We thank our readers for liking, sharing, and following us on different social media platforms, especially Facebook.
If you have any queries or questions, share them in the comments below. We will be more than happy to help you.
Frequently Asked Questions
How do you create a balance sheet?
You need to follow these 5 step process to prepare a balance sheet:
- Determine the reporting date and period.
- Identify your Assets.
- Identify your Liabilities.
- Calculate Shareholders’ Equity
- Add Total Liabilities to Total Shareholders’ Equity and Compare to Assets.
What does a strong balance sheet look like?
Simply having assets more than its liabilities cannot make a balance sheet strong. Strong balance sheets will have the following:
- Intelligent working capital.
- Positive Cash Flow.
- Proper capital structure.
- Income-generating assets.
What are the two types of balance sheets?
There are two types of balance sheets: Personal and Business. The personal Balance sheet displays an individual’s personal assets and liabilities. Whereas, the Business Balance Sheet consists of accounts payable, accounts receivables, intangible assets, etc.
Why is it called a balance sheet?
According to the balance sheet equation Asset – Liabilities = Owner’s Equity, each side of this equation must balance at the end of the period.
Who invented the balance sheet?
It is presumed that Luca Pacioli, a Franciscan Monk, presented the concept of balance sheet in the 15th Century.
What items are not presented on the balance sheet?
Off-balance sheet assets do not appear on the balance sheet. These OBS assets include leaseback agreements, operating leases, etc.
Where is TDS shown in the balance sheet?
TDS is a liability. It is the amount of tax we owe to the Government that we collect on behalf of the Government.
What is the difference between vertical and horizontal balance sheets?
Businesses that operate at lower scales will use vertical balance sheet. It consists of a single column to report the amounts.
Whereas, businesses that operate on a bigger scale, and have different branches/departments, prepare horizontal balance sheets. It is an additional balance sheet that displays the performance of each department/branch.
 The balance sheet can be the single most frustrating thing for a business owner. If you are having trouble with your balance sheet my first suggestion is to hire an accountant. My second suggestion is to use Quickbooks which automatically generates your balance sheet so that you don’t have to worry about it. But there are many early-stage companies and a little bit less sophisticated small businesses that aren’t using Quickbooks yet, and can’t afford a CPA. So if you are just using an Excel spreadsheet, or a piece of paper and pencil to do your accounting and someone asks you for a balance sheet, do not fret, you can create your own balance sheet with our free balance sheet template.
If you are trying to build a balance sheet on your own you will undoubtedly run into problems. Your balance sheet won’t balance. So now I just wanted to give you 4 things to look for if your balance sheet is not balancing.
1. Paid in Capital – Before I jump in to Paid in Capital mistakes, I just wanted to make sure that you understand the basics of a balance sheet. At the end of the day, in order for your balance sheet to balance, you need your Assets to equal your Liabilities plus your Owner’s Equity. Paid in capital is an owner’s equity account. The definition of paid in capital is “the capital contributed to a corporation by investors through purchase of stock from the corporation.” For most small businesses Paid in Capital is the amount of cash you personally invested in the business to get it started. You may have had other investors as well when you started, their investment plus your investment should be the total of Paid in Capital.
2. Loan Amortization Mistakes – Another common mistake for companies that have loans is to screw up the breakdown between principal and interest amounts for loan payments. A common mistake is to reduce your loan balance on the balance sheet by your monthly payment amount. Don’t forget that only a portion of each loan payment will go toward the principal on the loan! The rest will go to interest. Your interest will only show up on your income statement and cash flow statement, not the balance sheet.
3. Change in Inventory – Another common mistake that impacts the balance sheet is a change in inventory. You would think that it should be pretty simple. It is easy to determine how much inventory you have right now because you can just go make a physical count, but if you are working on a set of financial projections you will need to project future inventory amounts, and this will impact your balance sheet each month. The trick is that a change in inventory also impacts your cash flow statement, you actually have to take last month’s inventory and subtract this month’s inventory and then reduce your cash balance by that amount. Yes, it really is tricky that is why a good CPA is worth their wages.
4. Retained Earnings – Retained earnings is kind of a catch all. Retained earnings is supposed to be the sum of all your net income or net loss from the day you started your business. So if you were doing things right from the beginning you should be able to calculate retained earnings, but what I often see with small businesses is that they don’t have all the data needed to calculate retained earnings, so they just use Retained Earnings as a plug number. They make retained earnings whatever it needs to be in order for the balance sheet to balance. I am not suggesting that you do this, but just know that it is not an uncommon practice.
My suggestion, don’t waste another minute trying to figure out how to balance your balance sheet if it is not working. Hire an accountant, learn to use Quickbooks, or use ProjectionHub if that can meet your current needs. I have wasted many, many hours wrestling with a balance sheet, and I have a background in accounting. I hope this post either cleared some things up for you, or helped you make the decision to stop wasting your time and to call in a professional. Good luck!
Photo by Karolina Grabowska from Pexels
Whether you have a small business or a huge multinational corporation, you need to understand how your company grows. You should therefore keep track of your company’s finances by reviewing various financial statements.
The Income Statement, for example, shows how the organization makes and spends money. Alternatively, the Cash Flow Statement lets you see how much cash you have available, enabling you to budget your expenses correctly.
Lastly, there is the balance sheet, which is also one of the basic financial statements. Here’s a quick guide to help you make your own in Microsoft Excel.
What Is a Balance Sheet, and Why Do You Need One?

A Balance Sheet will let you see the breakdown of your company’s assets, liabilities, and equity. In one glance, you’ll see how much of the company came from retained earnings, owner’s equity, and loans.
With this information on hand, you can compute its return on investment and its various financial ratios. You can then compare these values against similar companies in the same industry. This will give you a sense of how the business is performing versus its peers in the industry.
1. Select the Time to Cover
As with other financial statements, you have to pick a period to cover. Typically, this starts on January 1st and ends on December 31st.
However, you could also choose a different period for computation, called the fiscal year, which begins on Oct 1 and ends on September 30. Do note that whatever period you use here must be consistent across your other statements.
2. Prepare Your Accounts
To avoid the hassle of having to dig through your records when you’re making your balance sheet, you should prepare it beforehand. Make sure to have your cash flow statement, bank statements, loan account statements, and credit card balances available to you.
Before you begin, you need to know the value of the assets and inventory on hand. Don’t forget to include the amount you put down to start your business, as well as investments made by other people and entities.
3. Create the Excel File
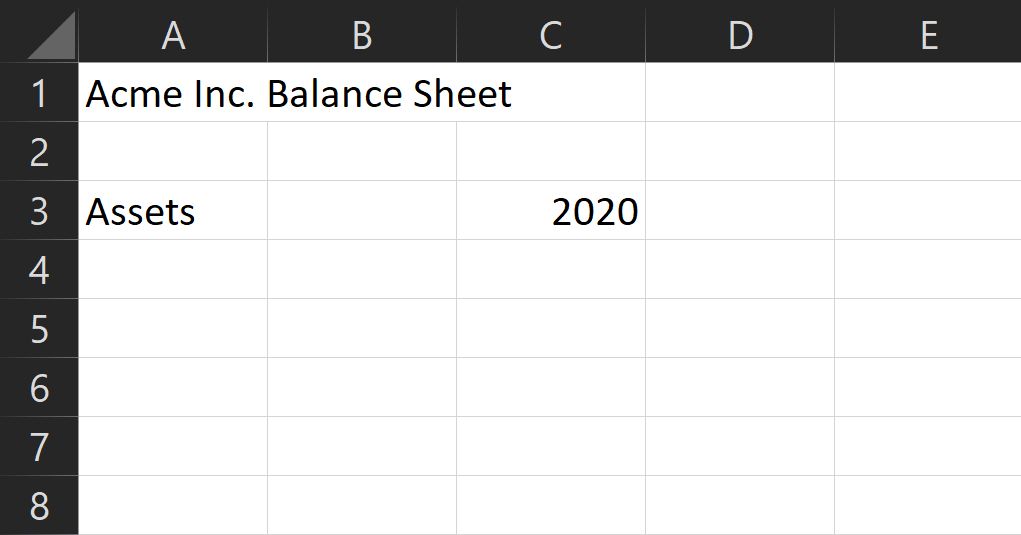
Once you know the period you’re covering and have the values you need, it’s time to create the Excel file. Open up a new file on Microsoft Excel. Put in [Company Name] Balance Sheet at cell A1 for easy identification.
Leave some space for formatting, then on the first column of the third row, write Assets. This is the section where you’ll put in the values for everything your company has. Then on the third column of the same row, write the fiscal year you’re covering.
After Assets, you have to create the corresponding Liabilities and Owner’s Equity section. Liabilities refer to the amount the company owes to third parties, including banks, suppliers, landlords, and the government.
Owner’s Equity, on the other hand, refers to the amount the owners raised for the business, plus any earning it retains in its accounts. These values in these two sections should equal the amount noted under assets—hence the term Balance Sheet.
However, before creating the Liabilities and Owner’s Equity section, you should first place the subcategories for Assets. This way, you’ll have less trouble with formatting.
4. Insert Your Categories
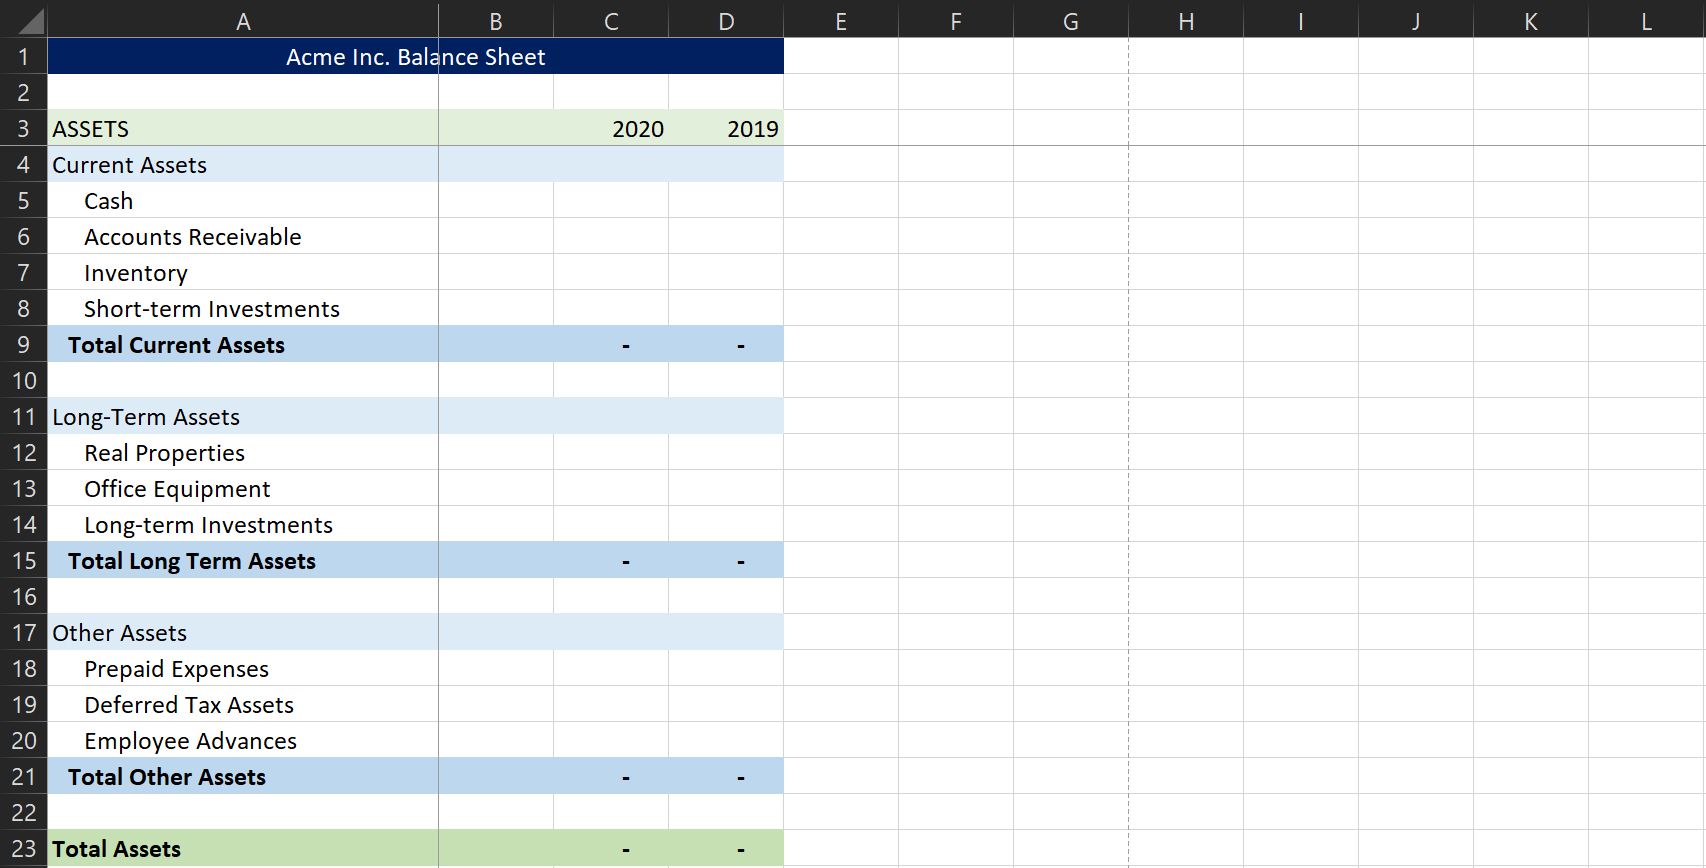
Assets
Each business and industry will have its own unique Asset subcategories. However, these are the typical sections most companies have: Current Assets, Fixed or Long-Term Assets, and Other Assets. These are then further broken down into small categories.
Current Assets are assets you can quickly liquidate. These are typically cash, accounts receivable, inventory, and short-term investments. On the other hand, Fixed or Long-Term Assets are harder to convert into currency. These could be Real Properties, Office Equipment, Long-term investments, and more.
Other Assets are usually minor items that can’t be easily defined under current or long-term assets. These could include Prepaid Expenses (like subscriptions), Deferred Tax Assets (like refunds), and Employee Advances.
While these categories apply to most businesses, your company might have a unique asset category, so you should review your operations before considering this as final.
Liabilities & Owner’s Equity

Similar to Assets, Liabilities & Owner’s Equity has three major subcategories: Current Liabilities, Long-term Liabilities, and Owner’s Equity. As the term suggests, current liabilities are obligations that the company must meet either in one year or in one operating cycle (where one operating cycle refers to the time it takes for inventory to be converted into sales).
Current Liabilities could include accounts payable to suppliers and lessors, short-term loans from banks and creditors, income taxes, payable salaries, prepaid goods and services, and the current portion of long-term debt.
Under Long-term Liabilities, you will find Long-term debt, Deferred income tax, and Pension fund benefits, if required by law.
Lastly, Owner’s Equity consists of Owner’s equity, which is the amount you put in the business. If you’re running a corporation, both this section and its subsection are called Shareholders’ Equity instead.
You will also find Retained earnings under the equity section, which is the amount the business earned in the period less dividends paid out.
5. Adding Your Values
Under Assets, add the values for each subcategory to know how much you have for each section. You then need to add each subtotal to get the total asset value of your company.
Likewise, you should also add the values for each Liability and Owner’s Equity subcategory to find how much of your company’s assets are from creditors, the owners, and earnings.
Take note that the total values for the Assets section and the Liabilities and Owner’s Equity section should match. Otherwise, there might have been an error in your accounting.
6. Some Useful Formulas
You can use the values you find in the balance sheet to look at its financial ratios. These formulas assess your business’s performance and can be used for comparison with other similar companies in the same industry.
Debt Ratio

This is the percentage of the company’s debt measured against its assets. The formula for this is Total Liabilities / Total Assets. If you get a value greater than 100%, that means its debt is greater than all its assets. High-ratios are also at a higher risk of default—but this value varies between industries.
Like real estate and utilities, capital-intensive businesses typically get higher average debt ratio values than service industry-based companies.
Current Ratio

This value shows the capacity of a company to pay its short-term loans with its liquid assets. This is computed by dividing current assets by current liabilities. If the value you get here is below zero, there is a danger a company might default on its short-term loans because of a lack of liquidity.
Working Capital

When you subtract a company’s current liabilities from its current assets, you get working capital. This amount shows how much cash and cash equivalent a company has after paying off its current obligations.
If there is a significant positive difference between the two, the company can easily grow and scale its business. But if it’s near zero, or even negative, then it might have trouble paying its loans and liabilities, or worse, could go bankrupt.
Asset-to-Equity Ratio

The Asset-to-Equity (A/E) Ratio is calculated by dividing total owner’s equity by total assets. This formula shows how much the company is funded by the owners versus the amount financed through loans.
A company with a high A/E ratio may indicate that most of its financing came from the owners, meaning it doesn’t have many obligations to pay. On the contrary, a low A/E ratio means that most of its assets came in loans or credits.
If the company has consistent cash flow, a low A/E ratio will have a low impact on its daily operations. However, it leaves it vulnerable to price, interest, and drastic changes, giving them less leeway to react.
Where to Find Balance Sheet Templates
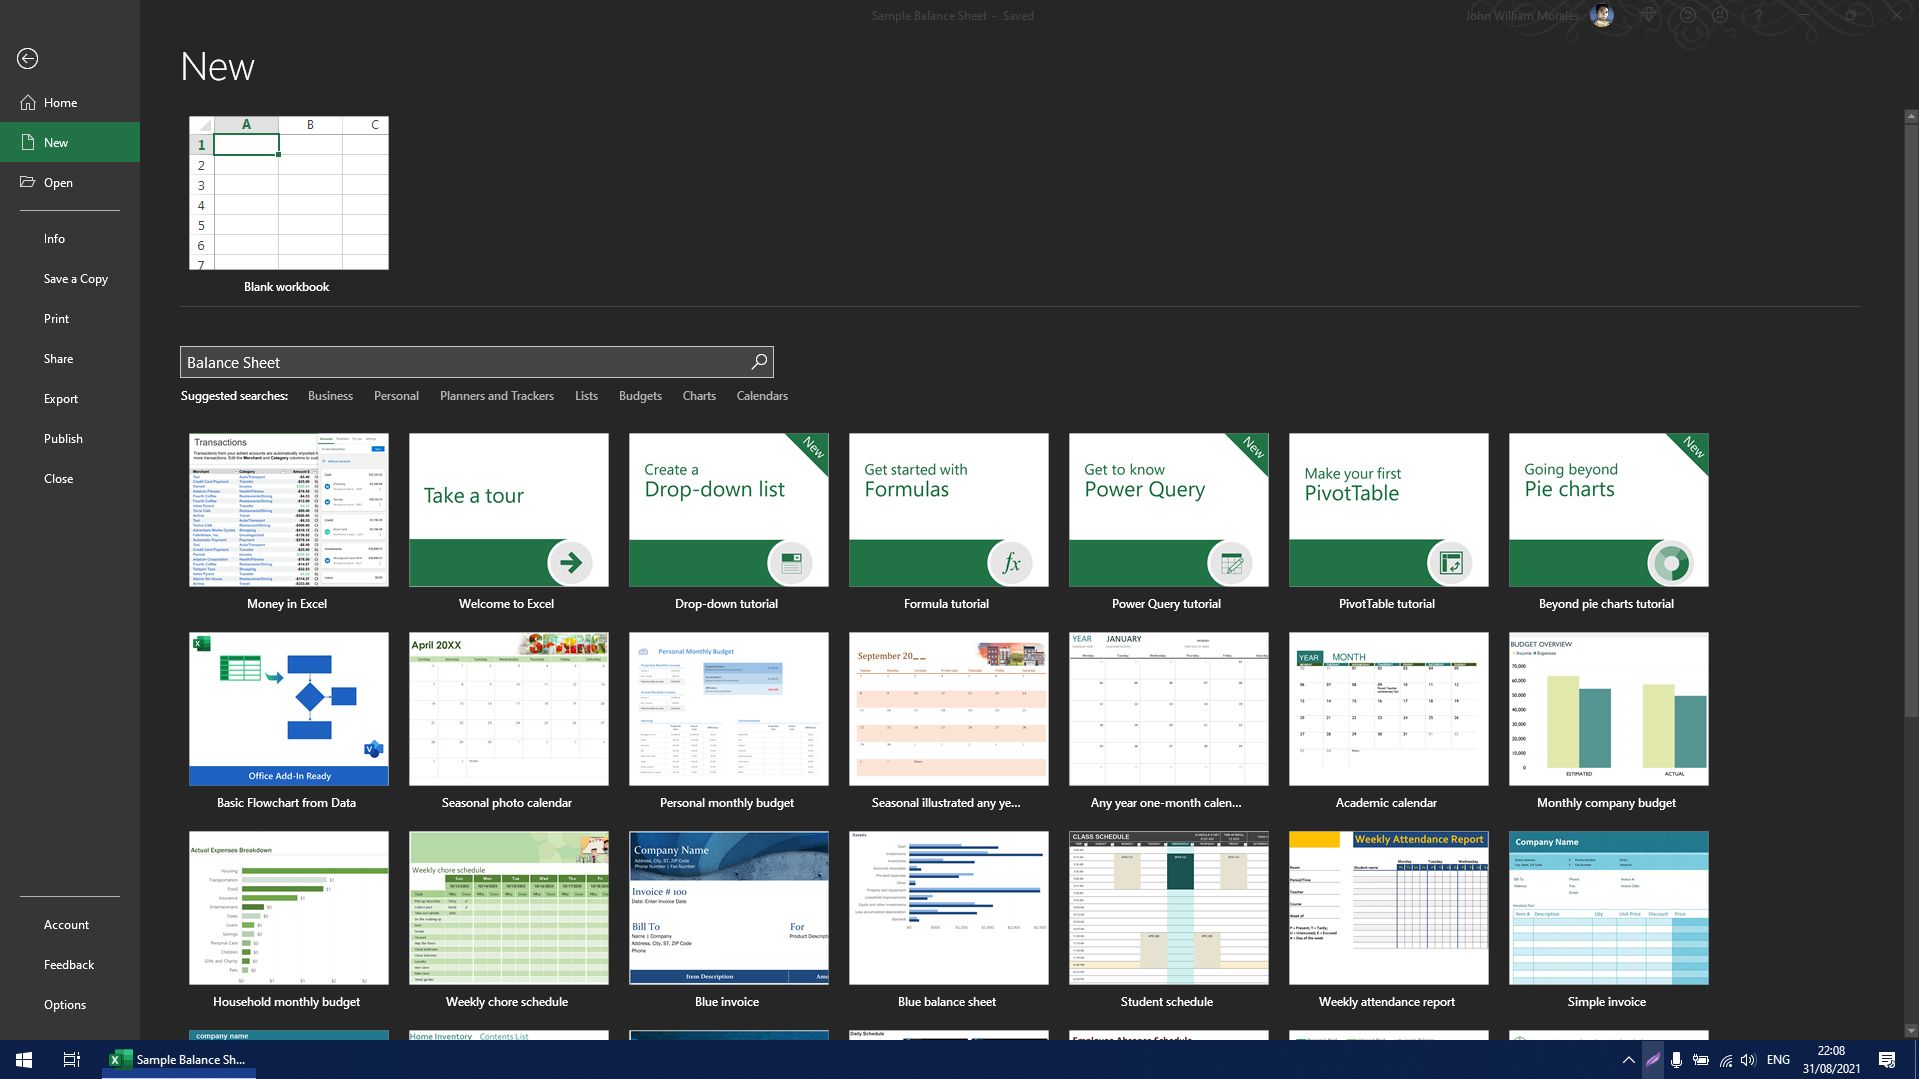
Although you may know now how to create a balance sheet, it’s sometimes better to find a template to follow. You can do that in Excel by clicking on File. Go to the New tab, then in the Search Bar, type Balance Sheet. After a quick search, Excel will give you at least three templates you can use.
Alternatively, you can also visit Vertex42, FreshBooks, or Wise.com to download a template from their website.
Keep Track of Your Business
Whatever business you have, you should keep track of how it’s going. That way, you’re not going in blindly and making decisions without numbers to back you up. After all, a good entrepreneur should know their business like the back of their hand.
A Balance Sheet, Income Statement, and Cash Flow document are just some of the essential documents you need to monitor your finances. But once your business grows and finances become complicated, hire a professional bookkeeper to ensure you get all your numbers right.
Balance Sheet Formula (Table of Contents)
- Balance Sheet Formula
- Examples of Balance Sheet Formula (With Excel Template)
- Balance Sheet Formula Calculator
Balance Sheet Formula
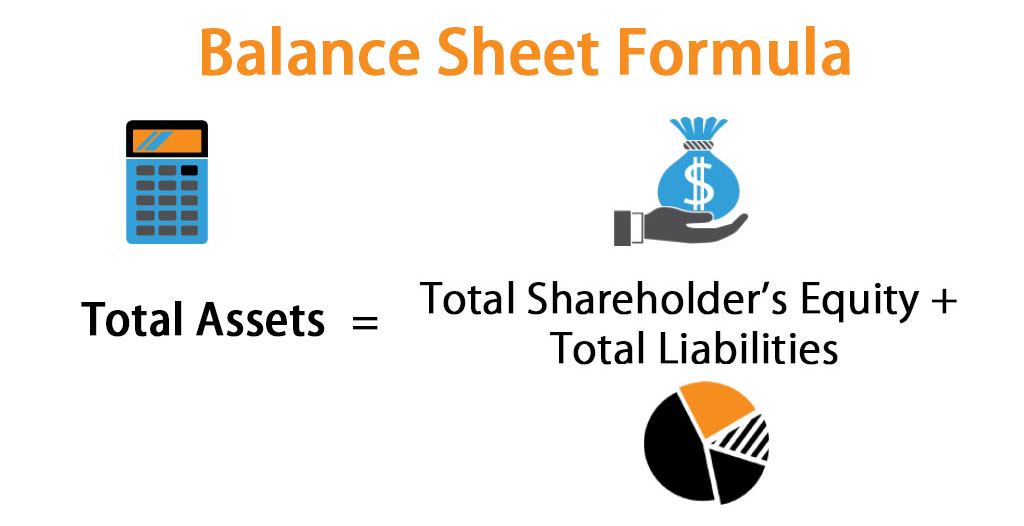
The balance sheet formula is the accounting equation and it is the fundamental and most basic part of the accounting. The balance sheet will form the building blocks for the whole double entry accounting system. The balance sheet formula will look like:
Total Assets = Total Shareholder’s Equity + Total Liabilities
Examples of Balance Sheet Formula (With Excel Template)
Let’s take an example to understand the calculation of Balance Sheet formula in a better manner.
You can download this Balance Sheet Formula Excel Template here – Balance Sheet Formula Excel Template
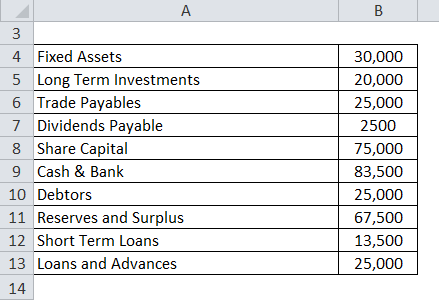
Balance Sheet Formula – Example #1
Let’s try to prepare Balance Sheet with a simple example. Following are the extracts and information available from ABC Ltd.
Solution:
Total Shareholder’s Equity is Calculated as:
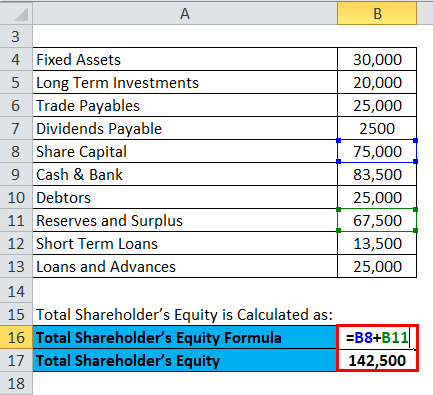
- Shareholder’s Equity = 75,000 + 67,500
- Shareholder’s Equity = 142,500
Total Liabilities is Calculated as:
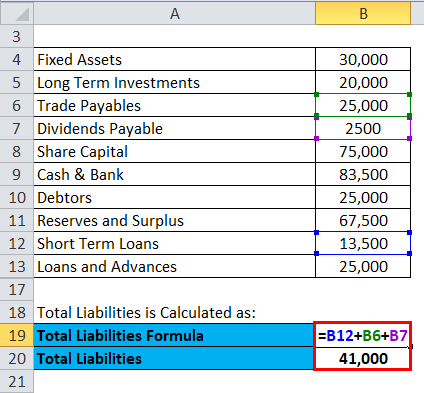
- Total Liabilities = 13,500 + 25,000 + 2,500
- Total Liabilities = 41,000
Sum of Total Shareholder’s Equity and Total Liabilities:
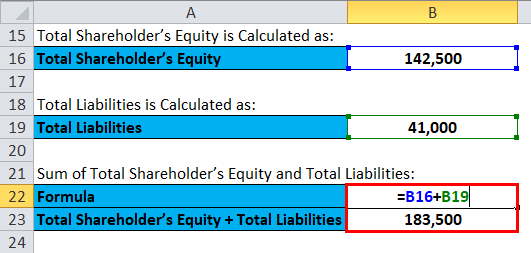
- Shareholder’s Equity + Total Liabilities = 142,500 + 41,000
- Shareholder’s Equity + Total Liabilities = 183,500
Total Assets is calculated as:
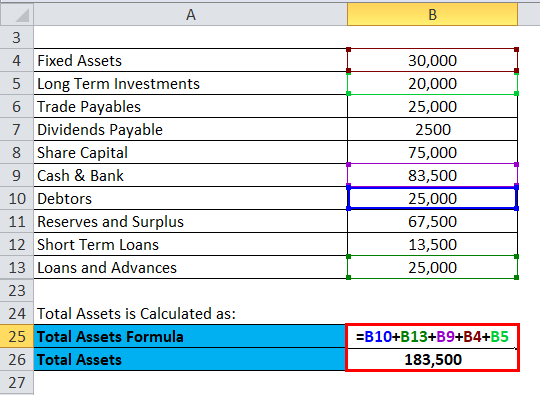
- Total Assets = 25,000 + 25,000 + 83,500 + 30,000 + 20,000
- Total Assets = 183,500
So, now we can see that the balance sheet equation says which is Total assets = Total Liabilities + Total equity’s shareholders and in this case, it is 183,500.
Balance Sheet:
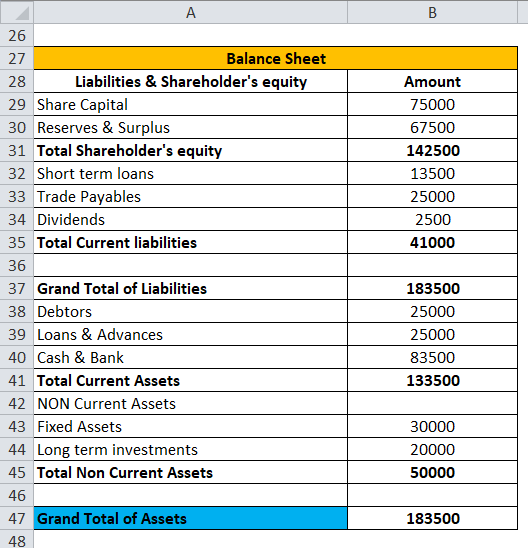
Now in the above given balance sheet, we have calculated Grand total of assets using total current assets and total non-current assets.
Balance Sheet Formula – Example #2
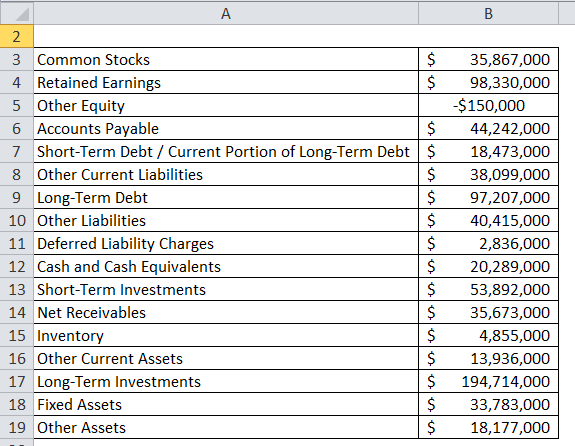
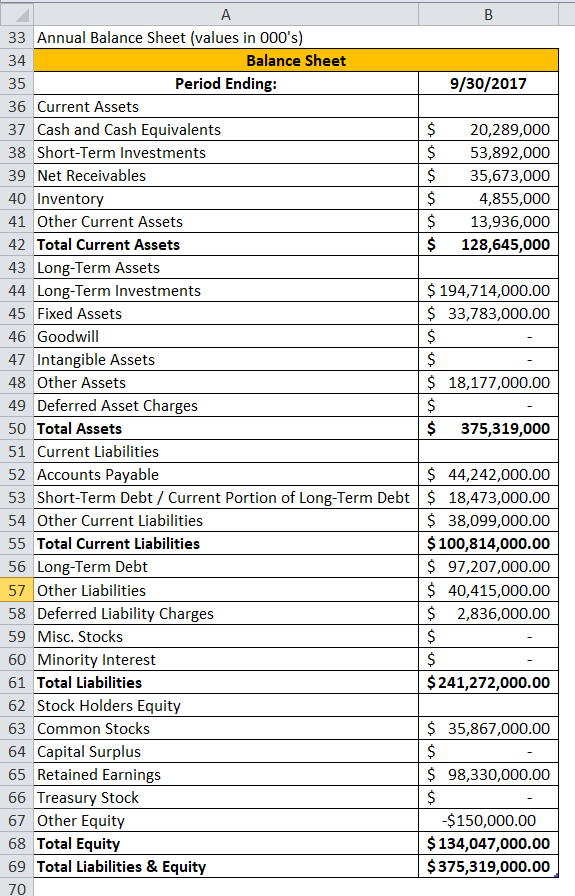
Below extract from Apple Inc. financial statements (annual report) as of 09/30/2017
Solution:
Total Shareholder’s Equity is Calculated as:
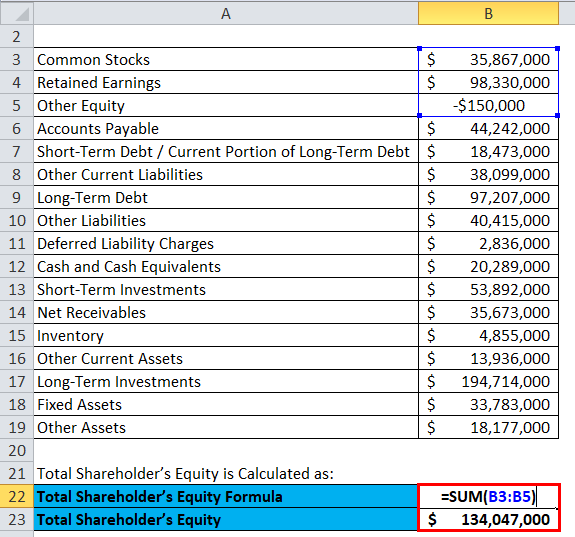
- Total Shareholder’s Equity = 3,58,67,000 + 9,83,30,000 – 1,50,000
- Total Shareholder’s Equity = 13,40,47,000
Total Liabilities is Calculated as:
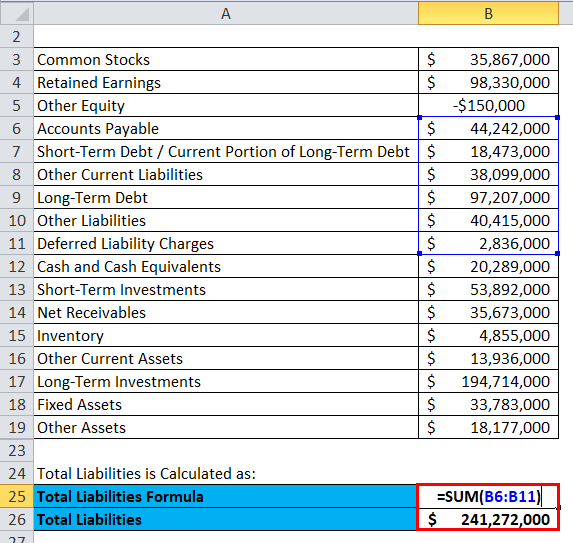
- Total Liabilities = 4,42,42,000 + 1,84,73,000 + 3,80,99,000 + 9,72,07,000 + 4,04,15,000 + 28,36,000
- Total Liabilities = 24,12,72,000
Sum of Total Shareholder’s Equity and Total Liabilities:
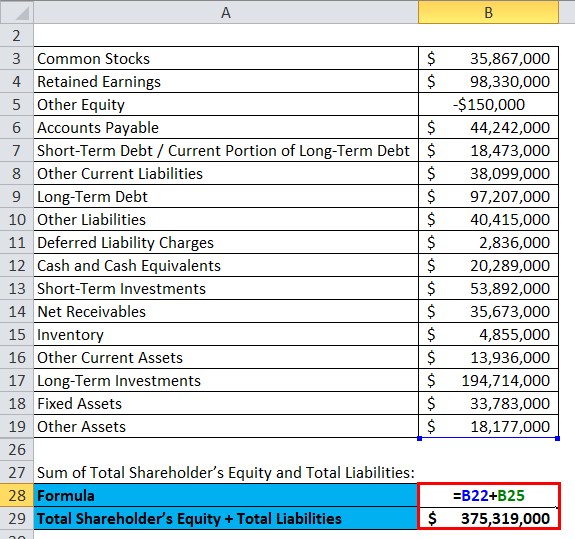
- Shareholder’s Equity + Total Liabilities = 13,40,47,000 + 24,12,72,000
- Shareholder’s Equity + Total Liabilities = 37,53,19,000
Total Assets is calculated as:
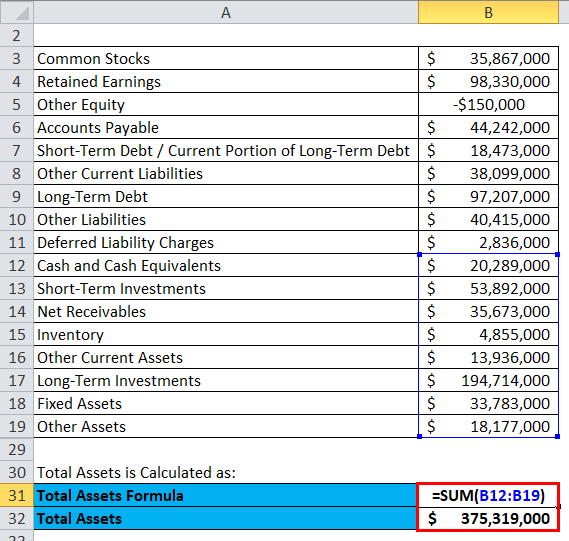
- Total Assets = 2,02,89,000 + 5,38,92,000 + 3,56,73,000 + 48,55,000 + 1,39,36,000 + 19,47,14,000 + 3,37,83,000 + 1,81,77,000
- Total Assets = 37,53,19,000
Balance Sheet:
Balance Sheet Formula – Example #3
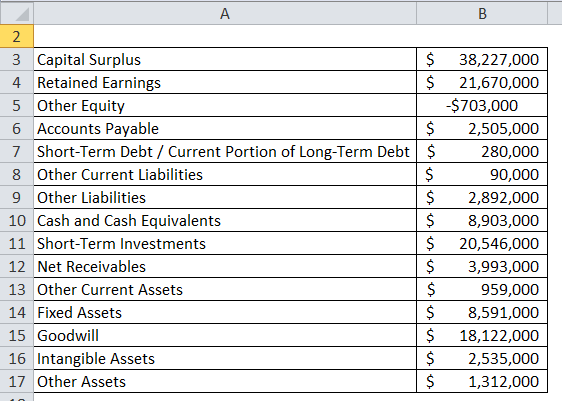
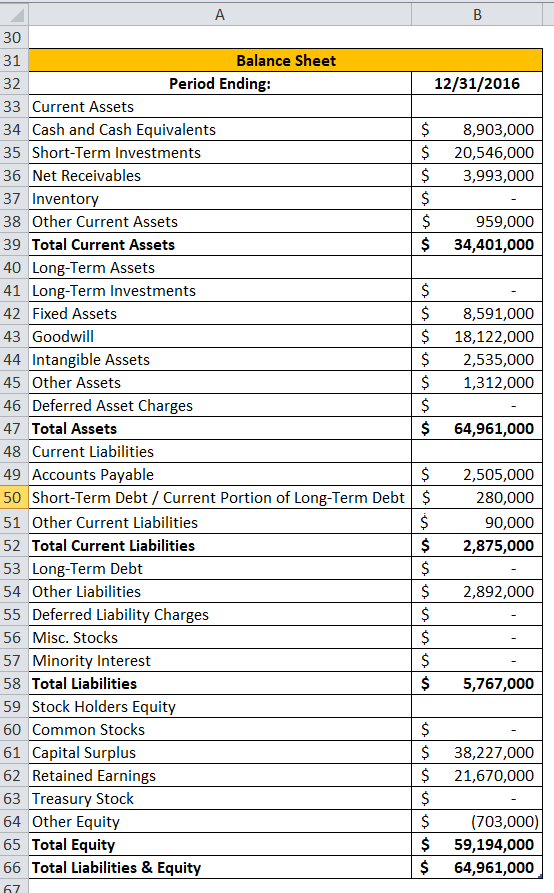
Below are extracts from Facebook financial statements (annual report) as of 09/30/2017
Solution:
Total Shareholder’s Equity is Calculated as:
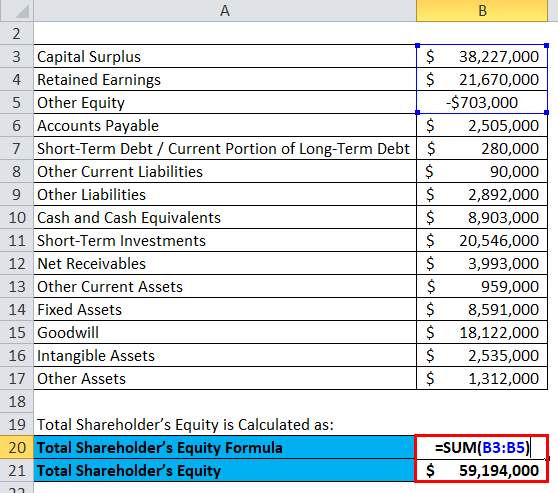
- Shareholder’s Equity = 3,82,27,000 + 2,16,70,000 – 7,03,000
- Shareholder’s Equity = 5,91,94,000
Total Liabilities is Calculated as:
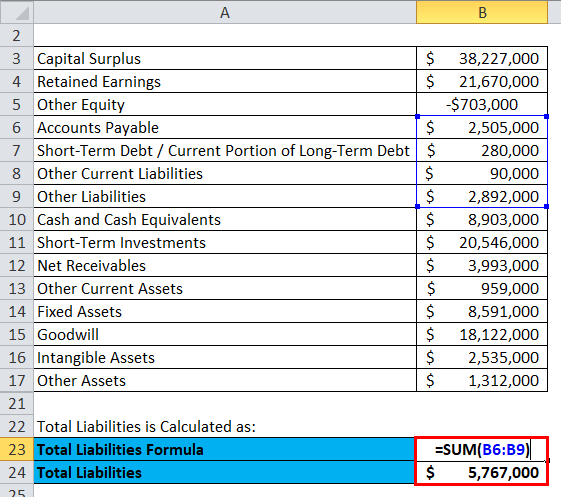
- Total Liabilities = 25,05,000 + 2,80,000 + 90,000 +28,92,000
- Total Liabilities = 57,67,000
Sum of Total Shareholder’s Equity and Total Liabilities:
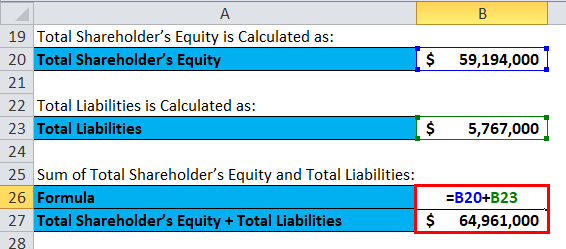
- Shareholder’s Equity + Total Liabilities = 5,91,94,000 + 57,67,000
- Shareholder’s Equity + Total Liabilities = 6,49,61,000
Total Assets is calculated as:
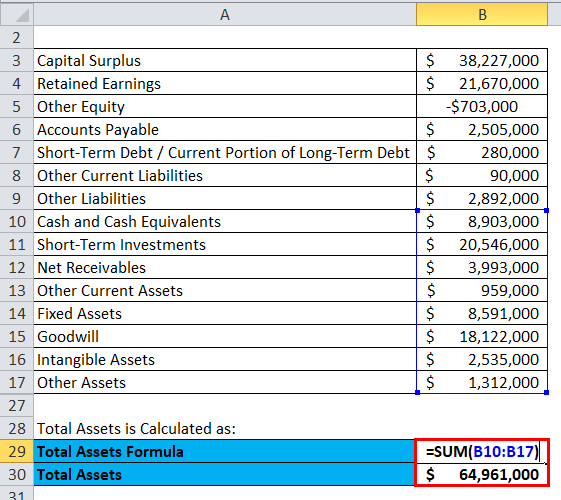
- Total Assets = 89,03,000 + 2,05,46,000 + 39,93,000 + 9,59,000 + 85,91,000 + 1,81,22,000 + 25,35,000 + 13,12,000
- Total Assets = 6,49,61,000
Balance Sheet:
Explanation of the Balance Sheet formula
In its most simple form, the balance sheet formula will try to depict what a company will own, what a company will owe and what stake the shareholders, or the owners have in the company’s business. The equation if one notice then one can conclude that it will start off with the company assets which are the resources of the company and the same has to be used in the near future like the accounts receivable, cash, and fixed assets.
Relevance and Uses of Balance Sheet Formula
Most of the cases, the company will not own its assets outright. For example, it might have borrowed a loan and same be pending on the mortgage on the building, company car, or even it might owe money to its owners or the shareholders. That is the reason the second part of the balance sheet formula is made up of the claims on assets of the company. All these claims on the assets of the company can be separated into 2 broad categories: equity and liabilities.
Liabilities are the claims on the assets of the company by the people or the other firms. A mortgaged or the bank loan is a good example. The bank will have a claim to the company’s land or the building which is mortgaged. Liabilities, on the other hand, are usually presented before equity in the balance sheet formula because the liabilities should be repaid before the shareholder’s or the owners’ claims.
Equity on another hand is the owner’s or the shareholders’ claims on the assets of the company. This will be the amount of money which the owners or the shareholders have contributed to the company for earning an ownership stake. Equity will also include retained earnings. Once all the claims by outside the companies and claims by the owners or the shareholders are summed up, then they will always equal the total assets of the company.
Balance Sheet Formula Calculator
You can use the following Balance Sheet Calculator.
| Total Shareholder’s Equity | |
| Total Liabilities | |
| Total Assets Formula = | |
| Total Assets Formula = | Total Shareholder’s Equity + Total Liabilities | |
| 0 + 0 = | 0 |
Recommended Articles
This has been a guide to Balance Sheet formula. Here we discuss How to Calculate Balance Sheet along with practical examples. We also provide a Balance Sheet Calculator with downloadable excel template. You may also look at the following articles to learn more –
- Consumer Surplus Formula
- How to Calculate Net Income?
- Calculate Asset to Sales Ratio Using Formula
- Cost of Equity Formula
- Trial Balance vs Balance Sheet | Top Differences
- Guide to Asset to Sales Ratio
- Different Types of Balance Sheet Ratios
A balance sheet is commonly called a “snapshot of a company’s financial condition”. It is a statement of the company regarding its financial position or its net worth or in simpler words a statement regarding the company’s spending and earning. There are three important financial statements in a company namely income statement, cash flow statement, and balance sheet. It is expected to carry details regarding the company’s assets, liabilities, and owner/shareholder’s equity; but there might be additions to this, depending upon the need and want of the business. A standard company balance sheet generally has two main heads:
1. Assets (what the company own)
2. Liabilities (what the company owe)
Assets = Liabilities + Equity
The above two heads must be an equal ratio for a balance sheet to be ideal otherwise it depicts that the company’s financial position is unstable which might even lead the company into bankruptcy. The ‘equity’ which we see above in the equation, is the amount or the money which the company owes to its shareholders. The difference between the assets and the liabilities is known as ‘equity’ or ‘net worth’ or ‘capital’ of a company. According to the accounting equation, net worth must equal assets minus liabilities.
Balance Sheets are usually calculated after every quarter, six months, one year, or one for each business transaction. A balance sheet sometimes may also carry details from the last year along with the current year, which makes the comparison between two consecutive years easier, it is called a comparative balance sheet.
Let’s dwell a little upon what are the three main things that form the equation of a balance sheet:
1. Asset – These are the things or resources which the company owns. There are two kinds of assets the first one is ‘current asset’ and the other one is ‘non-current asset’.
- Current Assets: – These are also known as liquid assets with a lifespan of one year or less. They can be liquidated and turned into cash easily. Current assets include cash, accounts receivable (the amount owed to your company by customers), inventory (company’s work in progress), and prepaid expenses.
- Non-current Assets: – These are non-liquid assets with a longer lifespan than a year. They cannot be liquidated easily and converted into cash. These are the company’s long-term investments such as property, equipment, vehicles, etc. Non-current assets might also include intangible assets such as patents, contract, copyright, and goodwill
1. Liabilities– These are the obligations or the duties the company owes to the outside parties (e.g. customers and creditors). They are also divided into two categories, one is ‘current liability’ and the second one is ‘non-current liabilities’ or ‘long-term liability’.
- Current Liabilities: – these are the obligations that the company has to discharge within a term of one year. They might include the debts which are due within one year, such as account payable, short-term loans, current portion of long-term loans, taxes payable, wages, rents (of building and equipment), utilities, etc.
- Long-term Liabilities: – these are the obligations or the long-term debts of the company which is to be discharged after a term of one year. Long-term liabilities may include deferred income tax (tax due on the increase in value of an investment), bank debts, principal on bonds, and any pension fund liabilities.
2. Equity- when liabilities are deducted from the total assets, equity is all that is left. When the company is a sole proprietor “owner’s equity” is used in the balance sheet and when the company is a corporation “shareholder’s equity” is used. It is also called the book value of the company. Equity includes capital stock (the amount invested by the owner or the inverters/shareholders) and the retained earnings (money used to pay the debts or reinvest in the business for the growth and expansion purpose). We can say that equity is a residual of the company after subtracting the liabilities from its assets.
Balance Sheet an Essential for Business Today
New investors and creditors before investing in a business sure would like to know about the profit and loss ratio of the company. No one would willingly invest in a business that is performing poorly or which might soon end up bankrupt. The point being made is that a prudent man would analyze a company/business’s financial position before investing in it and this is where the balance sheet comes handy. Financial stability and business performance are assessed through balance sheets by the investors and to infer as to how efficiently the company can use its resources and assess the value of their investments.
Just as much as the balance sheet is important to the outside investors, it is equally essential for the smooth running of the business. It helps the business to keep a track of their finances so that they know the areas which need attention, to know the best ways to meet their financial obligations, and to decide whether the business needs additional debts/loans or not. Balance sheets are also required because it is only through these documents that the bank ascertains if you are qualified for the loan or not.
Balance sheets can be used to track the company’s growth or downfall, whichever is the case. By comparing balance sheets of different years one can understand the growth or fall of the entity. It helps the company to meet the unforeseen expenses. Preparing balance sheets is optional for sole proprietorships and partnerships, which is not the case with companies. Nevertheless, a balance sheet is useful for monitoring the health of the business.
Balance Sheet for Excel Format
There are different types of balance sheet formats today. Common formats are the vertical balance sheet and horizontal balance sheet, but there are other formats as well, such as classified, common size, or comparative balance sheets. It is up to the companies or the individuals to select the format which best suits their taste or which they find easier to read and manage.
1. Horizontal balance sheet: in these two tables are formed. The assets appear on the left-hand side and liability plus equity appears on the right-hand side.
2. Vertical balance sheet: in this format, again there are two tables but they are one underneath another. The assets are listed in the first list and under the list of assets there is liabilities plus equity list.
The advantage of creating a balance sheet in excel is that it provides formulas and readymade tables which not only saves labour but reduces the risk of calculation mistakes as well. In an Excel spreadsheet, there are endless rows and columns which can be selected as per the users need (depending upon the choice of format). And each row or column contains cells, here we can enter our data along with the formula and in seconds we will get the desired result we need.
Excel Spreadsheet provides its users with a template balance sheet that can be used in small businesses for accounting purposes. There are endless rows and columns in an excel spreadsheet. The first thing you have to do is decide whether you want to formulate a vertical balance sheet or a horizontal balance sheet or a comparative balance sheet or any other. Once decided then the next step is to select columns and label them accordingly. There are generally two lists (assets and liabilities) in a balance sheet that contain two columns each, irrespective of the format. The asset’s list will carry the names of the assets of the company in the first column and side by side the figures or the value of those assets in the second column. The list of liabilities is also prepared similarly. One can also insert additional columns and rows in the balance sheet if they wish to.
| Assets | Liabilities | ||||
| Current Assets | Current Liabilities | ||||
| 1. | Cash | 5000 | 1. | Bank drafts | 500 |
| 2. | Inventory | 3000 | 2. | Accounts payable | 1000 |
| 3. | Accounts receivable | 2000 | |||
| Total Current Assets | =10000 | Total Current Liabilities | =1500 | ||
| Fixed Assets | Long-term Liabilities | ||||
| 1. | Land and buildings | 13000 | 1. | Mortgage | 9000 |
| 2. | Equipment | 6000 | 2. | Long-term loans | 2000 |
| Total Fixed Assets | =19000 | Total Long-term Liabilities | =11000 | ||
| Total Liabilities | =12500 | ||||
| Capital | |||||
| 1. | Shares | 10000 | |||
| 2. | Retained earnings | 6500 | |||
| Total Capital | =16500 | ||||
| TOTAL ASSETS | =29000 | TOTAL LIABILITIES AND CAPITAL | =29000 |
“Horizontal Balance Sheet Format”
To create an excel balance sheet, one has to be acquainted with the basic functions or formulas involved in its creation. There are generally three formulas involved which go into the making of an excel balance sheet viz, ‘Excel Addition Formula’, ‘Excel Subtraction Formula’, and ‘Sum Function’. We can better understand these with the help of illustrations.
For instance, we want to enter the total value of the company’s land property in one cell and there are three properties, for that we will use the Excel addition formula. Type = followed by the value of first property + second land property + third land property and the cell will show the total sum of all.
| A | B | |
| 1 | =2000+3000+6000 | |
| 2 |
And if the values are already mentioned in the spreadsheet then cell reference can be used instead of entering numbers in the cells.
| A | B | |
| 1 | =B1+B2+B3 | 2000 |
| 2 | 3000 | |
| 3 | 6000 |
Similarly, the difference can be calculated by the excel subtraction formula by replacing + operator to – operator, in the formula. This formula is used when we have to calculate owner/shareholder’s equity, or when we have to find the difference between two figures in a balance sheet.
| A | B | |
| =2000-3000-6000 | ||
| 2. | ||
| 3. |
Or
| A | B | |
| 1. | =B1-B2-B3 | 2000 |
| 2. | 3000 | |
| 3. | 6000 |
The sum function in excel is used when we wish to perform additions without using the + operator. Instead of using =2000+3000+6000, you can use =SUM followed by the reference to two or more of the cell numbers in brackets.
| A | B | |
| 1. | =SUM(B1,B2,B3) | 2000 |
| 2. | 3000 | |
| 3. | 6000 |
A cell reference is a much quicker way of getting the calculations done especially when big figures are involved.
Concluding Remark
Large to small businesses, public to private companies, sole proprietors, partnership firms, and even individuals (for personal use) recognize balance sheets as an essential tool to keep track of the financial spending and earnings. Excel balance sheets templates help them even further by reducing the workload and by proving to be efficient time-wise.
- Companies, both public and private, are required to keep the profit and loss statement and balance sheets according to the 2017’s Amendment to the Companies Act 2013. The format is provided by the legislature of India according to which both these financial statements are to be prepared; these are contained in the new Schedule III.
- Sole proprietors and partnership firms are not required by law to maintain balance sheets but it is only wise to keep one. Even though it is optional, most of the firms and sole proprietors hire accountants to keep regular track of their balance sheets along with other important financial statements.
- Individuals maintain balance sheets mostly as a part of self-discipline. A balance sheet helps in organizing the expenses and let the person know how much he can spend on one particular head of items or what are his assets and liabilities. It is popularly said that a good habit goes a long way, and a person who keeps up with his financial health is less likely to go broke at the end of each month.