
Давайте посмотрим правде в глаза. Независимо от того, чем мы занимаемся, рано или поздно нам придется иметь дело с повторяющимися задачами, такими как обновление ежедневного отчета в Excel.
Python идеально подходит для решения задач автоматизации. Но если вы работаете компании, которая не использует Python, вам будет сложно автоматизировать рабочие задачи с помощью этого языка. Но не волнуйтесь: даже в этом случае вы все равно сможете использовать свои навыки питониста.
Для автоматизации отчетов в Excel вам не придется убеждать своего начальника перейти на Python! Можно просто использовать модуль Python openpyxl, чтобы сообщить Excel, что вы хотите работать через Python. При этом процесс создания отчетов получится автоматизировать, что значительно упростит вашу жизнь.
Набор данных
В этом руководстве мы будем использовать файл Excel с данными о продажах. Он похож на те файлы, которые используются в качестве входных данных для создания отчетов во многих компаниях. Вы можете скачать этот файл на Kaggle. Однако он имеет формат .csv, поэтому вам следует изменить расширение на .xlsx или просто загрузить его по этой ссылке на Google Диск (файл называется supermarket_sales.xlsx).
Прежде чем писать какой-либо код, внимательно ознакомьтесь с файлом на Google Drive. Этот файл будет использоваться как входные данные для создания следующего отчета на Python:
Теперь давайте сделаем этот отчет и автоматизируем его составление с помощью Python!
Создание сводной таблицы с помощью pandas
Импорт библиотек
Теперь, когда вы скачали файл Excel, давайте импортируем библиотеки, которые нам понадобятся.
import pandas as pd
import openpyxl
from openpyxl import load_workbook
from openpyxl.styles import Font
from openpyxl.chart import BarChart, Reference
import string
Чтобы прочитать файл Excel, создать сводную таблицу и экспортировать ее в Excel, мы будем использовать Pandas. Затем мы воспользуемся библиотекой openpyxl для написания формул Excel, создания диаграмм и форматирования электронной таблицы с помощью Python. Наконец, мы создадим функцию на Python для автоматизации всего этого процесса.
Примечание. Если у вас не установлены эти библиотеки в Python, вы можете легко установить их, выполнив pip install pandas и pip install openpyxl в командной строке.
[python_ad_block]
Чтение файла Excel
Прежде чем читать Excel-файл, убедитесь, что он находится там же, где и ваш файл со скриптом на Python. Затем можно прочитать файл Excel с помощью pd.read_excel(), как показано в следующем коде:
excel_file = pd.read_excel('supermarket_sales.xlsx')
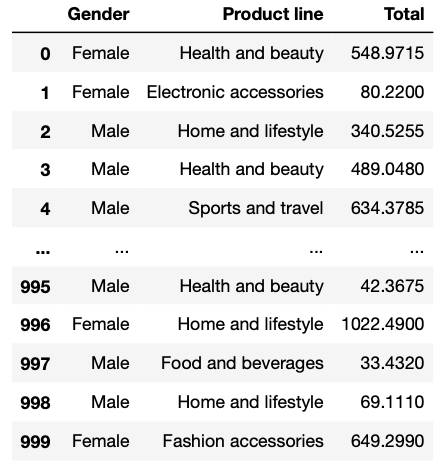
excel_file[['Gender', 'Product line', 'Total']]
В файле много столбцов, но для нашего отчета мы будем использовать только столбцы Gender, Product line и Total. Чтобы показать вам, как они выглядят, я выбрал их с помощью двойных скобок. Если мы выведем это в Jupyter Notebooks, увидим следующий фрейм данных, похожий на таблицу Excel:
Создание сводной таблицы
Теперь мы можем легко создать сводную таблицу из ранее созданного фрейма данных excel_file. Для этого нам просто нужно использовать метод .pivot_table().
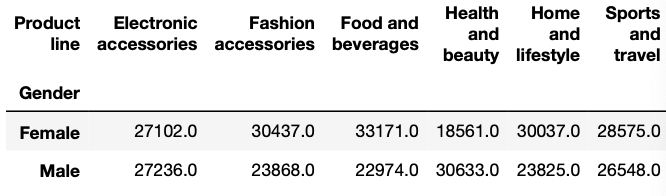
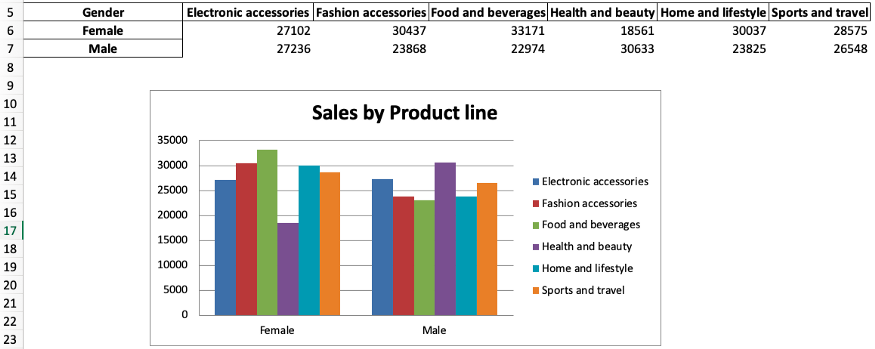
Предположим, мы хотим создать сводную таблицу, которая показывает, сколько в целом потратили на разные продуктовые линейки мужчины и женщины. Для этого мы пишем следующий код:
report_table = excel_file.pivot_table(index='Gender',
                                      columns='Product line',
                                      values='Total',
                                      aggfunc='sum').round(0)
Таблица report_table должна выглядеть примерно так:
Экспорт сводной таблицы в файл Excel
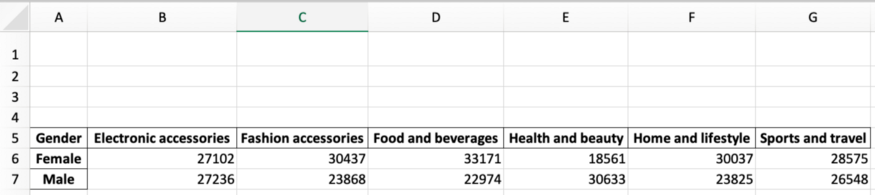
Чтобы экспортировать созданную сводную таблицу, мы используем метод .to_excel(). Внутри скобок нужно написать имя выходного файла Excel. В данном случае давайте назовем этот файл report_2021.xlsx.
Мы также можем указать имя листа, который хотим создать, и в какой ячейке должна находиться сводная таблица.
report_table.to_excel('report_2021.xlsx',
                      sheet_name='Report',
                      startrow=4)
Теперь файл Excel экспортируется в ту же папку, в которой находится ваш скрипт Python.
Создание отчета с помощью openpyxl
Каждый раз, когда мы захотим получить доступ к файлу, мы будем использовать load_workbook(), импортированный из openpyxl. В конце работы мы будем сохранять полученные результаты с помощью метода .save().
В следующих разделах мы будем загружать и сохранять файл при каждом изменении. Вам это нужно сделать только один раз (как в полном коде, показанном в самом конце этого руководства).
Создание ссылки на строку и столбец
Чтобы автоматизировать отчет, нам нужно взять минимальный и максимальный активный столбец или строку, чтобы код, который мы собираемся написать, продолжал работать, даже если мы добавим больше данных.
Чтобы получить ссылки в книге Excel, мы сначала загружаем её с помощью функции load_workbook() и находим лист, с которым хотим работать, используя wb[‘имя листа’]. Затем мы получаем доступ к активным ячейкам с помощью метода .active.
wb = load_workbook('report_2021.xlsx')
sheet = wb['Report']
# cell references (original spreadsheet)
min_column = wb.active.min_column
max_column = wb.active.max_column
min_row = wb.active.min_row
max_row = wb.active.max_row
Давайте выведем на экран созданные нами переменные, чтобы понять, что они означают. В данном случае мы получим следующие числа:
Min Columns: 1
Max Columns: 7
Min Rows: 5
Max Rows: 7
Откройте файл report_2021.xlsx, который мы экспортировали ранее, чтобы убедиться в этом.
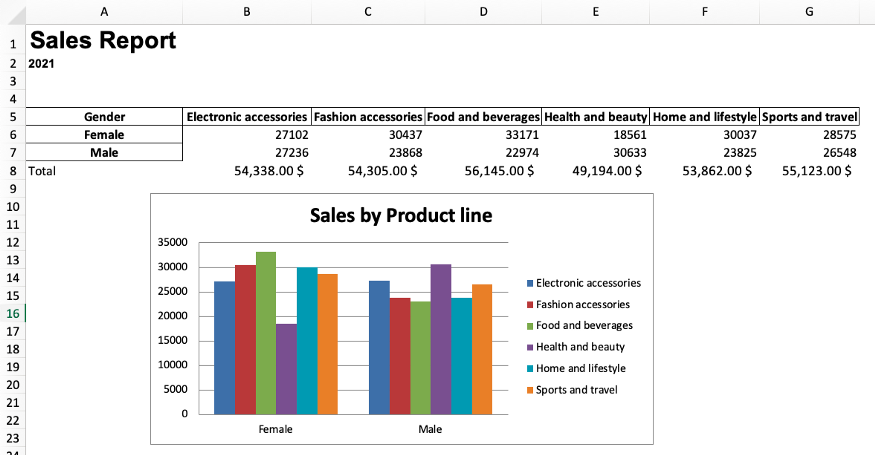
Как видно на картинке, минимальная строка – 5, максимальная — 7. Кроме того, минимальная ячейка – это A1, а максимальная – G7. Эти ссылки будут чрезвычайно полезны для следующих разделов.
Добавление диаграмм в Excel при помощи Python
Чтобы создать диаграмму в Excel на основе созданной нами сводной таблицы, нужно использовать модуль Barchart. Его мы импортировали ранее. Для определения позиций значений данных и категорий мы используем модуль Reference из openpyxl (его мы тоже импортировали в самом начале).
wb = load_workbook('report_2021.xlsx')
sheet = wb['Report']
# barchart
barchart = BarChart()
#locate data and categories
data = Reference(sheet,
                 min_col=min_column+1,
                 max_col=max_column,
                 min_row=min_row,
                 max_row=max_row) #including headers
categories = Reference(sheet,
                       min_col=min_column,
                       max_col=min_column,
                       min_row=min_row+1,
                       max_row=max_row) #not including headers
# adding data and categories
barchart.add_data(data, titles_from_data=True)
barchart.set_categories(categories)
#location chart
sheet.add_chart(barchart, "B12")
barchart.title = 'Sales by Product line'
barchart.style = 5 #choose the chart style
wb.save('report_2021.xlsx')
После написания этого кода файл report_2021.xlsx должен выглядеть следующим образом:
Объяснение кода:
barchart = BarChart()инициализирует переменнуюbarchartиз классаBarchart.dataиcategories– это переменные, которые показывают, где находится необходимая информация. Для автоматизации мы используем ссылки на столбцы и строки, которые определили выше. Также имейте в виду, что мы включаем заголовки в данные, но не в категории.- Мы используем
add_data()иset_categories(), чтобы добавить необходимые данные в гистограмму. Внутриadd_data()добавимtitle_from_data = True, потому что мы включили заголовки для данных. - Метод
sheet.add_chart()используется для указания, что мы хотим добавить нашу гистограмму в лист Report. Также мы указываем, в какую ячейку мы хотим её добавить. - Дальше мы изменяем заголовок и стиль диаграммы, используя
barchart.titleиbarchart.style. - И наконец, сохраняем все изменения с помощью
wb.save()
Вот и всё! С помощью данного кода мы построили диаграмму в Excel.
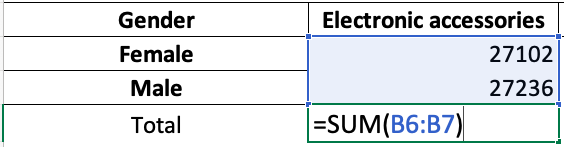
Вы можете набирать формулы в Excel при помощи Python так же, как вы это делаете непосредственно на листе Excel.
Предположим, мы хотим суммировать данные в ячейках B5 и B6 и отображать их в ячейке B7. Кроме того, мы хотим установить формат ячейки B7 как денежный. Сделать мы это можем следующим образом:
sheet['B7'] = '=SUM(B5:B6)'
sheet['B7'].style = 'Currency'
Довольно просто, не правда ли? Мы можем протянуть эту формулу от столбца B до G или использовать цикл for для автоматизации. Однако сначала нам нужно получить алфавит, чтобы ссылаться на столбцы в Excel (A, B, C, …). Для этого воспользуемся библиотекой строк и напишем следующий код:
import string
alphabet = list(string.ascii_uppercase)
excel_alphabet = alphabet[0:max_column]
print(excel_alphabet)
Если мы распечатаем excel_alphabet, мы получим список от A до G.
Так происходит потому, что сначала мы создали алфавитный список от A до Z, а затем взяли срез [0:max_column], чтобы сопоставить длину этого списка с первыми 7 буквами алфавита (A-G).
Примечание. Нумерация в Python начинаются с 0, поэтому A = 0, B = 1, C = 2 и так далее. Срез [a:b] возвращает элементы от a до b-1.
Применение формулы к нескольким ячейкам
После этого пройдемся циклом по столбцам и применим формулу суммы, но теперь со ссылками на столбцы. Таким образом вместо того, чтобы многократно писать это:
sheet['B7'] = '=SUM(B5:B6)'
sheet['B7'].style = 'Currency'
мы используем ссылки на столбцы и помещаем их в цикл for:
wb = load_workbook('report_2021.xlsx')
sheet = wb['Report']
# sum in columns B-G
for i in excel_alphabet:
    if i!='A':
        sheet[f'{i}{max_row+1}'] = f'=SUM({i}{min_row+1}:{i}{max_row})'
        sheet[f'{i}{max_row+1}'].style = 'Currency'
# adding total label
sheet[f'{excel_alphabet[0]}{max_row+1}'] = 'Total'
wb.save('report_2021.xlsx')
После запуска кода мы получаем формулу суммы в строке Total для столбцов от B до G:
Посмотрим, что делает данный код:
for i in excel_alphabetпроходит по всем активным столбцам, кроме столбца A (if i! = 'A'), так как столбец A не содержит числовых данных- запись
sheet[f'{i}{max_row+1}'] = f'=SUM({i}{min_row+1}:{i}{max_row}'это то же самое, что иsheet['B7'] = '=SUM(B5:B6)', только для столбцов от A до G - строчка
sheet [f '{i} {max_row + 1}'].style = 'Currency'задает денежный формат ячейкам с числовыми данными (т.е. тут мы опять же исключаем столбец А) - мы добавляем запись
Totalв столбец А под максимальной строкой (т.е. под седьмой), используя код[f '{excel_alphabet [0]} {max_row + 1}'] = 'Total'
Форматирование листа с отчетом
Теперь давайте внесем финальные штрихи в наш отчет. Мы можем добавить заголовок, подзаголовок, а также настроить их шрифт.
wb = load_workbook('report_2021.xlsx')
sheet = wb['Report']
sheet['A1'] = 'Sales Report'
sheet['A2'] = '2021'
sheet['A1'].font = Font('Arial', bold=True, size=20)
sheet['A2'].font = Font('Arial', bold=True, size=10)
wb.save('report_2021.xlsx')
Вы также можете добавить другие параметры внутри Font(). В документации openpyxl можно найти список доступных стилей.
Итоговый отчет должен выглядеть следующим образом:

Автоматизация отчета с помощью функции Python
Теперь, когда отчет готов, мы можем поместить весь наш код в функцию, которая автоматизирует создание отчета. И в следующий раз, когда мы захотим создать такой отчет, нам нужно будет только ввести имя файла и запустить код.
Примечание. Чтобы эта функция работала, имя файла должно иметь структуру «sales_month.xlsx». Кроме того, мы добавили несколько строк кода, которые используют месяц/год файла продаж в качестве переменной, чтобы мы могли повторно использовать это в итоговом файле и подзаголовке отчета.
Приведенный ниже код может показаться устрашающим, но это просто объединение всего того, что мы написали выше. Плюс новые переменные file_name, month_name и month_and_extension.
import pandas as pd
import openpyxl
from openpyxl import load_workbook
from openpyxl.styles import Font
from openpyxl.chart import BarChart, Reference
import string

def automate_excel(file_name):
    """The file name should have the following structure: sales_month.xlsx"""
    # read excel file
    excel_file = pd.read_excel(file_name)
    # make pivot table
    report_table = excel_file.pivot_table(index='Gender', columns='Product line', values='Total', aggfunc='sum').round(0)
    # splitting the month and extension from the file name
    month_and_extension = file_name.split('_')[1]
    # send the report table to excel file
    report_table.to_excel(f'report_{month_and_extension}', sheet_name='Report', startrow=4)
    # loading workbook and selecting sheet
    wb = load_workbook(f'report_{month_and_extension}')
    sheet = wb['Report']
    # cell references (original spreadsheet)
    min_column = wb.active.min_column
    max_column = wb.active.max_column
    min_row = wb.active.min_row
    max_row = wb.active.max_row
    # adding a chart
    barchart = BarChart()
    data = Reference(sheet, min_col=min_column+1, max_col=max_column, min_row=min_row, max_row=max_row) #including headers
    categories = Reference(sheet, min_col=min_column, max_col=min_column, min_row=min_row+1, max_row=max_row) #not including headers
    barchart.add_data(data, titles_from_data=True)
    barchart.set_categories(categories)
    sheet.add_chart(barchart, "B12") #location chart
    barchart.title = 'Sales by Product line'
    barchart.style = 2 #choose the chart style
    # applying formulas
    # first create alphabet list as references for cells
    alphabet = list(string.ascii_uppercase)
    excel_alphabet = alphabet[0:max_column] #note: Python lists start on 0 -> A=0, B=1, C=2. #note2 the [a:b] takes b-a elements
    # sum in columns B-G
    for i in excel_alphabet:
        if i!='A':
            sheet[f'{i}{max_row+1}'] = f'=SUM({i}{min_row+1}:{i}{max_row})'
            sheet[f'{i}{max_row+1}'].style = 'Currency'
    sheet[f'{excel_alphabet[0]}{max_row+1}'] = 'Total'
    # getting month name
    month_name = month_and_extension.split('.')[0]
    # formatting the report
    sheet['A1'] = 'Sales Report'
    sheet['A2'] = month_name.title()
    sheet['A1'].font = Font('Arial', bold=True, size=20)
    sheet['A2'].font = Font('Arial', bold=True, size=10)
    wb.save(f'report_{month_and_extension}')
    return
Применение функции к одному файлу Excel
Представим, что исходный файл, который мы загрузили, имеет имя sales_2021.xlsx вместо supermarket_sales.xlsx. Чтобы применить формулу к отчету, пишем следующее:
automate_excel('sales_2021.xlsx')
После запуска этого кода вы получите файл Excel с именем report_2021.xlsx в той же папке, где находится ваш скрипт Python.
Применение функции к нескольким файлам Excel
Представим, что теперь у нас есть только ежемесячные файлы Excel sales_january.xlsx, sales_february.xlsx и sales_march.xlsx (эти файлы можно найти на GitHub).
Вы можете применить нашу функцию к ним всем, чтобы получить 3 отчета.
automate_excel('sales_january.xlsx')
automate_excel('sales_february.xlsx')
automate_excel('sales_march.xlsx')
Или можно сначала объединить эти три отчета с помощью pd.concat(), а затем применить функцию только один раз.
# read excel files
excel_file_1 = pd.read_excel('sales_january.xlsx')
excel_file_2 = pd.read_excel('sales_february.xlsx')
excel_file_3 = pd.read_excel('sales_march.xlsx')
# concatenate files
new_file = pd.concat([excel_file_1,
                      excel_file_2,
                      excel_file_3], ignore_index=True)
# export file
new_file.to_excel('sales_2021.xlsx')
# apply function
automate_excel('sales_2021.xlsx')
Заключение
Код на Python, который мы написали в этом руководстве, можно запускать на вашем компьютере по расписанию. Для этого нужно просто использовать планировщик задач или crontab. Вот и все!
В этой статье мы рассмотрели, как автоматизировать создание базового отчета в Excel. В дальнейшем вы сможете создавать и более сложные отчеты. Надеемся, это упростит вашу жизнь. Успехов в написании кода!
Перевод статьи «A Simple Guide to Automate Your Excel Reporting with Python».
Excel is a surprisingly common tool for data analysis.
Data analysts can readily modify, examine, and display huge amounts of data with Excel, which makes it simpler to gain insights and make wise choices.
Excel’s versatility lets users carry out a variety of data analysis activities, from straightforward math operations to intricate statistical analysis. Also, Excel offers automation through the use of third-party programs like Python or the built-in programming language VBA.
Excel is frequently used for data analysis across a range of industries, including banking, healthcare, and marketing, thanks to its versatility and usability.
But as a data analyst, you might often find yourself repeating mundane tasks on a daily basis when working with Excel.
These tasks may include copying and pasting data, formatting cells, and creating charts, among others. Over time, this can become monotonous and time-consuming, leaving you with less time to focus on more important aspects of data analysis, such as identifying trends, outliers, and insights.
This is why automating Excel using Python can be a game-changer, helping you streamline your workflows and free up time for more meaningful analysis.
In this tutorial, I’ll show you some helpful ways to create, update, and analyze Excel spreadsheets using Python programming. Let’s dive in.
How to Merge Two Separate Spreadsheets with Python
Data analysts often have to work on many spreadsheets, which can become hectic when you have to merge those files together.
The code below helps you merge two separate files together.
import pandas as pd

# Read in the two Excel files

file1 = pd.read_excel('file1.xlsx')file2 = pd.read_excel('file2.xlsx')

# Merge the two files using the concat() method
merged_file = pd.concat([file1, file2], ignore_index=True)

# Write the merged file to a new Excel file
merged_file.to_excel('merged_file.xlsx', index=False)
In this code, we first import the Pandas library, which we’ll use to read in and manipulate the Excel files.
We then use the read_excel() method to read in both file1.xlsx and file2.xlsx. Next, we use the concat() method to merge the two files together. The ignore_index=True argument ensures that the index values from both files are reset, so we don’t end up with duplicate index values in the merged file.
Finally, we use the to_excel() method to write the merged file to a new Excel file named merged_file.xlsx. We also set index=False to ensure that the index column is not included in the output file.
How to Import and Export Data with Python
This task involves using Python libraries such as Pandas to read Excel files into a DataFrame object. You can then manipulate it and analyze it using Python.
You can also export data from Python back into an Excel file using the same libraries.
import pandas as pd
# Import Excel file

df = pd.read_excel('filename.xlsx', sheet_name='Sheet1')

# Export to Excel file
df.to_excel('new_filename.xlsx', index=False)
The given code imports the Pandas library and reads an Excel file named «filename.xlsx» from Sheet1 of the workbook, storing the data in a Pandas dataframe named «df». The dataframe is then exported to a new Excel file named «new_filename.xlsx» using the «to_excel» method. The «index=False» parameter is used to exclude row indexing in the output file.
Essentially, the code copies the contents of the original Excel file to a new file using Pandas.
How to Clean and Transform Data using Python
This task involves using Python libraries such as Pandas to clean and transform data in Excel.
This may include removing duplicates, filtering data based on specific criteria, and performing calculations on the data.
import pandas as pd

# Remove duplicates
df = df.drop_duplicates()

# Filter data
df = df[df['column_name'] > 10]

# Perform calculations
df['new_column'] = df['column1'] + df['column2']
The code snippet above performs data cleaning and manipulation tasks on a Pandas dataframe named ‘df’ using the Pandas library.
Firstly, it removes duplicate rows from ‘df’ using the «drop_duplicates» method. Secondly, it filters the ‘df’ dataframe by selecting rows where the value in the ‘column_name’ column is greater than 10 and assigns the filtered result to a new dataframe called ‘data_df’.
Lastly, a new column named ‘new_column’ is added to ‘df’ which contains the sum of values from ‘column1’ and ‘column2’.
Overall, the code effectively cleans and manipulates the data by removing duplicates, filtering specific rows, and adding a new calculated column to the original dataframe.
How to Perform Data Analysis with Python
This task involves using Python libraries such as Pandas and NumPy to perform data analysis on Excel data.
This may include calculating summary statistics, such as mean and standard deviation, or creating custom reports by grouping data based on specific criteria.
import pandas as pd
import numpy as np

# Calculate summary statistics
df.describe()
# Create custom reports
df.pivot_table(values='column_name', index='category_name', columns='date')
The code utilizes the Pandas and NumPy libraries and performs data analysis and reporting tasks on a Pandas dataframe named «df».
Firstly, it calculates summary statistics for the numerical data in the dataframe using the «describe» method. This method generates valuable insights on the data’s distribution, central tendency, and dispersion.
Secondly, the code uses the «pivot_table» method to create customized reports from the dataframe. This method summarizes and aggregates the data in the dataframe and can produce tables in various formats.
In this code, it generates a new dataframe where the ‘column_name’ values are grouped by the ‘category_name’ and ‘date’ columns.
Overall, the code performs statistical analysis and reporting tasks on the dataframe to gain insights from the data.
How to Create Charts with Python
This task involves using Python libraries such as matplotlib or seaborn to create charts and graphs from Excel data.
You can customize these charts to display specific data and format them to meet specific requirements.
import pandas as pd
import matplotlib.pyplot as plt
# Create a bar chart
df.plot(kind='bar', x='category_name', y='sales')
plt.show()
# Create a scatter plot
df.plot(kind='scatter', x='column1', y='column2')plt.show()
The code imports two libraries, Pandas and matplotlib.pyplot using the aliases ‘pd’ and ‘plt’, respectively.
The Pandas «plot» method is then used to create two types of plots. The first type of plot is a bar chart that shows the relationship between the ‘category_name’ and ‘sales’ columns in the «df» dataframe.
The second type of plot is a scatter plot that shows the relationship between the ‘column1’ and ‘column2’ columns in the same dataframe. The code uses the parameters «kind=’bar'» for the bar chart and «kind=’scatter'» for the scatter plot to create the respective plots.
Lastly, the «show» method is called to display the plots on the screen. In summary, the code utilizes Pandas and matplotlib to create a bar chart and a scatter plot to visualize the data in the «df» dataframe.
How to Do Data Visualization in Python
This task involves using Python libraries such as Plotly and bokeh to create interactive data visualizations from Excel data.
These visualizations allow users to explore data in new ways, such as by zooming in on specific data points or filtering data based on specific criteria.
import pandas as pd
import plotly.express as px
# Create a heatmap
fig = px.imshow(df.corr())
fig.show()
# Create a line chart
fig = px.line(df, x='date', y='sales', color='category')
fig.show()
The code uses the Pandas and plotly.express libraries to create two types of visualizations. First, a heatmap plot is created using plotly.express’s «imshow» method that visualizes the correlation between columns in the «df» dataframe.
Second, a line chart is created using plotly.express’s «line» method that displays the relationship between the ‘date’ and ‘sales’ columns while differentiating between categories based on the ‘category’ column of the dataframe. Both plots are displayed using the «show» method.
How to Automate Report Generation with Python
This task involves using Python scripts to automate the process of generating reports from Excel data.
You can set up these scripts to run on a regular schedule, such as daily or weekly. They can also automatically update as new data becomes available.
import pandas as pd
# Create daily report
df_daily = df[df['date'] == '2022-01-01']
df_daily.to_excel('daily_report.xlsx', index=False)
# Create weekly report
df_weekly = df.groupby('category').sum()
df_weekly.to_excel('weekly_report.xlsx', index=False)
The code creates a daily report by creating a new dataframe «df_daily» that includes only the rows where the ‘date’ column equals ‘2022-01-01′. This is achieved by using Pandas’ boolean indexing feature.
Afterward, the «to_excel» method is used to export the filtered data to an Excel file named «daily_report.xlsx», without including the index column.
Next, the code creates a weekly report by grouping the «df» dataframe by the ‘category’ column and summing the values of all other columns. This is accomplished using the Pandas «groupby» and «sum» methods.
The result is saved in a new dataframe named «df_weekly». Lastly, the «to_excel» method is used to export the aggregated data to an Excel file named «weekly_report.xlsx», without including the index column.
In summary, the code creates two reports using the Pandas library. The first report is a daily report that includes only data from a specific date, and the second report is a weekly report that aggregates data by category. Both reports are exported to Excel files using the «to_excel» method.
How to Automate Repetitive Tasks with Macros and Scripts in Python
This task involves using Python to automate repetitive tasks in Excel, such as data entry or formatting. You can do this by creating macros or scripts that can execute automatically, or by using Python to interact with the Excel application directly.
import win32com.client as win32
# Open Excel file
excel = win32.gencache.EnsureDispatch('Excel.Application')
workbook = excel.Workbooks.Open(r'filename.xlsx')
# Run macro
excel.Application.Run('macro_name')
# Save and close Excel
 fileworkbook.Save()workbook.Close()excel.Quit()
The code uses the win32com.client module to interact with Microsoft Excel via the Windows API.
First, an instance of the Excel application is opened using the EnsureDispatch() method, and the specified Excel file is opened using the Workbooks.Open() method.
Next, a macro is executed using the Application.Run() method, passing the name of the macro as an argument.
Finally, the changes made to the Excel file are saved using the Save() method, the workbook is closed using the Close() method, and the Excel application is terminated using the Quit() method
How to Scrape Data with Python
This task involves using Python libraries such as requests and Beautiful Soup to scrape data from web pages or other sources and import it into Excel.
You can then analyze and manipulate this data using Python libraries such as Pandas.
import pandas as pd
import requests
from bs4 import BeautifulSoup
# Scrape data from web page
url = 'https://www.website.com/data'
response = requests.get(url)
soup = BeautifulSoup(response.text, 'html.parser')
table = soup.find('table')
df = pd.read_html(str(table))[0]
# Export to Excel file
df.to_excel('scraped_data.xlsx', index=False)
This code uses the requests library to send an HTTP GET request to the URL ‘https://www.example.com’. It then uses the BeautifulSoup library to parse the HTML content of the response into a BeautifulSoup object named ‘soup’.
You can then use BeautifulSoup methods such as find_all() to extract specific data from the HTML:
links = []for link in soup.find_all('a'): href = link.get('href') links.append(href)
This code finds all the anchor tags in the HTML and extracts the value of the ‘href’ attribute for each one, adding them to a list named ‘links’.
How to Use Python to Integrate Excel with Other Applications
This task involves using Python to integrate Excel with other applications, such as databases or web services.
You can do this using Python libraries such as pyodbc to connect to databases or by using APIs to connect to web services. This allows for seamless data transfer and analysis between different applications.
import pandas as pd
import pyodbc
# Connect to database
cnxn = pyodbc.connect('DRIVER={SQL Server};SERVER=server_name;DATABASE=db_name;UID=user_id;PWD=password')
# Read data from database
query = 'SELECT * FROM table_name'
df = pd.read_sql(query, cnxn)
# Export to Excel file
df.to_excel('database_data.xlsx', index=False)
The code establishes a connection to a SQL Server database using pyodbc.connect() method, where the driver, server name, database name, user ID, and password are provided as arguments.
Then, a SQL query is defined and executed to retrieve data from a table in the database using the pd.read_sql() method, where the SQL query and the connection object are provided as arguments. The retrieved data is then stored in a pandas DataFrame.
Finally, the data in the DataFrame is exported to an Excel file named «database_data.xlsx» using the to_excel() method, with the index column excluded from the export by setting the index parameter to False.
Conclusion
Python is a versatile language that you can use to automate many Excel tasks. You can also use various libraries such as Pandas, openpyxl, xlwings, and pyautogui to manipulate data, extract information, generate reports, and automate repetitive tasks.
Automation can save time and effort, reduce errors, and boost productivity. Python proficiency can be a valuable skill for any professional working with Excel, whether you’re a data or financial analyst. By learning Python, you can elevate your work to new heights.
Let’s connect on Twitter and LinkedIn. Thanks for reading!
Before you read this article and learn automation in Python….let’s watch a video of Christian Genco (a talented programmer and an entrepreneur) explaining the importance of coding by taking the example of automation.
You might have laughed loudly after watching this video and you surely, you might have understood the importance of automation in real life as well. Let’s come to the topic now…
We all know that Python is ruling all over the world, and we also know that Python is beginner’s friendly and it’s easy to learn in comparison to other languages. One of the best things you can do with Python is Automation.

Consider a scenario that you’re asked to create an account on a website for 30,000 employees. How would you feel? Surely you will be frustrated doing this task manually and repeatedly. Also, this is going to take too much time which is not a smart decision.
Now just imagine the life of employees who are into the data entry jobs. Their job is to take the data from tables such as Excel or Google Sheet and insert it somewhere else. They browse different websites and magazine, they collect the data from there, and then they insert it into the database. They also need to do the calculations for the entries.
Generally, the income is based on the performance in this job. More entries, higher salary (of course everyone wants a higher salary in their job).
But don’t you think that it’s boring to do the same kind of stuff repeatedly?
Now the question is….“How can I do it fast?”, “How can I automate my work?”
Instead of doing these kinds of tasks manually, just spend an hour coding and automate these kinds of stuff to make your life easier. You can automate your tedious task by just writing fewer lines of code in Python.
In this blog, we will create a small project to learn automation in Python. If you’re a beginner then you may prefer to watch some videos to learn the automation in Python and reading this blog might be a boring task for you but here we will go through step by step to explain everything in detail and to make things easier for you.
It will be great if you already know the core concept of Python. We will take an example of an Excel sheet with some entries, and we will learn the automation process. We are going to write a Python program that can process thousands of spreadsheets in under a second. Excited??? Let’s get started…
Intro of The Task
Processing or updating thousands of spreadsheets manually will take too much time. It may take hours, days, or even months. We will write a Python program to automate this task. We will work on a spreadsheet given in the below picture.
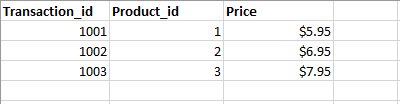
In this spreadsheet, we have the record for all kinds of transactions, but let’s say due to an error (human error or system error), the price for the product listed in the third column is wrong. Let’s say we need to decrease the price by 10% (multiply the price by 0.9 and recalculate the value). You can do this task manually by using a mathematical formula in the fourth column but it will take too much time (maybe 1 week or two weeks) if there are thousands of records.
We will write a python program to automate this process. Also, we will add a chart to it. Our python program will do this task for us in a matter of seconds.
Let’s Get Into The Coding Zone
To work on this Excel sheet we are going to use a library openpyxl. Create a folder in your directory, give it a name and install the openpyxl package by executing the following command in your terminal.
pip install openpyxl
Now we can import this package to work on our spreadsheet. Before that add the spreadsheet in your project folder. Now create a file app.py in your folder and write down the code given below.
Python
import openpyxl as xl
from openpyxl.chart import BarChart, Reference
wb = xl.load_workbook('python-spreadsheet.xlsx')
sheet = wb['Sheet1']
for row in range(2, sheet.max_row + 1):
    cell = sheet.cell(row, 3)
corrected_price = float(cell.value.replace('$','')) * 0.9
corrected_price_cell = sheet.cell(row, 4)
corrected_price_cell.value = corrected_price
values = Reference(sheet, min_row=2, max_row=sheet.max_row, min_col=4, max_col=4)
chart = BarChart()
chart.add_data(values)
sheet.add_chart(chart, 'e2')
wb.save('python-spreadsheet2.xlsx')
Let’s Understand the Above Code
We are going to explain the code step by step written above to understand the complete process.
Step 1. To work on our spreadsheet import openpyxl package (we have used xl alias to make our code cleaner and shorter). Also, to add a chart to our spreadsheet, we need to import two classes BarChart and Reference.
import openpyxl as xl from openpyxl.chart import BarChart, Reference
Step 2. Now we need to load the Excel workbook python-spreadhsheet.xlsx. Write down the code given below. wb returns the object and with this object, we are accessing Sheet1 from the workbook.
wb = xl.load_workbook('python-spreadsheet.xlsx')
sheet = wb['Sheet1']
Step 3. To access the entries from rows 2 to 4 in the third column (entry for price column) we need to add a for loop in it. We are saving this entry in a variable cell.
for row in range(2, sheet.max_row + 1):
cell = sheet.cell(row, 3)
Step 4. Now we need to calculate the corrected prices. So we are multiplying the values saved in the cell variable with 0.9. Once the calculation is done we need to add all the corrected prices in a new column (column 4). To add a new column we will get a reference to the cell in the given row but in the fourth column. Once the cell is created, we need to set the corrected price values in this cell (fourth column).
corrected_price = float(cell.value.replace('$','')) * 0.9
corrected_price_cell = sheet.cell(row, 4)
corrected_price_cell.value = corrected_price
Step 5. Half of the work is done. We have calculated the updated price, and we have added that in the fourth column. Now we need to add a chart to the current sheet. To create a chart we need to select a range of values.
In this project, we will select the values in the fourth column (updated prices) and we will use that in our chart (we just need a bunch of numbers to create a chart, so we have taken the example of the fourth column. This value can be anything as per requirement).
We need to use the reference class to select a range of values. We are going to add five arguments to this constructor. The first argument is the sheet we are working on. The next two arguments min_row = 2, and max_row= sheet.max_row will select the cells from row 2 to row 4. To select the entries from only column fourth we need to pass another two arguments min_col=4 and max_col=4. Store the result in the variable ‘values’.
values = Reference(sheet, min_row=2, max_row=sheet.max_row, min_col=4, max_col=4)
Step 6. Now we are ready to create a chart. We will create an instance ‘chart’ for the class BarChart. Once this is created add the values in this chart. After that add this chart to the sheet into row 2 and column 5 (e2).
chart = BarChart() chart.add_data(values) sheet.add_chart(chart, 'e2')
Step 7. Now we need to save all updated entries and the chart we have created in the above code. We will save this in a new file python-spreadsheet2.xlsx because we don’t’ want to accidentally overwrite the original file in case our program has a bug.
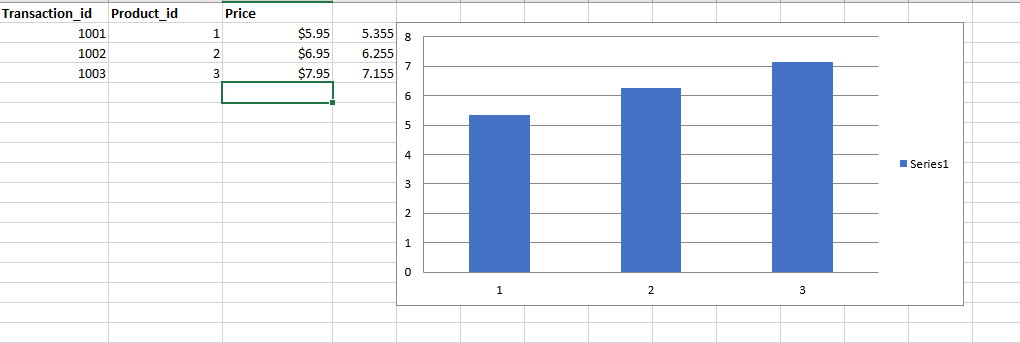
Run your program and you’re good to go. A newly updated file python-spreadhsheet2.xlsx will be created for you with updated prices and charts. Below is the screenshot for the same.
Step 8. Our program is complete but if you use the above code then it’s not going to automate the process of thousands of spreadsheets. This program is only relying on a specific file that is python-spreadsheet.xlsx.
To make it work for several spreadsheets we will reorganize this code, and we will move the code inside a function. This function will take the name of the file as an input and it will execute the process. Below is the updated code for the same.
Python
import openpyxl as xl
from openpyxl.chart import BarChart, Reference
def process_workbook(filename):
wb = xl.load_workbook(filename)
sheet = wb['Sheet1']
for row in range(2, sheet.max_row + 1):
cell = sheet.cell(row, 3)
corrected_price = float(cell.value.replace('$', '')) * 0.9
corrected_price_cell = sheet.cell(row, 4)
corrected_price_cell.value = corrected_price
values = Reference(sheet, min_row=2, max_row=sheet.max_row, min_col=4, max_col=4)
chart = BarChart()
chart.add_data(values)
sheet.add_chart(chart, 'e2')
wb.save(filename)
Github Link for the Code with Spreadsheet Attached: Python Automation
Final Thought
That was just one example of using Python to automate repetitive boring tasks. But remember that automation is not just about Excel spreadsheets. There are so many things we can automate. You can search on various sites such as Github and you can automate a lot of things with Python.
Время на прочтение
6 мин
Количество просмотров 19K

Хотя в среднем для каждодневных задач автоматизация не требуется, бывают случаи, когда она может быть необходима. Создание множества диаграмм, рисунков, таблиц и отчётов может утомить, если вы работаете вручную. Так быть не должно. Специально к старту нового потока курса Fullstack-разработчик на Python делимся с вами кейсом постройки конвейера на Python, с помощью которого Excel и Word легко интегрировать: нужно создать таблицы в Excel, а затем перенести результаты в Word, чтобы практически мгновенно получить отчёт.
Openpyxl
Встречайте Openpyxl — возможно, одну из самых универсальных связок [биндингов] с Python, которая сделает взаимодействие с Excel очень простым. Вооружившись этой библиотекой, вы сможете читать и записывать все нынешние и устаревшие форматы Excel, то есть xlsx и xls.
Openpyxl позволяет заполнять строки и столбцы, выполнять формулы, создавать 2D и 3D диаграммы, маркировать оси и заголовки, а также предоставляет множество других возможностей, которые могут пригодиться.
И самое важное — этот пакет позволяет вам перебирать бесконечное количество строк и столбцов в Excel, тем самым избавляя вас от всех этих надоедливых вычислений и построения графиков, которые вам приходилось делать раньше.
Python-docx
Затем идёт Python-docx, этот пакет для Word — то же самое, что Openpyxl для Excel. Если вы ещё не изучили его документацию, вам, вероятно, стоит взглянуть на неё. Python-docx — без преувеличения один из самых простых и понятных мне наборов инструментов, с которыми я работал с тех пор, как начал работать с самим Python.
Python-docx позволяет автоматизировать создание документов путём автоматической вставки текста, заполнения таблиц и рендеринга изображений в отчёт без каких-либо накладных расходов. Без лишних слов давайте создадим наш собственный автоматизированный конвейер. Запустите Anaconda (или любую другую IDE по вашему выбору) и установите эти пакеты:
pip install openpyxl
pip install python-docx
Автоматизация Microsoft Excel
Сначала загрузим уже созданный лист Excel, вот так:
workbook = xl.load_workbook('Book1.xlsx')
sheet_1 = workbook['Sheet1']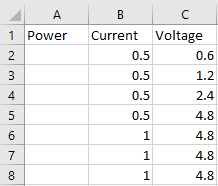
Теперь переберём все строки в нашей таблице, чтобы вычислить и вставить значения мощности, умножив ток на напряжение:
for row in range(2, sheet_1.max_row + 1):
    current = sheet_1.cell(row, 2)
    voltage = sheet_1.cell(row, 3)
    power = float(current.value) * float(voltage.value)
    power_cell = sheet_1.cell(row, 1)
    power_cell.value = power
Как только это будет сделано, мы используем рассчитанные значения мощности, чтобы сгенерировать линейную диаграмму, которая будет вставлена в указанную ячейку, код показан ниже:
values = Reference(sheet_1, min_row = 2, max_row = sheet_1.max_row, min_col = 1, max_col = 1)
chart = LineChart()
chart.y_axis.title = 'Power'
chart.x_axis.title = 'Index'
chart.add_data(values)
sheet_1.add_chart(chart, 'e2')
workbook.save('Book1.xlsx')
Извлечение диаграммы
Теперь, когда мы сгенерировали нашу диаграмму, нам нужно извлечь её как изображение, чтобы мы могли использовать её в нашем отчёте Word. Сначала укажем точное местоположение файла Excel, а также место, где должно быть сохранено изображение диаграммы:
input_file = "C:/Users/.../Book1.xlsx"
output_image = "C:/Users/.../chart.png"
Затем откройте электронную таблицу, используя следующий метод:
operation = win32com.client.Dispatch("Excel.Application")
operation.Visible = 0
operation.DisplayAlerts = 0
workbook_2 = operation.Workbooks.Open(input_file)
sheet_2 = operation.Sheets(1)
Позднее вы сможете перебирать все объекты диаграммы в электронной таблице (если их несколько) и сохранять их в указанном месте:
for x, chart in enumerate(sheet_2.Shapes):
    chart.Copy()
    image = ImageGrab.grabclipboard()
    image.save(output_image, 'png')
    pass
workbook_2.Close(True)
operation.Quit()
Автоматизация Microsoft Word
Теперь, когда у нас есть сгенерированное изображение диаграммы, мы должны создать шаблон документа, который в принципе является обычным документом Microsoft Word (.docx), сформированным именно так, как мы хотим: отчёт содержит шрифты, размеры шрифтов, структуру и форматирование страниц.
Теперь всё, что нам нужно сделать, — создать плейсхолдеры для сгенерированного нами контента, то есть табличные значения и изображения, и объявить их с именами переменных, как показано ниже.

Любой сгенерированный контент, включая текст и изображения, может быть объявлен в двойных фигурных скобках {{ variable_name }}. В случае таблиц вам нужно создать таблицу со строкой шаблона со всеми включёнными столбцами, затем нужно добавить одну строку вверху и одну строку ниже со следующей нотацией:
Первая строка:
{%tr for item in variable_name %}
Последняя строка:
{%tr for item in variable_name %}
На рисунке выше — имена переменных:
-
table_contents для словаря Python, в котором будут храниться наши табличные данные;
-
Index для ключей словаря (первый столбец);
-
Power, Current и Voltage для значений словаря (второй, третий и четвёртый столбцы).
Затем импортируем наш шаблонный документ в Python и создаём словарь, в котором будут храниться значения нашей таблицы:
template = DocxTemplate('template.docx')
table_contents = []
for i in range(2, sheet_1.max_row + 1):
    table_contents.append({
        'Index': i-1,
        'Power': sheet_1.cell(i, 1).value,
        'Current': sheet_1.cell(i, 2).value,
        'Voltage': sheet_1.cell(i, 3).value
        })
Далее импортируем ранее созданное в Excel изображение диаграммы и создадим другой словарь для создания экземпляров всех объявленных в документе шаблона переменных-заполнителей:
image = InlineImage(template,'chart.png',Cm(10))
context = {
    'title': 'Automated Report',
    'day': datetime.datetime.now().strftime('%d'),
    'month': datetime.datetime.now().strftime('%b'),
    'year': datetime.datetime.now().strftime('%Y'),
    'table_contents': table_contents,
    'image': image
    }
И, наконец, визуализируем отчёт с нашей таблицей значений и изображением диаграммы:
template.render(context)
template.save('Automated_report.docx')
Результаты
И вот — автоматически сгенерированный отчёт Microsoft Word с числами и созданной в Microsoft Excel диаграммой. Мы получили полностью автоматизированный конвейер, его можно использовать, чтобы создать столько таблиц, диаграмм и документов, сколько вам потребуется.

Исходный код
import openpyxl as xl
from openpyxl.chart import LineChart, Reference

import win32com.client
import PIL
from PIL import ImageGrab, Image
import os
import sys

from docx.shared import Cm
from docxtpl import DocxTemplate, InlineImage
from docx.shared import Cm, Inches, Mm, Emu
import random
import datetime
import matplotlib.pyplot as plt


######## Generate automated excel workbook ########

workbook = xl.load_workbook('Book1.xlsx')
sheet_1 = workbook['Sheet1']

for row in range(2, sheet_1.max_row + 1):
    current = sheet_1.cell(row, 2)
    voltage = sheet_1.cell(row, 3)
    power = float(current.value) * float(voltage.value)
    power_cell = sheet_1.cell(row, 1)
    power_cell.value = power

values = Reference(sheet_1, min_row = 2, max_row = sheet_1.max_row, min_col = 1, max_col = 1)
chart = LineChart()
chart.y_axis.title = 'Power'
chart.x_axis.title = 'Index'
chart.add_data(values)
sheet_1.add_chart(chart, 'e2')

workbook.save('Book1.xlsx')


######## Extract chart image from Excel workbook ########

input_file = "C:/Users/.../Book1.xlsx"
output_image = "C:/Users/.../chart.png"

operation = win32com.client.Dispatch("Excel.Application")
operation.Visible = 0
operation.DisplayAlerts = 0

workbook_2 = operation.Workbooks.Open(input_file)
sheet_2 = operation.Sheets(1)

for x, chart in enumerate(sheet_2.Shapes):
    chart.Copy()
    image = ImageGrab.grabclipboard()
    image.save(output_image, 'png')
    pass

workbook_2.Close(True)
operation.Quit()


######## Generating automated word document ########

template = DocxTemplate('template.docx')

#Generate list of random values
table_contents = []

for i in range(2, sheet_1.max_row + 1):

    table_contents.append({
        'Index': i-1,
        'Power': sheet_1.cell(i, 1).value,
        'Current': sheet_1.cell(i, 2).value,
        'Voltage': sheet_1.cell(i, 3).value
        })

#Import saved figure
image = InlineImage(template,'chart.png',Cm(10))

#Declare template variables
context = {
    'title': 'Automated Report',
    'day': datetime.datetime.now().strftime('%d'),
    'month': datetime.datetime.now().strftime('%b'),
    'year': datetime.datetime.now().strftime('%Y'),
    'table_contents': table_contents,
    'image': image
    }

#Render automated report
template.render(context)
template.save('Automated_report.docx')
Вот мой репозиторий на GitHub с шаблоном документа и исходным кодом для этого туториала. А вот ссылка на курс Fullstack-разработчик на Python, который сделает из вас настоящего универсального солдата от кодинга.

Узнайте, как прокачаться и в других специальностях или освоить их с нуля:
-
Профессия Data Scientist
-
Профессия Data Analyst
-
Курс по Data Engineering
Другие профессии и курсы
Data Analysis forms a crucial part of gaining valuable insights from your customers. Multiple organizations are trying innovative ways to simplify the process of Data Analysis. Some are trying to completely automate this process whereas others are using multiple tools to set up the same. Another innovative technique used by companies to perform Data Analysis is linking their data source with a programming language and having it automate their Data Analysis. One such type of automation is Python Excel Automation.
Python is the most popularly used programming language today and has limitless applications across many fields. Its flexible and dynamic capabilities make it the ideal choice when it comes to deployment and maintenance. MS Excel is one of the popular Microsoft applications that operate in the form of a spreadsheet and is used to save and analyze numerical data. It was one of the first tools used by companies all around the world to analyze data to gain insights. It is also termed a traditional BI (Business Intelligence) tool. By setting up Python Excel Automation, you can transfer data automatically from various sources to multiple destinations seamlessly.
This article provides a step-by-step guide to help you set up Python Excel Automation. It also gives you an overview of Python and Excel to better understand these technologies individually. Read along to find out how you can set up Python Excel Automation for your organization.
Table of Contents
- Prerequisites
- Introduction to Python
- Introduction to MS Excel
- Steps to Set Up Python Excel Automation
- Step 1: Analyzing the Excel Dataset
- Step 2: Making Pivot Tables using Pandas
- Step 3: Designing the Reports using Openpyxl
- Step 4: Automating the Report with Python
- Step 5: Scheduling the Python Script
- Conclusion
Prerequisites
- Working knowledge of MS Excel.
- Strong Technical Foundation in Python.
- Knowledge of popular Python Libraries.
Introduction to Python
Python is a high-level programming language that uses an interpreter to process code. It was developed by Guido Von Rossum and was released in 1991. Its seamless code readability and dynamic nature make it an excellent choice when coding. It is used in a wide variety of fields including Machine Learning, Artificial Intelligence, Server-Side Scripting, Data Analytics, and Deep Learning. It was developed by Python Software Foundation and its stable release was on 3 May 2021.
Python is an Interactive, Interpreted, Object-Oriented programming language that incorporates multiple attributes like Exceptions, Modules, Dynamic Typing, Dynamic Binding, Classes, High-level Dynamic Data Types, etc. It can also be used to make system calls to almost all well-known Operating Systems.
Key Features of Python
Python houses a wide range of features that differentiates it from other programming languages. Some of those features are given below:
- It is free and open-source. You can download Python from their official website. It can be downloaded and installed easily. As Python is open-source, users that have a good technical background can make changes to the code as per business use cases and product requirements.
- Python is a beginner-friendly language and hence, most people with basic programming knowledge can easily learn the Python syntax and start coding on it.
- While using Python, developers do not need to have any information on the System Architecture or manage memory usage manually. The Python Interpreter handles this automatically.
- Python is highly robust and portable. This means that the Python code written on one computer can easily be transferred to another system and can run without any issues.
- Python also supports Object-Oriented Programming that allows users to write readable and reusable code.
With Python Excel Automation, you can use the portable and robust nature of Python in tandem with Excel to improve your Data Analysis efficiently.
Introduction to MS Excel
Microsoft Excel is a spreadsheet program developed by Microsoft for Windows, macOS, Android, and iOS. It was released in 1987 and has been used by multiple calculations, graphic tools, pivot tables, and a macro programming language like Visual Basic for Applications. MS Excel has gained popularity over these years because the data is easy to save and data can be added or removed without any discomfort.
Key Features of MS Excel
MS Excel has many unique features that make it a good choice over other spreadsheet software. Some of those features are given below:
- MS Excel allows you to create headers and footers in the spreadsheet document and allows users to protect their data by providing passwords for their data.
- It supports filtering where you can find the required data in your workbook and replace it with the value you need.
- MS Excel supports Data Sorting, thereby allowing you to sort your data in ascending or descending order.
- It supports multiple variations of formulae, so you can perform all types of calculations easily. It also supports multiple types of Data Visualization and charts.
- You can perform Formula Auditing to form relationships between cells and tables.
With Python Excel Automation, you can use the sorting and robust nature of MS Excel with a powerful programming language like Python to automate reporting seamlessly.
To learn more about MS Excel, click this link.
Hevo Data, a No-code Data Pipeline helps to load data from any data source such as Databases, SaaS applications, Cloud Storage, SDK,s, and Streaming Services and simplifies the ETL process. It supports MS Excel and Python, along with 150+ data sources (including 30+ free data sources), and is a 3-step process by just selecting the data source, providing valid credentials, and choosing the destination. Hevo not only loads the data onto the desired Data Warehouse/destination but also enriches the data and transforms it into an analysis-ready form without having to write a single line of code.
Its completely automated pipeline offers data to be delivered in real-time without any loss from source to destination. Its fault-tolerant and scalable architecture ensures that the data is handled in a secure, consistent manner with zero data loss and supports different forms of data. The solutions provided are consistent and work with different BI tools as well.
Check out why Hevo is the Best:
- Secure: Hevo has a fault-tolerant architecture that ensures that the data is handled in a secure, consistent manner with zero data loss.
- Schema Management: Hevo takes away the tedious task of schema management & automatically detects the schema of incoming data and maps it to the destination schema.
- Minimal Learning: Hevo, with its simple and interactive UI, is extremely simple for new customers to work on and perform operations.
- Hevo Is Built To Scale: As the number of sources and the volume of your data grows, Hevo scales horizontally, handling millions of records per minute with very little latency.
- Incremental Data Load: Hevo allows the transfer of data that has been modified in real-time. This ensures efficient utilization of bandwidth on both ends.
- Live Support: The Hevo team is available round the clock to extend exceptional support to its customers through chat, email, and support calls.
- Live Monitoring: Hevo allows you to monitor the data flow and check where your data is at a particular point in time.
Simplify your Python Data Analysis with Hevo today! Sign up here for a 14-day free trial!
Now that you have a good understanding of Python and MS Excel, it is now time to understand the steps to set up Python Excel Automation. You can follow the below steps to set Python Excel Automation up:
- Step 1: Analyzing the Excel Dataset
- Step 2: Making Pivot Tables using Pandas
- Step 3: Designing the Reports using Openpyxl
- Step 4: Automating the Report with Python
- Step 5: Scheduling the Python Script
Step 1: Analyzing the Excel Dataset
The first step in Python Excel Automation is to analyze the Dataset. The Dataset used in this tutorial is a Sales Dataset. This Dataset is also available on Kaggle. As this Dataset is in .csv format, you need to change it to .xslx format. The data will be used to create the below report after setting up our Python Excel Automation.
Step 2: Making Pivot Tables using Pandas
The next step in Python Excel Automation is to design Pivot Tables. Before doing that, you need to import the following libraries:
import pandas as pd
import openpyxl
from openpyxl import load_workbook
from openpyxl.styles import Font
from openpyxl.chart import BarChart, Reference
import string
Pandas is used to read the Excel file, create the Pivot table and export it to Excel. You can then use the Openpyxl library in Python to write Excel formulas, make charts and spreadsheets in Python.
To read your Excel file, make sure that the file is in the same place where your Python script is located and run the following code in Excel:
excel_file = pd.read_excel('supermarket_sales.xlsx')
excel_file[['Gender', 'Product line', 'Total']]
To create the pivot table, you need to access the excel_file data frame that you created previously. You can use the “.pivot_table()” to create the table. If you want to create a pivot table to show the total money split up for males and females you can run the below code:
report_table = excel_file.pivot_table(index='Gender',columns='Product line',values='Total',aggfunc='sum').round(0)Finally, to export the Pivot Table, we will use the “.to_excel()” method as shown below:
report_table.to_excel('report_2021.xlsx',sheet_name='Report',startrow=4)The Excel folder is now exported in the same location as your Python scripts.
Step 3: Designing the Reports using Openpyxl
The next step in Python Excel Automation is to design the reports. To make the report, you need to use the “load_workbook” method, that is imported from Openpyxl and save it using the “.save()” method. This is shown below:
wb = load_workbook('report_2021.xlsx')
sheet = wb['Report']
# cell references (original spreadsheet)
min_column = wb.active.min_column
max_column = wb.active.max_column
min_row = wb.active.min_row
max_row = wb.active.max_row
Python Excel Automation allows you to create Excel charts using Pivot Tables. To create an Excel chart using a Pivot Table, you need to use the Barchart Module and to identify the position of the data and category values, you can use the Reference Module. Both of these were imported before in Step 1. You can write Excel-based formulas in Python, the same way you write them in Excel. An example of this is shown below:
sheet['B7'] = '=SUM(B5:B6)'
sheet['B7'].style = 'Currency
Step 4: Automating the Report with Python
The next step in Python Excel Automation is to automate your report. You can write all the code into one function so that it will be easy to automate the report. That code is shown below:
import pandas as pd
import openpyxl
from openpyxl import load_workbook
from openpyxl.styles import Font
from openpyxl.chart import BarChart, Reference
import string

def automate_excel(file_name):
   """The file name should have the following structure: sales_month.xlsx"""
   # read excel file
   excel_file = pd.read_excel(file_name)
   # make pivot table
   report_table = excel_file.pivot_table(index='Gender', columns='Product line', values='Total', aggfunc='sum').round(0)
   # splitting the month and extension from the file name
   month_and_extension = file_name.split('_')[1]
   # send the report table to excel file
   report_table.to_excel(f'report_{month_and_extension}', sheet_name='Report', startrow=4)
   # loading workbook and selecting sheet
   wb = load_workbook(f'report_{month_and_extension}')
   sheet = wb['Report']
   # cell references (original spreadsheet)
   min_column = wb.active.min_column
   max_column = wb.active.max_column
   min_row = wb.active.min_row
   max_row = wb.active.max_row
   # adding a chart
   barchart = BarChart()
   data = Reference(sheet, min_col=min_column+1, max_col=max_column, min_row=min_row, max_row=max_row) #including headers
   categories = Reference(sheet, min_col=min_column, max_col=min_column, min_row=min_row+1, max_row=max_row) #not including headers
   barchart.add_data(data, titles_from_data=True)
   barchart.set_categories(categories)
   sheet.add_chart(barchart, "B12") #location chart
   barchart.title = 'Sales by Product line'
   barchart.style = 2 #choose the chart style
   # applying formulas
   # first create alphabet list as references for cells
   alphabet = list(string.ascii_uppercase)
   excel_alphabet = alphabet[0:max_column] #note: Python lists start on 0 -> A=0, B=1, C=2. #note2 the [a:b] takes b-a elements
   # sum in columns B-G
   for i in excel_alphabet:
       if i!='A':
           sheet[f'{i}{max_row+1}'] = f'=SUM({i}{min_row+1}:{i}{max_row})'
           sheet[f'{i}{max_row+1}'].style = 'Currency'
   sheet[f'{excel_alphabet[0]}{max_row+1}'] = 'Total'
   # getting month name
   month_name = month_and_extension.split('.')[0]
   # formatting the report
   sheet['A1'] = 'Sales Report'
   sheet['A2'] = month_name.title()
   sheet['A1'].font = Font('Arial', bold=True, size=20)
   sheet['A2'].font = Font('Arial', bold=True, size=10)
   wb.save(f'report_{month_and_extension}')
   return
Step 5: Scheduling the Python Script
The final step in Python Excel Automation is to run the Python script at different schedules as per data requirements. You just need to use the task scheduler or cron on Windows and Mac respectively.
That’s it! You have successfully set up Python Excel Automation in 5 easy steps!
Conclusion
This article gave you a step-by-step guide on setting up Python Excel Automation. It also gave you an overview of both Python and MS Excel along with their features. Overall, Python Excel Automation is an innovative process that you can use to create visual reports on Python just the same way as you would on Excel seamlessly. Organizations can leverage Python Excel Automation to leverage their business tasks according to their needs.
In case you want to integrate data from data sources like Python and MS Excel into your desired Database/destination and seamlessly visualize it in a BI tool of your choice, then Hevo Data is the right choice for you! It will help simplify the ETL and management process of both the data sources and destinations.
Want to take Hevo for a spin? Sign up here for a 14-day free trial and experience the feature-rich Hevo suite first hand.
Share your experience of setting up Python Excel Automation in the comments section below.