
![]()
Download Article
![]()
Download Article
This wikiHow teaches you how to automate the reporting of data in Microsoft Excel. For external data, this wikiHow will teach you how to query and create reports from any external data source (MySQL, Postgres, Oracle, etc) from within your worksheet using Excel plugins that link your worksheet to external data sources.
For data already stored in an Excel worksheet, we will use macros to build reports and export them in a variety of file types with the press of one key. Luckily, Excel comes with a built-in step recorder which means you will not have to code the macros yourself.
-

1
If the data you need to report on is already stored, updated, and maintained in Excel, you can automate reporting workflows using Macros. Macros are a built in function that allow you to automate complex and repetitive tasks.
-
2
Open Excel. Double-click (or click if you’re on a Mac) the Excel app icon, which resembles a white «X» on a green background, then click Blank Workbook on the templates page.
- On a Mac, you may have to click File and then click New Blank Workbook in the resulting drop-down menu.
- If you already have an Excel report that you want to automate, you’ll instead double-click the report’s file to open it in Excel.
Advertisement
-
3
Enter your spreadsheet’s data if necessary. If you haven’t added the column labels and numbers for which you want to automate results, do so before proceeding.
-
4
Enable the Developer tab. By default, the Developer tab doesn’t show up at the top of the Excel window. You can enable it by doing the following depending on your operating system:
-
Windows — Click File, click Options, click Customize Ribbon on the left side of the window, check the «Developer» box in the lower-right side of the window (you may first have to scroll down), and click OK.[1]
-
Mac — Click Excel, click Preferences…, click Ribbon & Toolbar, check the «Developer» box in the «Main Tabs» list, and click Save.[2]
-
Windows — Click File, click Options, click Customize Ribbon on the left side of the window, check the «Developer» box in the lower-right side of the window (you may first have to scroll down), and click OK.[1]
-
5
Click Developer. This tab should now be at the top of the Excel window. Doing so brings up a toolbar at the top of the Excel window.
-
6
Click Record Macro. It’s in the toolbar. A pop-up window will appear.
-
7
Enter a name for the macro. In the «Macro name» text box, type in the name for your macro. This will help you identify the macro later.
- For example, if you’re creating a macro that will make a chart out of your available data, you might name it «Chart1» or similar.
-
8
Create a shortcut key combination for the macro. Press the ⇧ Shift key along with another key (e.g., the T key) to create the keyboard shortcut. This is what you’ll use to run your macro later.
- On a Mac, the shortcut key combination will end up being ⌥ Option+⌘ Command and your key (e.g., ⌥ Option+⌘ Command+T).
-
9
Store the macro in the current Excel document. Click the «Store macro in» drop-down box, then click This Workbook to ensure that the macro will be available for anyone who opens the workbook.
- You’ll have to save the Excel file in a special format for the macro to be saved.
-
10
Click OK. It’s at the bottom of the window. Doing so will save your macro settings and place you in record mode. Any steps you take from now until you stop the recording will be recorded.
-
11
Perform the steps that you want to automate. Excel will track every click, keystroke, and formatting option you enter and add them to the macro’s list.
- For example, to select data and create a chart out of it, you would highlight your data, click Insert at the top of the Excel window, click a chart type, click the chart format that you want to use, and edit the chart as needed.
- If you wanted to use the macro to add values from cells A1 through A12, you would click an empty cell, type in =SUM(A1:A12), and press ↵ Enter.
-
12
Click Stop Recording. It’s in the Developer tab’s toolbar. This will stop your recording and save any steps you took during the recording as an individual macro.
-
13
Save your Excel sheet as a macro-enabled file. Click File, click Save As, and change the file format to xlsm instead of xls. You can then enter a file name, select a file location, and click Save.
- If you don’t do this, the macro won’t be saved as part of the spreadsheet, meaning that other people on different computers won’t be able to use your macro if you send the workbook to them.
-
14
Run your macro. Press the key combination which you created as part of the macro to do so. You should see your spreadsheet automate according to your macro’s steps.
- You can also run a macro by clicking Macros in the Developer tab, selecting your macro’s name, and clicking Run.


Advertisement
-
1
Download Kloudio’s Excel plugin from Microsoft AppSource. This will allow you to create a persistent connection between an external database or data source and your workbook. This plugin also works with Google Sheets.
-
2
Create a connection between your worksheet and your external data source by clicking the + button on the Kloudio portal. Type in the details of your database (database type, credentials) and select any security/encryption options if working with confidential or company data.
-
3
Once you’ve created a connection between your worksheet and your database, you will be able to query and build reports from external data without leaving Excel. Create your custom reports from the Kloudio portal and then select them from the drop-down menu in Excel. You can then apply any additional filters and choose the frequency that the report will refresh (so you can have your sales spreadsheet update automatically every week, day, or even hour.)
-
4
In addition, you can also input data into your connected worksheet and have the data update your external data source. Create an upload template from the Kloudio portal and you will be able to manually or automatically upload changes in your spreadsheet to your external data source.


Advertisement
Ask a Question
200 characters left
Include your email address to get a message when this question is answered.
Submit
Advertisement
Video
-
Only download Excel plugins from Microsoft AppSource, unless you trust the third party provider.
-
Macros can be used for anything from simple tasks (e.g., adding values or creating a chart) to complex ones (e.g., calculating your cell’s values, creating a chart from the results, labeling the chart, and printing the result).
-
When opening a spreadsheet with your macro included, you may have to click Enable Content in a yellow banner at the top of the window before you can use the macro.
Thanks for submitting a tip for review!
Advertisement
-
Macros can be used maliciously (e.g., to delete files on your computer). Don’t run macros from untrustworthy sources.
-
Macros will implement literally every step you make while recording. Make sure that you don’t accidentally enter the incorrect value, open a program you don’t want to use, or delete a file.
Advertisement
About This Article
Article SummaryX
1. Enable the Developer tab.
2. Click the Developer tab.
3. Click Record Macro.
4. Create a shortcut key.
5. Store the content in the current workbook.
6. Click OK.
7. Perform the steps you want to automate.
8. Click Stop Recording.
9. Use the shortcut key to run the same steps.
Did this summary help you?
Thanks to all authors for creating a page that has been read 543,765 times.
Is this article up to date?
Follow these steps to record a macro.
- On the Developer tab, in the Code group, click Record Macro.
- In the Macro name box, enter a name for the macro.
- To assign a keyboard shortcut to run the macro, in the Shortcut key box, type any letter (both uppercase or lowercase will work) that you want to use.
Contents
- 1 How do I create an automated report in Excel?
- 2 How do I automate a report in Excel VBA?
- 3 How do I create a macro report in Excel?
- 4 How do you automate data reports?
- 5 How can we automate reports?
- 6 How do you automate a report in Excel using Python?
- 7 What is VBA Automation?
- 8 How do I create an automatic report from a macro?
- 9 How do I create a macro report?
- 10 How do you write a macro report?
- 11 How do you automate monthly reports?
- 12 What is report automation?
- 13 What are automated reporting tools?
- 14 What is automated report generation?
- 15 What is the best reporting tool?
- 16 Can I use Python instead of VBA in Excel?
- 17 Can we automate Excel using Python?
- 18 Is Python better than Excel?
- 19 What is difference between macro and VBA?
- 20 What is VBA in Excel?
How do I create an automated report in Excel?
- On a Mac, you may have to click File and then click New Blank Workbook in the resulting drop-down menu.
- If you already have an Excel report that you want to automate, you’ll instead double-click the report’s file to open it in Excel.
How do I automate a report in Excel VBA?
Automated Excel report with Task Scheduler and Simple VBA…
- Open the Raw_data.
- In Report_Template.
- We have to change the pivot table data source in sheet “Report” so the pivot table would include all the data from sheet “Data”.
- We have to refresh the pivot table to apply the new data.
How do I create a macro report in Excel?
Go to the “View” tab of the ribbon and click the tiny arrow below the “Macros” button. 2. Then click “Record Macro” 3. Type in the name of your macro and click “OK” to start the recording.
How do you automate data reports?
Step-by-Step: How to Automate Your Reporting Process
- Step 1: Preparation.
- Step 2: Creating a Campaign.
- Step 3: Connecting Your Data Sources.
- Step 4: Choose Between Sending Reports or Creating a Dashboard.
- Step 5: Customize Your Reports or Dashboards.
- Step 6: White Label Your Reporting with Your Agency’s Branding.
Our Pick of the Best Options for Automated Reports
- Built-in reporting for your CRM and key apps.
- Google Analytics.
- Google Sheets.
- Google Data Studio.
- Supermetrics.
How do you automate a report in Excel using Python?
Table of Contents
- The Dataset.
- Make a Pivot Table with Pandas. – Importing libraries.
- Make The Report with Openpyxl. – Creating row and column reference.
- Automating the Report with a Python Function (Full code) – Applying the function to a single Excel file.
- Schedule the Python Script to Run Monthly, Weekly, or Daily.
What is VBA Automation?
VBA stands for Visual Basic for Applications.VBA enables you to automate various activities in Excel like generating reports, preparing charts & graphs, doing calculations, etc. This automation activity is also often referred as Macro.
How do I create an automatic report from a macro?
Report Automation Template Using Excel Macro
- Create Shapes in the spreadsheet. Start the Excel application.
- Insert an embedded object in the spreadsheet. On the insert tab click object to create a Word document embedded object.
- Assign a macro for objects.
How do I create a macro report?
Go to Developer Tab à Macros to use the Macros Menu. Enter a Macro Name for the report and click Create Button. After all these steps are done now you are all set to run the report. Enter the necessary details to generate the report.
How do you write a macro report?
Record a macro
On the Developer tab, click Record Macro. Optionally, enter a name for the macro in the Macro name box, enter a shortcut key in the Shortcut key box, and a description in the Description box, and then click OK to start recording.
How do you automate monthly reports?
If you manage a team and need reports from them, here are our seven steps to automate reports each month.
- Step 1: Create a monthly report template.
- Step 2: Select recipients with action items only.
- Step 3: Schedule a due date and reminders.
- Step 4: Follow up by SMS or text.
- Step 5: Collate and save the report.
What is report automation?
Report automation is the process of scheduling an existing report (that somebody currently produces at some level of frequency) to automatically refresh and be delivered to specific places at a specific regular interval.
What are automated reporting tools?
An automated report is a management tool used by professionals to create and share business reports at a specific time interval without the need to update the information each time. These updates are usually made in real-time with the help of automated reporting tools.
What is automated report generation?
Automated Reporting Software enables you to completely automate report generation for your business. Create automated reports across your organization.Your clients will receive customized reports that fit their needs. Automatically gather all data from any application, legacy system, web, or internal database.
What is the best reporting tool?
The Best Reporting Tools List
- Wrike. Best for collaboration on project reporting.
- ProWorkflow. Best reporting software for graphical data reports.
- Hive. Best reporting tool with interactive dashboards.
- Google Data Studio. Best free reporting tools.
- Power BI for Office 365.
- Tableau.
- Thoughtspot.
- Octoboard.
Can I use Python instead of VBA in Excel?
Yes, absolutely! VBA is commonly used to automate Excel with macros, add new user defined worksheet functions (UDFs) and react to Excel events. Everything you would previously have done in Excel using VBA can be achieved with Python.
Can we automate Excel using Python?
That was just one example of using Python to automate repetitive boring tasks. But remember that automation is not just about Excel spreadsheets. There are so many things we can automate. You can search on various sites such as Github and you can automate a lot of things with Python.
Is Python better than Excel?
Furthermore, it has better efficiency and scalability. Python is faster than Excel for data pipelines, automation and calculating complex equations and algorithms. Python is free! Although no programming language costs money to use, Python is free in another sense: it’s open-source.
What is difference between macro and VBA?
The main difference between VBA and Macro is that VBA is the programming language to create Macros while Macros are programming codes that run on Excel environment to perform automatic routine tasks.In brief, the user can automate tasks by creating Macros written using VBA.
What is VBA in Excel?
VBA stands for Visual Basic for Applications. Excel VBA is Microsoft’s programming language for Excel.and all the other Microsoft Office programs, like Word and PowerPoint. The Office suite programs all share a common programming language.
How to automate reports in Excel
One of the repetitive tasks in many companies is reporting (projects, cost estimates, sales…). Reports are usually prepared manually in many cases in Excel. Working in Excel often implies dealing with a huge amount of xlsx tables. The tables are completed manually, the data are not controlled, hence there is a high chance of errors (typing errors, same content entered in different ways, etc.). In addition to this, input tables for reports are prepared in different formats and shared as attachments via emails.
To be honest, making a report from several tables in a short time is impossible, because yet another table needs to be created – which is again done manually. It is a demanding and time-consuming task.
Input table, code list and automated interactive report
The automation of reporting in Excel is achieved by working properly with one common input table, code list and interactive report generated automatically from the common input table — a simple database in the background. The result is:
- Error-free, controlled data entry, facilitated by mandatory fields with centralized code list
- Real-time refreshing of data from different tables (sources)
- A common table linked to several input tables. It is a «database» used to create interactive reports, monitor KPIs, create dashboards
How to build an automated report in Excel
- Create an input table which can be easily upgraded and corrected. The data in the reports is then always automatically refreshed without any changes to the file structure.
- Create centralized code lists and link them to the data validation in drop-down lists to reduce the number of entries and prevent entry errors.
- Use specific signalization with conditional formatting settings to control data entry
- Create an additional, hidden fields to display additional information not otherwise visible in the report.
- Write and upgrade formulas relative to different dates, VLOOKUP function (XLOOKUP), Today () function, IF function.
- Design input table and report: use proper formatting to stabilize the result format in reports.
- Link different reports with slicers to automatically control the amount of data in the input table or to efficiently display results in reports using counters.
Learn more on how to automate reporting with Excel in Practice courses ›. We suggest that you start with Projects 1› Excel course. If you already have basic Excel skills, you can easily jump to another level and simplify your work. Try the test case template ›.
Wondering what excel automation is? Let’s give you a detailed account of everything related to automation in excel and how to make use of it.
Microsoft Excel has been in our lives for a long time now and has been helping businesses to calculate data across any number with its amazing ability. In Excel, you can create Pivot Table, make graphs and pie charts, compile data and do a lot more.
One of the most important features of Microsoft Excel is VBA also known as Visual Basic Editor along with the Macro recorder you can do simple, repetitive and even complex tasks easily and without any errors.
All of us have been dependent upon Excel for various works and tasks like managing finances, employees and more. Even though the technology has really grown and today we have things like AI, and cloud computing, many organisations still make use of Excel for their daily all kinds of tasks. Even though there is VBA, one would need a lot of time to understand, learn and then implement it in their business.
So without wasting your precious time, you can easily do all this and more with the help of Excel Automation. You can have uninterrupted workflows that let its users work on many important tasks and save s a lot of time. Now let us know about Excel Automation in detail.
What Is Automation In Excel?
Excel automation is a way of using an application to automatically do tasks without any manual help. With robotic process automation or RPA, you can leverage its power to integrate excel tasks into automated processes.
Some actions that Excel is able to automate include:
- Extracting data from a website to store in Excel
- Copying and pasting data between worksheets
- Manipulate data and text
- Applying styling and formatting
- Communicating with text files, databases, etc.
- Creating new documents
No matter what business you are in, it is Microsoft excel that is constant in all fields. It makes our work really easy and drives data simple. It can help in organising and analysing data. But there is a lot of time that is wasted in copying and pasting values or even reformation of data in documents. Hence it is important to automate excel which would save us a lot of time. It can also remove the key responsibilities that fall on people.
Excel automation is not a tricky thing and you do not have to be a coder or a developer to work or operate on it. You can learn how to automate and leverage most of the macros process to run your business in a more efficient manner.
Benefits of Excel Automation
There are several benefits of excel automation and you would come to know about them as you start to use it. The benefits are:
- Reduced errors
- Save time
- Better and more streamlined reporting
- The ability to integrate with other applications in the Microsoft Suite
- Potential to decrease costs because of saved time
- Potential to boost employee retention because there’s less need for repetitive, draining and monotonous manual work
- No need for coding or programming
- Prevention of key person dependencies
Various Sectors and Industries Using Excel Automation
Excel automation is widely popular in many sectors and fields as it makes the work a lot more efficient and simpler without too many errors or repetitive tasks. It is very frequently used in the HR department, finance, manufacturing and more.
Some top sectors that use automation are
- Healthcare
- Manufacturing
- Public Sector
- Sales & Marketing
- Business Process Automation
- Financial Services
Create, Share, Collaborate
Work with your team in real-time. create documents together and share the same on Whatsapp, Gmail, etc.
There are three ways in which excel automation works for you and these are:
Visual Basics
Microsoft Office has several products and one of them is known as Visual Basic or Visual Basic for Applications or VBA. With this users can select pre-selected codes with the graphical user interface or GUI called VBE which saves macros. This can also be reviewed or edited within GUI.
Excel Macros
This is a sequence of actions that are recorded and reused. One can download, receive them from other users or even generate macros themselves. There is no knowledge of coding required for automation as it works off recording your own actions.
Add-ins
You can also create automated sequences in Excel via the use of third-party programs. These can be easily generated and connected to Excel and can be editable through any other programming language or VBE.
How To Automate Excel Reports Using Macros
Without any coding knowledge, you can automate Excel by the use of a Macro recorder which records your actions as VBA code and lets you repeat those exact actions again by running the macro.
You can code some actions and even review and edit the code as per your needs with a macro recorder. Many Excel users are introduced to VBA in this manner. Macro Recorder is great for non-programmers and helps them adapt to new changes easily.
If you are wondering how to automate excel reports then follow these simple steps:
1. In the Code group, on the Developer tab, click Record Macro.
-OR-
Press Alt+T+M+R .
2. In the Macro name box, enter a name. Make the name as descriptive as possible to make it easier for you to find it in case you create more macros.
3. In the Shortcut key box, type any letter (both uppercase or lowercase). The best would be to use Ctrl + Shift (uppercase) key combinations as the macro shortcut key will override any equivalent default Excel shortcut key if the workbook that consists of the macro is open. For instance, if you use Ctrl+Z (Undo), you will lose the ability to Undo in that Excel instance.
4. In the Store Macro list, select a place to store the Macro. It is usually saved on the This Workbook location. But in case you want Macro to be available when you use Excel, you can select Personal Macro Workbook. Upon selecting this, Excel makes a hidden personal macro workbook (Personal.xlsb) if it does not already exist, and saves the macro in this workbook.
5. Now, add a brief description of what the Macro does in the Description box.
The description will help you identify which macros do what.
6. Click OK to start recording.
7. Perform the actions that you want to record.
8. On the Developer tab, in the Code group, click Stop Recording.
-OR-
Press Alt+T+M+R
Available in 10+ Languages
Hindi, English, bangla, Urdu, Malayalam, etc. Now Work Comfortably in Your native language.
How To Automate Data Entry In Excel?
Anyone who uses excel frequently has daily routine operations and in this case, Excel macros help you in recording the sequence of the actions of the users as a VBA script is this usually done for operations that are not complicated. For more detailed and difficult tasks, people who have programming skills can create projects with VBA.
This automation offers a new approach to the excel routines:
- Automate complex and multistep operations
- Automate XLTools operations: Export CSV, SQL Queries, Unpivot Tables etc.
- Writing commands in a simple excel table instead of bulky VBA modules.
- For advanced developers and users,
- You can create your own custom buttons on the toolbar.
How to automate operations in Excel without VBA
Excel VBA macros are very inconvenient to work with as they tend to grow into hundreds of lines of scripts. With XLTools automation add-in, you can write commands in simple excel tables. The table is easier to edit, visual and more informative.
This is a universal tool that automates any command and its sequences virtually:
- Automate SQL Queries against Excel tables: GROUP BY, SELECT, JOIN ON, etc.
- Automatically export an Excel table to a CSV file
- Automatically unpivot a crosstab table to a flat list
- Automatically extract data from other Excel or CSV files
- Automate table filtering, etc.
Here is how you create an automation command in the Excel table:
XLTools.SQLSelect – type the name of the command exactly; place it in two merged cells.
XLTools.SQLSelect
| SQLQuery: | Write the query as you normally would. |
| ApplyTableName: | Type the name for the resulting table. |
| OutputTo: | Specify where to place the result. |
Excel Automation Tools
Excel automation involves building code to interact with Excel and performing tasks automatically. Let us look at some of the top coding tools and software for excel automation. There are some tools that help professional developers in creating complex add-ins and whereas on the other hand, some tools are used to automate Excel without any coding knowledge.
These below-mentioned tools are best for the people who have not experienced programmers as their first steps toward Excel automation:
VBA Macro Recorder
In this, you record actions in Excel and replay recorded Macros to repeat processes.
Power Query
This one does not need any coding knowledge and can easily manipulate data in Excel and save queries.
AutoMacro
This reduces VBA’s learning curve for beginners and makes VBA coding more accessible to people who are from non-programming backgrounds.
Your Data Is Safe As A House
With daily backups, we ensure your data is safe and secure whether you lose your phone or it breaks down.
What Can You Use Excel Automation For?
There are several usages of excel automation. It helps in saving time while you are updating excel documents. With the usage of Macros, one can update excel with the most recent information like prices, company data and all from a database.
The macros live within the document as a Visual Basic for Applications code, also known as VBA. It can also become an invaluable tool with the ability to manipulate and it has several usages like
- Creating new documents
- Manipulating text and data
- Communicating with a variety of data sources to the database from text files
- Applying the correct formatting and style
To help you out, there are many excel automation tools. But it is essential to decide and know what purpose each tool will serve.
You Should Also Read
Best Apps to Open Excel Files
How to Make Excel Sheets on Mobile
How Lio Automation Can Help You Business Process
Automation surely does make a difference in running a business whether small or large. It can be tricky and overwhelming at first to switch all the business processes to automation but not with Lio.
Lio Automation gives you many amazing features that make your work super simple and effective. There are very many features that will help you and your business in various aspects. From connecting and staying in touch with your customers, to working together as a team, and everything in between, Lio Automation will truly make your business run smoothly and make it reach new heights of success.
If you are using Lio Automation for your business processes consider all your data safe and secure all the time. Not only is the data saved in the cloud, but it also offers a data versioning feature in which you can actually see the many changes the document or file has gone through and who has made those changes. You can save the version of the file as required by you.
You can create dashboards for each file which would give you the clear details of your company’s operations, marketing campaigns, sales and other analytics. This is one useful feature that would truly make a difference to your business and help your see all the processes clearly so that you can make well-informed decisions.
Lio Automation also makes working in teams very easy with their Task feature. you can not just assign tasks to your team efficiently. You can set the priority of each task along with the due date. Your team will get a notification about the task automatically, even on Whatsapp, they can see their assigned tasks in the app, mark them complete, and you will get a notification on Whatsapp!
Not just this, Team management and work allocation are made super easy with Lio Automation. You can also work with teams in real-time and see all the changes happening.
Since customers are a big part of any business and staying in touch with them is a crucial job, Lio automation gives you the ability to automate Whatsapp communications. Automating WhatsApp communication is another popular trend that businesses can benefit from. With the help of this, you would be able to save a lot of time, boost your customer retentions and renewals, save a lot of money, have lower operating costs and much more.
You can share invoices and receipts with your customers while also sharing the payment links with them to make the whole transaction process smoother and absolutely hassle-free for everyone.
There are several other amazing Lio automation features that are made so that you and your business can benefit from them. Excited to know more about it? Click here to start with your Lio automation process for your brand and start your journey to success.
Frequently Asked Questions (FAQs)
What kind of Excel tasks can be automated?
The following are the type of tasks that can be automated:
– Migrating and extracting data
– Application integration
– Database integration
– Cleaning and parsing data
– Running analysis reports
Are Excel macros the same as RPA?
The answer is no. Although Robotic Process Automation and macros have some similarities, there are significant differences.
Do I have to have Excel to use RPA Excel automation?
You actually don’t need to have Excel. RPA platforms like Automation 360 Let you manage workbooks and Excel sheets without having the program installed.
Is Excel automation on for enterprise-level companies?
No, RPA automation is available for any size company and is completely scalable and it grows.
Conclusion
Excel Automation is fairly simple and lets you make your work and business very easy and convenient. With this, you can easily track your work and have a deep analysis of your data. Excel Automation benefits you in multiple ways helping your scale new heights of success. Hope by now you have understood all important aspects of it and are ready to automate your work.

When it comes to maximizing productivity and saving time, automated reports in excel with Power Query are key. Reporting automation allows managers and controllers to have business metrics dashboards up to date in a predefined format. Report Automation means that the whole process of the report creation and update must be enabled through some sort of software, app or API, so it becomes faster and more efficient. The main goal of these automatic reports is to save you time and money. And yet, up to 62% of employees surveyed here can identify at least 3 major inefficiencies at work that could be automated.
With that data in mind, we’re excited to publish this tutorial, inspired by one of our very own customers (Marek Laanbek, Beebole customer and financial controller at CES Estonia) who took the employee and project data in Beebole and turned it into a beautiful monthly automated timesheets report. While he used Beebole’s API to create his dashboard, we decided to go the route of report automation with Excel Power Query, also known as Get & Transform.
What is Excel Power Query? As the Microsoft support site indicates, “Power Query is a data discovery and query tool, good for shaping and mashing up data.”
Time tracking tools that integrate with Excel
Beebole’s dashboards are powerful and make it easy to create multiple views for your timesheet data. However, we know many users are more comfortable working in Excel, which is why Beebole makes it easy to export your raw data from the app so that you can review and analyze it in any tool.
Don’t forget that the Beebole’s add-in for Excel allows you to connect spreadsheets directly to your Beebole account making it even simpler to build your reports and analyze your data in Excel.
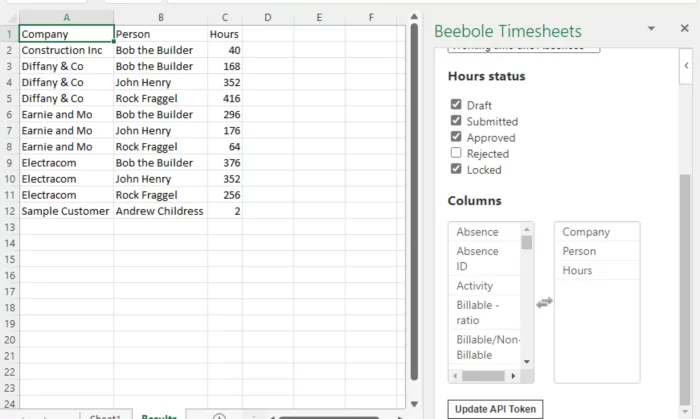
Beebole’s easy-to-use export feature and free Excel integration make them perfect complementary tools to work with your timesheet data. In this tutorial, we’re going to use Beebole timesheet data with Excel to create an automated employee time report dashboard. Of course, in order for this dashboard to be fully functioning, employees must actually fill out their timesheets! That’s exactly why we’ve put together this quick overview of examples of timesheet reminders and templates.
Watch the tutorial on YouTube
If you’d rather not read through the tutorial, we’ve also recorded it for our YouTube channel, which we’ve included below. And if you find this helpful, be sure to subscribe to our channel, where we’ll be releasing many more tips and tutorials in the months to come.
Step-by-step tutorial
First, we need to download the employees’ timesheet data from Beebole. After you log into your Beebole dashboard, find the Reports section on the right side. We need to create a report that gets data from Beebole to export.
Then, let’s give our report a name. I set mine to “Export to Excel” to make it easy to remember. Then, let’s start playing with the fields that we want to include.
What works well for Excel is to grab every possible field you might need. If you don’t want to see that field in your Excel dashboard, simply exclude it from the report we’ll build later on. It’s better to include everything you might want to work with.
Excel works well with each row of data as its own “record.” That means each line should represent a single time entry. See the screenshot below for a suggested data view that works well for a dashboard. One optional setting: There’s a dropdown box labeled “What information do you want to show?” Switch between options like Working Time only and Working Time and Absences based on the purpose of your report.
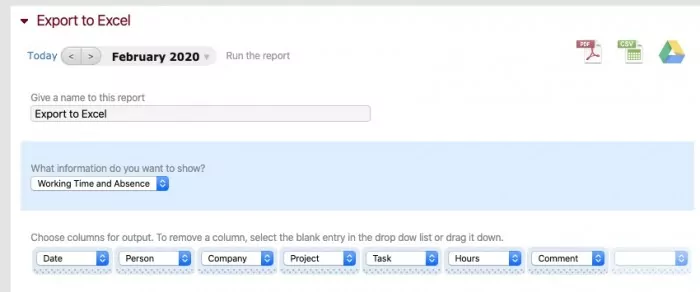
Finally, make sure to set the time period for your data. It’s best to download an entire year’s worth of data. That way, you can simply replace the file that Excel uses for the dashboard. You won’t risk duplicating records by downloading a week at a time, for example.
Now, it’s time to download our finished report. Click on the CSV button.
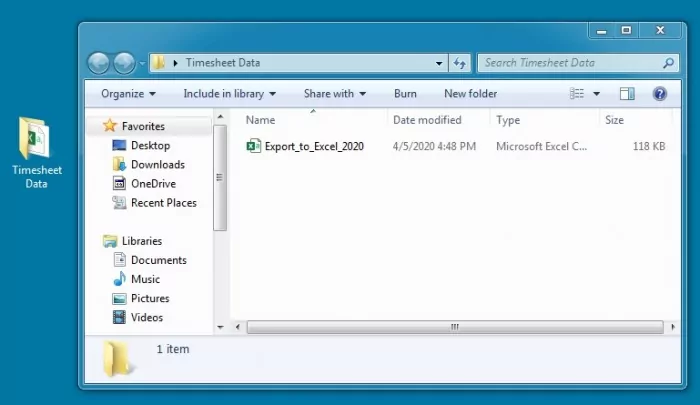
After that, create a new folder, then place your downloaded CSV file in it. We’ll tell Excel to watch this folder for timekeeping data.
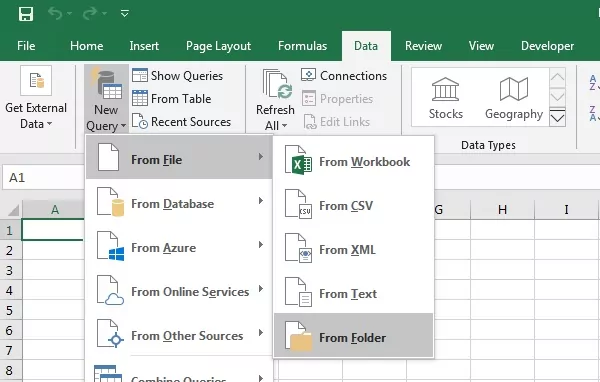
To work with the data in Excel, we need to point it to our Beebole data. We’re going to use a feature called Power Query to point Excel to a watched folder and keep the time report dashboard up to date.
Sure, you could simply copy and paste your timesheet data into the workbook. But this takes extra time to update and can be cumbersome. Remember, we want to automate this reporting process as much as possible.
To use Power Query to get your timesheet data, open Excel and choose Data > New Query > From File > From Folder. Then, browse to a folder on your computer.
Now, point Excel to the folder that you created for your timesheet data. You’ll see a preview of the files that Excel uses in the future. Click the Combine and Load to dropdown so that Excel will automatically roll together all timesheet data you keep in the folder.
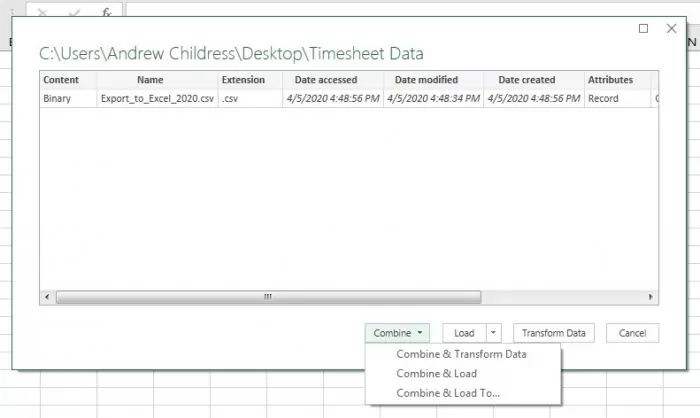
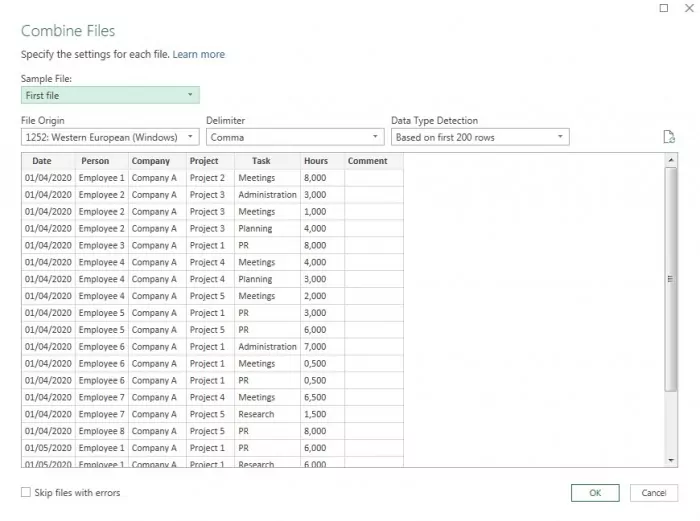
Excel will then show you a preview of the data rows that will be included in your report. Press OK to confirm.
Finally, we need to use the Load To option to make Excel “aware” of data so that we can work with it.
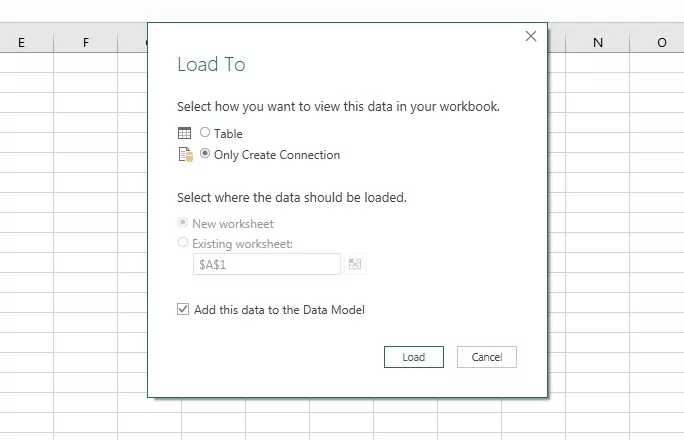
With this approach, we have Excel watching a monitored folder for new timesheet data. All that you have to do is replace the CSV with a new download from Beebole and click Data > Refresh All, and Excel is always up to date.
With the previous steps, we’ve laid the groundwork to work with our timesheet data. Excel is now watching a folder for the latest file and is ready for your data.
Now, we’re going to use a PivotTable to work with this data and put it into an interactive report. Specifically, we’re going to use Power Pivot, which magically works with the data that lives in the watched folder.
Power Pivot is an Excel add-in which can handle large volumes of data (millions of rows) from various sources and all of this within a single Excel file. According to Microsoft: “Power Query and Power Pivot complement each other. Power Query is the recommended experience for discovering, connecting to, and importing data. Power Pivot allows for powerful data analysis and data modeling in Excel and is great for modeling the data you’ve imported. Use both to mold your data in Excel so you can explore and visualize it.”
To add a pivot, go to the tab labeled Power Pivot > Manage. Next, click on PivotTable to place it in your Excel workbook. This is the gateway to working with our timesheet data.
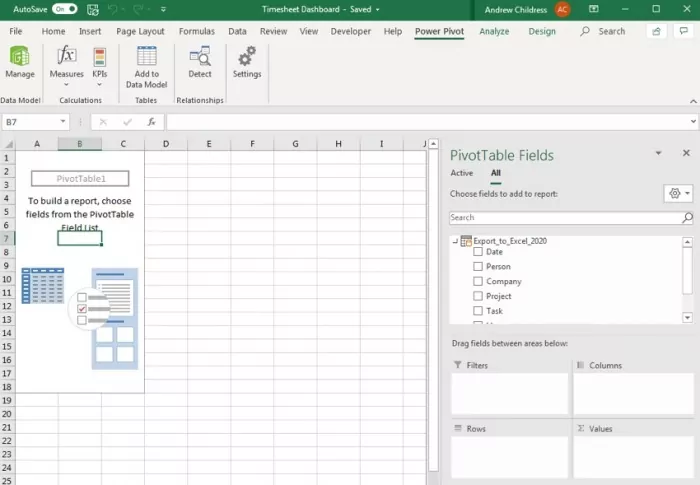
So far, we’ve taken steps that add a table that hooks to our timesheet data. Now, we can start building out our report.
We’re going to build a PivotTable based on our timesheet data. This is one of Excel’s most powerful features to work with data. In short, a Pivot helps you aggregate and summarize data in an easy-to-understand format.
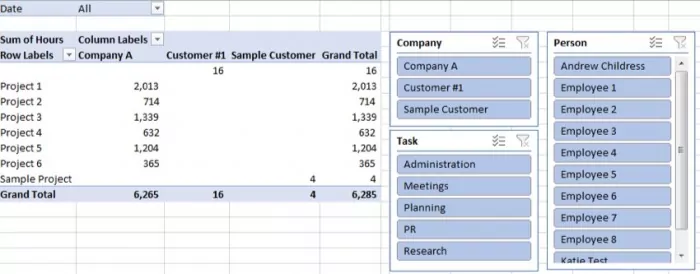
Click inside the PivotTable box on the left side to show the PivotTable Fields menu. Think of this menu as a report builder. It points to your timesheet data, and you can drag-and-drop it into a report that stays up-to-date.
You’ll see rows for each of the data in the list, like Date, Person, Company, and Project. You’ll recognize these as the columns in our original dataset.
Below the field list, you’ll see four important boxes: Filters, Columns, Rows, and Values. Drag-and-drop fields into these boxes to show data in the report. The box that you drag a field to influences how it shows in the report.
Basically, if you drag a field like “Project” into Rows, it shows each project on its own row. Or, if you dragged it into Columns, each project shows in its own column. You can build a report in the format you need by dragging fields to the corresponding boxes.
Here’s a suggestion for a sample dashboard.
Drag:
- Hours into the Values field
- Project into Rows
- Date into Filters
- Employee into Columns
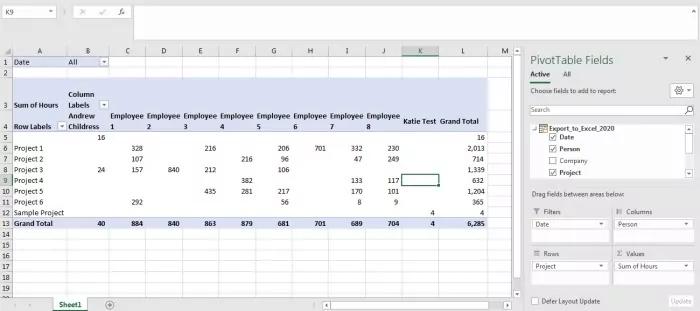
With this report, I can quickly see each project and how much time my employees are spending on them. It’s this type of dashboard that your boss and peers are sure to appreciate as they assess the workload.
If you want to filter the included dates for the data, click on the dropdown box at the top of our report. You can uncheck the dates that you want to exclude from your report.
PivotTables require experimentation. When you start to build them, start by asking: “what do I want to learn about my data?” We’ve built the framework to show timekeeping data, and now it’s your turn to decide how to create a report that’s most useful to you.
What works best for you? We want to hear about it.
Above all, we’d absolutely love to hear your thoughts. In addition to hearing whether this post was useful for you and your organization, we’d love to help answer any questions you have. Leave your questions or comments at the bottom of this post, and we’ll do our best to help. Our hope is that many of you will not only find this tutorial helpful, but you’ll also find it inspirational. We’d love to see what you come up with, so we can eventually put together a collection of everyone’s automated dashboards and reports to share with this community.
A report like this is a great way to analyze what your team is working on in Excel. One last feature to check out is slicers.
A slicer is a way to filter the data that shows in your Pivot. It’s a point-and-click option to filter the data that shows in the pivot.
To add a slicer, click inside your Pivot, then go to Analyze > Insert Slicer. Tick the boxes for any fields you want to add a slicer for. As a general rule, it’s a good idea to add any fields that aren’t visible in the report as a slicer.
For example, I’ll add Company and Date. You’ll see new boxes that control the data that shows in the pivot.
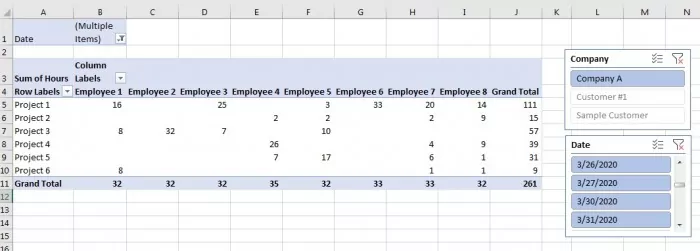
Slicers stack. So for example, this means that after you pick Company A, the dates will automatically adjust to only show dates relevant to Company A timekeeping.
Key takeaways
With the help of this tutorial, you now have an easy-to-refresh timesheet dashboard and instructions for creating useful reports to share with your team and management. Once you’ve taken the simple steps above to set everything up, just use the Data > Refresh All option each time you download data, and you’re ready to present. In conclusion, here’s a quick look at today’s main takeaways.
- When it comes to saving time and money, automation is key. Excel Power Query and the Beebole Timesheet add-in for Excel make automating reports possible. Once set up correctly, no need to tinker or toy with anything—your data will automatically display as you’ve designed it to.
- Excel Power Query is a data discovery and query tool that’s great for “shaping and mashing up data.”
- For an automated time tracking dashboard in Excel, make sure to find a tool that integrates with it seamlessly.
- First and foremost, decide which data is pertinent to you and your organization before creating your automated report, and remember to ask any questions you have below so that we can help.
- Use PivotTable and slicers in order to further filter your data.
- Share your automated dashboard and reports with us; we can’t wait to see what you come up with and to share the examples with this incredible community.

Freelance writer and content marketer. Combines his background in corporate finance with technology and a love for teaching to create content. Andrew loves to create productivity tools and strategies that help people work smarter, not harder.