
The instructions provided in this article are sufficient for creating an automated integration. But please note that we are not responsible for the outcome if you use the instructions incorrectly, specify incorrect settings, or if there are changes in the app’s API. If you need help with the setup, we can offer this premium integration at an additional fee.
An API is a ‘bridge‘ through which one app obtains/sends information from/to another app. This means that you can load miscellaneous data from your source app to your Excel workbook using the REST API. Moreover, you can even schedule data loads via the API to Excel sheet without any VBA coding! Read our guide to learn how you can do this.
How to use API in Excel – options you have
Basically, you have three options to link API to Excel:
- Power Query: You can query data from APIs using Excel’s built-in tool.
- Coupler.io: This third-party importer will let you automate data exports via APIs to Excel on a custom schedule.
- VBA: This is a code-based option that is suitable for tech-savvy Excel users.
Let’s check out each option in action so that you can make the best choice for your needs. For this, we asked Richard, a cryptocurrency enthusiast, to help us.
Richard wants to analyze the growth tendency of the top crypto coins. To do this, he needs to load data from CryptoCompare using their JSON API.

For testing, Richard will use the following API URL that will load data about the price for five cryptocoins: Bitcoin, Ethereum, Terra, Binance Coin, and Tether.
https://min-api.cryptocompare.com/data/pricemulti?fsyms=BTC,ETH,LUNA,BNB,USDT&tsyms=USD,EUR&api_key={enter-api-key}
Note: This API requires authorization, so Richard has already generated a free API key.
So, let’s start with the option that allows you to schedule exports via API to Excel.
How to regularly pull API data into Excel
For scheduled exports of data from API to Microsoft Excel, Richard will use Coupler.io. It’s a solution that allows you to connect to multiple sources and load data from them to Excel, Google Sheets, or BigQuery. You can export data on demand and automate import on a custom schedule, such as every day or every hour.
For Richard’s case, we’ll use the JSON integration with Excel. Let’s see how it works.
Excel API example with Coupler.io
Sign up to Coupler.io with your Microsoft account. Click Add new importer – this is a boilerplate to set up your connection to API. Choose JSON as a source application and Microsoft Excel as the destination application. Then complete the following steps to load data from API to Excel sheet.
Source
- Insert the API URL to the JSON URL field. Click Continue.
https://min-api.cryptocompare.com/data/pricemulti
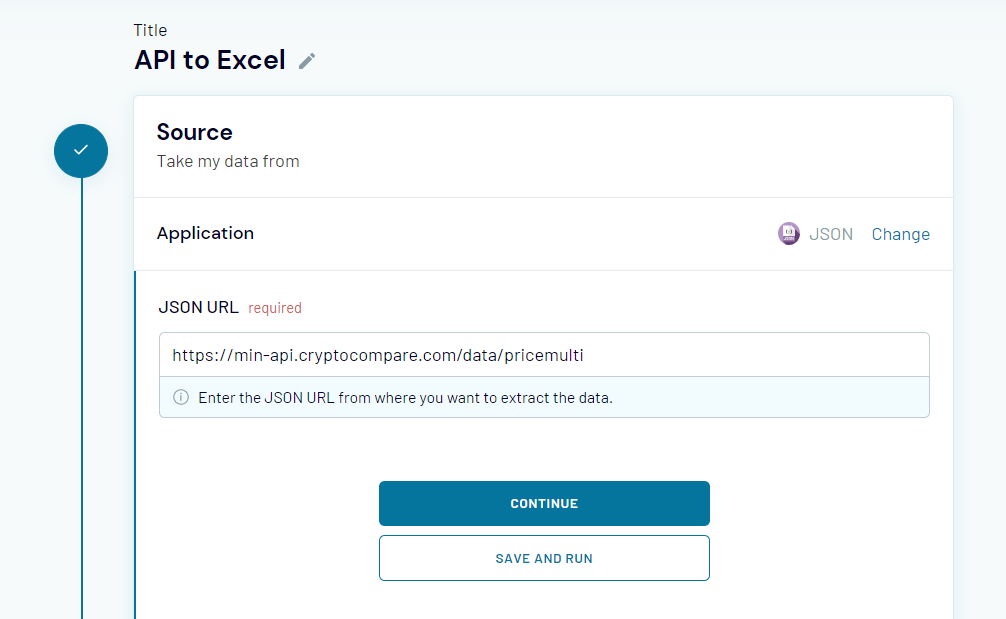
Note: You’ve noticed that this API URL differs from the one mentioned in the beginning. It lacks attached query strings because Coupler.io provides separate fields to specify request headers and URL query parameters. So, Richard will use those to demonstrate how they work.

- Request headers – here, you can apply specific headers to your request, such as Authorization, as Richard did.
authorization: Apikey {enter-api-key}
- URL query parameters – this field is for query parameters for your requests to the API. In Richard’s case, he specified the following strings:
fsyms: BTC,ETH,LUNA,BNB,USDT
tsyms: USD,EUR
Other fields, Request body, Columns, and Path are optional. You can learn more about them in the Coupler.io Help Center.
Note: You can find information about the parameters used in those fields in the API documentation of your application. Pay attention to the information about API authentication and details of API endpoints – these are usually located in separate sections.
Now you’re ready to Jump to the Destination Settings.
Destination
- Select a workbook on OneDrive and a worksheet where the data will be loaded. You can select an existing Excel worksheet or create a new one. Click Continue.

Note: Optionally, you can change the first cell for your imported data range, change the import mode, and add a column that contains the date and time of the last update.
Clicking on Save and Run loads the data from API to Excel right away. But Richard needs to automate this export on a recurring basis, so he needs to complete another step.
How to get data from API in Excel recurrently
You can configure the schedule for your JSON importer during the initial setup or at any other time. For this, you need to toggle on the Automatic data refresh and configure the frequency:
- Interval – from every month to every 15 minutes.
- Days of week – select the days you want to have the importer run.
- Time preferences – select the time when you want to have your data importer from the API.
- Schedule time zone – do not forget to specify the time zone for your dataflow.

That’s it! Let’s check out the results of the records pulled from API to Excel sheet?

The imported data does not look very neat. Nevertheless, you can create a separate sheet where the data will be transformed to the format you want and link Excel sheets. Therefore, every time Coupler.io refreshes your data, it will be automatically refreshed on the linked sheet.
Connect API to Excel with Power Query
Power Query is a data transformation engine within Excel. As well, it allows you to query data from different sources including REST APIs. Here is what you need to do to link API to Excel.
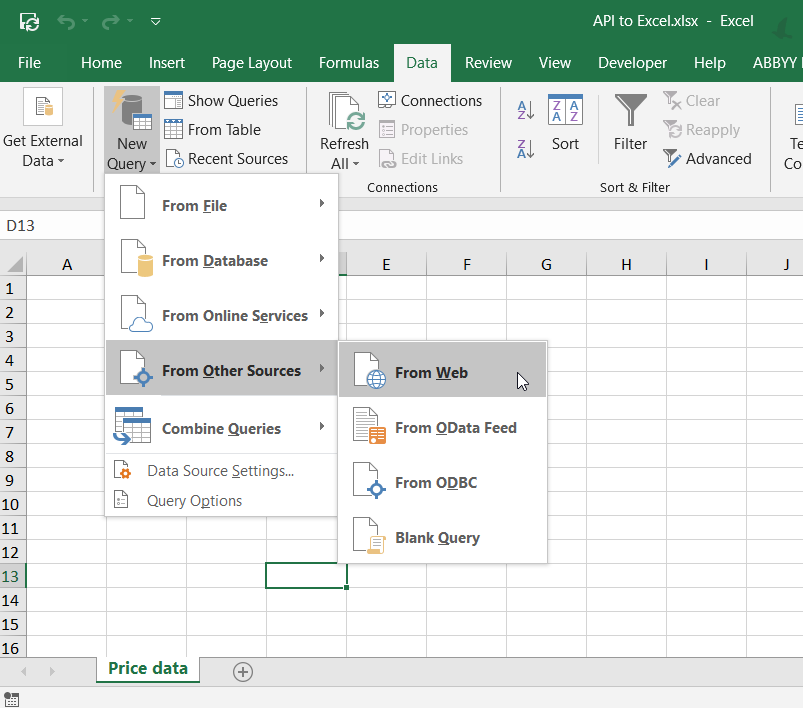
- In your Excel workbook, go to Data => New Query => From Other Sources => From Web.
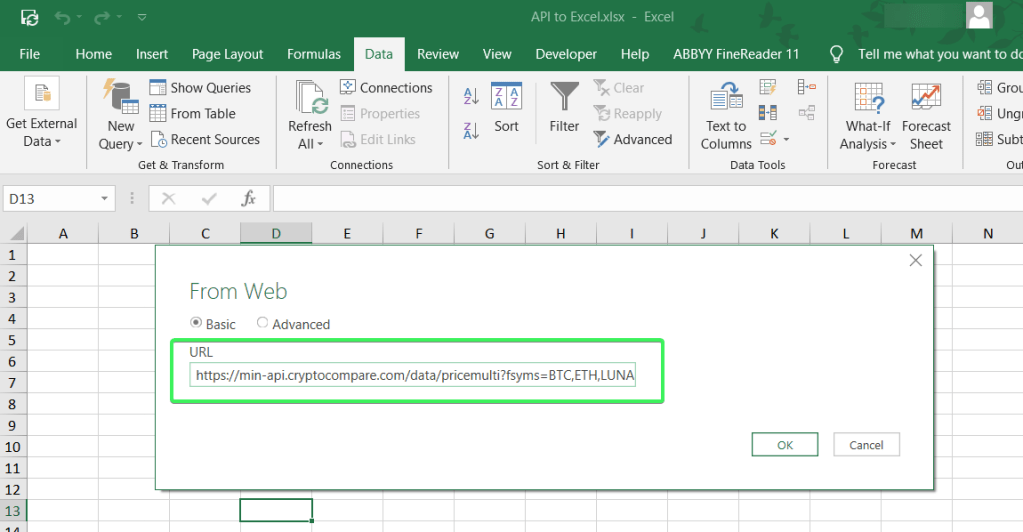
- Insert the API URL and click OK.
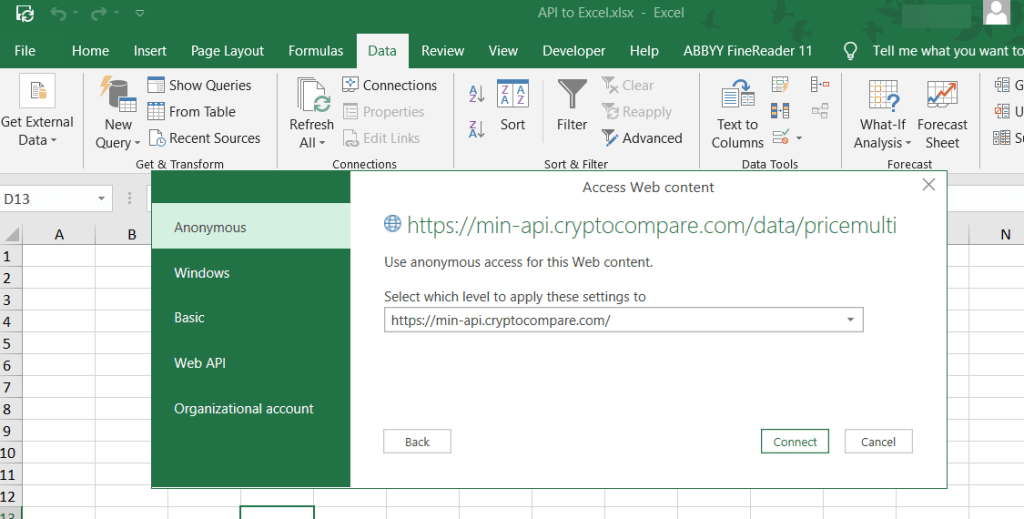
- Choose the web content access. For this example, we can go with Anonymous. Click Connect.
- The Power Query editor will open where you can preview the data loaded from API. Go to the Convert tab and click Into Table.

- This will convert the data from API to a table, and you’ll be able to transform it before loading it to the Excel workbook, for example, transposing rows to columns or vice versa.
- You see that values in the Value column are hidden. The reason is that you need to select which columns to display. For this, click on the Expand button and select the columns. Click OK.

- Now you see two columns: Value.USD and Value.EUR. When all the necessary transformations are done, click Close & Load.

There you go!

You can also check out the details of your connection.

Can you link API to Excel on a schedule with PowerQuery?
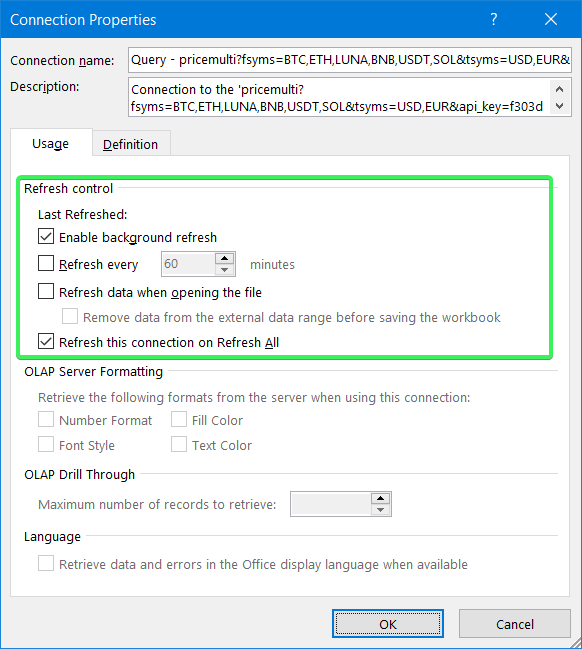
You can refresh data from the API on demand or set up a frequency for the automatic refresh. For this, go to Data => Connections => Properties… and configure the Refresh control.
The Power Query setup looks somewhat intricate because the main purpose of this tool is to transform data. So, it’s better to use Power Query in combination with Coupler.io – your data will go to Excel on a schedule where you can transform it with Power Query as you wish.
How to connect API to Excel using VBA
The answer is very simple – you need to learn VBA and implement your coding knowledge. 🙂 The benefit of a code-based solution is that you can make it custom. This is achievable if you’re proficient in coding and specifically VBA. Alternatively, you can find some templates on GitHub or somewhere else and tweak them. But it is unlikely that you will find a code sample that will cover all your needs.
Which way to connect API to Excel sheet is the best one?
The built-in PowerQuery functionality seems to be the actionable option to link API to Excel. It allows you to grab data and transform it on the go. However, the main drawback of PowerQuery is that it’s only available for the Excel desktop app. If this is not an issue for you, you can go with it.
The no-code way is the choice of many, including Richard. For his needs with low data volume and infrequent data refresh, he can use the Coupler.io Personal plan. In addition to the option of connecting API to Excel sheet, you can benefit from many ready-to-use integrations, as well as other destination apps – Google Sheets and BigQuery. You can try out Coupler.io for free with a 14-day trial.
Who’s going to choose the VBA script to connect API to Excel? This is the way for tech-savvy Excel experts who prefer to create custom functions and integrations for their liking. If you are one of those, then it’s probably your way as well.
-

A content manager at Coupler.io whose key responsibility is to ensure that the readers love our content on the blog. With 5 years of experience as a wordsmith in SaaS, I know how to make texts resonate with readers’ queries✍🏼

Back to Blog
Focus on your business
goals while we take care of your data!
Try Coupler.io

UPDATED version of this tutorial available here
CREATE AND INSTALL
Create new react project
npx create-react-app react-data-to-excel
Enter fullscreen mode
Exit fullscreen mode
Now start project
npm start
Enter fullscreen mode
Exit fullscreen mode

Project successfully created.
Lets dive into installing neccassry libraries for our project. Install these three libraries.
npm install xlsx file-saver axios --save-dev
Enter fullscreen mode
Exit fullscreen mode
👉xlsx — library for parsing and writing various spreadsheet formats
👉file-saver — library for saving files on the client-side
👉axios — promise based HTTP client for the browser and node.js. We will use it for fetching data from server
UI AND LOGIC
Create a component namely ExportToExcel.js
import React from 'react'
import * as FileSaver from "file-saver";
import * as XLSX from "xlsx";

export const ExportToExcel = ({ apiData, fileName }) => {
  const fileType =
    "application/vnd.openxmlformats-officedocument.spreadsheetml.sheet;charset=UTF-8";
  const fileExtension = ".xlsx";

  const exportToCSV = (apiData, fileName) => {
    const ws = XLSX.utils.json_to_sheet(apiData);
    const wb = { Sheets: { data: ws }, SheetNames: ["data"] };
    const excelBuffer = XLSX.write(wb, { bookType: "xlsx", type: "array" });
    const data = new Blob([excelBuffer], { type: fileType });
    FileSaver.saveAs(data, fileName + fileExtension);
  };

  return (
    <button onClick={(e) => exportToCSV(apiData, fileName)}>Export</button>
  );
};
Enter fullscreen mode
Exit fullscreen mode
Sample data we will get from https://jsonplaceholder.typicode.com/posts
App.js
import React from 'react'
import axios from 'axios'
import './App.css';

import {ExportToExcel} from './ExportToExcel'

function App() {
  const [data, setData] = React.useState([])
  const fileName = "myfile"; // here enter filename for your excel file

  React.useEffect(() => {
    const fetchData = () =>{
     axios.get('https://jsonplaceholder.typicode.com/posts').then(r => setData(r.data) )
    }
    fetchData()
  }, [])

  return (
    <div className="App">
      <ExportToExcel apiData={data} fileName={fileName} />
    </div>
  );
}

export default App;
Enter fullscreen mode
Exit fullscreen mode
Start project
npm start
Enter fullscreen mode
Exit fullscreen mode
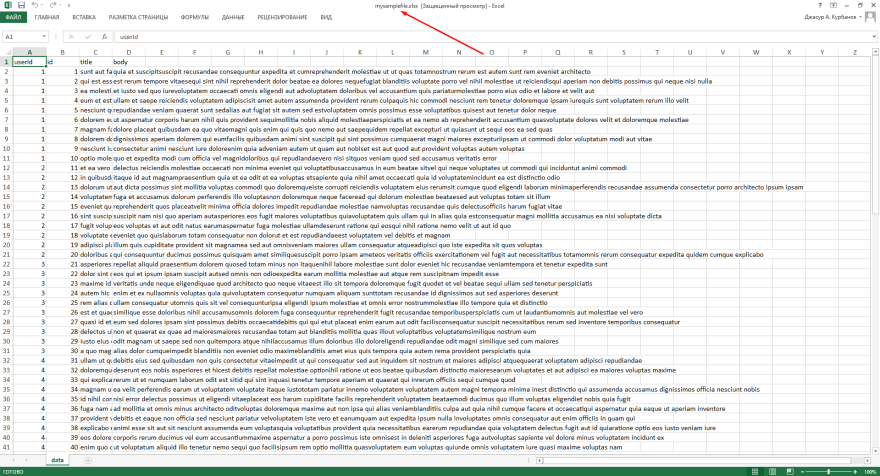
Once it successfully started. You can see one button. By pressing this button you download excel file with data filled from https://jsonplaceholder.typicode.com/posts
Output

Excel File
Github repo for this project link
Table of contents
- What is JSON?
- What are the applications of JSON files?
- What is Excel?
- Applications of Excel
- How to Import JSON file in EXCEL?
- What is a JSON format?
- How to view JSON files?
- Free Excel Courses
- Conclusion
- FAQs
- What is JSON?
- What are the applications of JSON files?
- What is Excel?
- Applications of Excel
- How to Import JSON file in EXCEL?
- What is a JSON format?
- How to view JSON files?
- FAQs
What is JSON?
JSON is an abbreviation used for JavaScript Object Notation which is a file format. JSON is used to store and exchange data over the network. The data from the server to the client can be shared through a JSON file.
The JSON file is easy to share and analyze. The file extension of a JSON document is “.json”. It is a standard file format based on text and is mainly used for the transmission of data on websites and web applications. JSON syntax is just like the JavaScript Object syntax. It can be read and understood easily. It is most widely used among web applications because it is very lightweight to work with. The JSON files can be loaded easily and a non-technical person can also understand them quickly.
The format that a JSON document is written as of key-value pair. JSON combined with Excel provides greater usability to import data. If you have a JSON file and you want to import it into Excel for better data analysis. Then it is possible to import the JSON file using Power Query. This article will look at this operation to import JSON to Excel. We’ll also see how you can use that imported data in Excel very efficiently.
What are the applications of JSON files?
Here are some useful applications of JSON documents below:
- JSON documents are mainly used to write programming code in programs that are specifically based on JavaScript, like Angular, Node, React, etc.
- JSON can adopt all programming languages, which is the main reason for its popularity.
- JSON files are useful when transferring data from the server to the client.
- JSON is a lightweight document, and that’s the reason it is mostly used for web communications.
- The JSON documents are shared on the network in a structured way.
- Various applications allow importing data from JSON format through APIs, making the data import very easy.
- The JSON format is very useful for serialization and transmission of data over the network.
What is Excel?
Excel is a software program developed by Microsoft. Excel is a very useful software to store data and is mainly used for the application of mathematical formulas on that data and calculation purposes. As data is very important for organizations, and that’s the reason Excel has become very productive for businesses. Excel is most widely used by businesses to analyze their data effectively.
The extension of Excel is “.xlsx”. Excel also provides the creation of charts, graphs, and various visualizations that helps to understand the data. You can also customize the UI of Excel based on your preferences.
You can even share an Excel file with collaborators to enable the updation of data from multiple users. This way, the Sales Managers take input from their team in a single Excel file. Excel also allows you to automate various data manipulation tasks through its inbuilt Visual Basic Application. You can use Visual Basic and write code to automate several tasks in Excel. This feature increases the productivity of using Excel.
Excel also gives you a bunch of options to import your data through the Web or other file formats. You can also import your data from a JSON file. In this article, we’ll see how you can import JSON documents in Excel for better analysis of data. Also, while you’re at it, check out this excel course online free to learn more about excel.
Applications of Excel
- Easy to Utilize Interface: The interface of MS Excel is easy to use, and anybody can understand the interface and usability of MS Excel quickly.
- Graphical Representation: It becomes very difficult to understand data in raw format. To solve this problem, Excel provides a graphical representation feature that you can use to visualize your data in a graphical format. This way, data can be analyzed very efficiently.
- Highly Supportive in Breaking Down Deals: Organizations use Microsoft Excel for their business needs. It helps businesses to examine the data of their sales and customers, which results in productive decision-making.
- Financial Modeling: The financial analysis of organizations is simplified by MS Excel, and the maintenance of financial records is made easy. It is very important to calculate the datasets in financial modeling, and Excel provides inbuilt formulas that are very useful for financial modeling.
- Accessibility of a Broad Scope of Functions: The functions in excel are very beneficial for evaluating equations and computation of mathematical formulas. The functions in excel can easily be modified according to the needs, and it also allows for the creation of new functions for the user.
- Future Development of Any Business: MS Excel is very important software that helps businesses to make future decisions. It helps in business analysis which helps organizations to find insights into the data.
How to Import JSON file in EXCEL?
There are various versions of MS Excel in the market that comes under MS Office like Office 2007, 2010, 2013 and so on. So, we’ll look at all these versions on how to open JSON files in Excel. Unfortunately, Office 2007 doesn’t give an option to import JSON files. But the later version of Excel allows it.
How you can import JSON files in Office 2010 version?
- Open a New Excel Workbook and look for the Power Query tab.
- In the Power Query tab, go to Other sources and then click blank query.
- Now, go to the JSON file on your computer and copy the path of the file.
- In MS Excel, it will give you a blank space for your query, there you need to paste the path copied from the JSON file.
- Click OK and it will load the JSON file in Excel Power Query. Now you can manipulate the data of the JSON file.
The version of MS Office introduced after Office 2010 was 2013. There were some changes in this version and let’s see how you can import your JSON files in Excel 2013.
- Open a New Excel Workbook and find the Power Query tab.
- Go to Other sources and then choose blank query.
- Go to Advanced editor in the Query Editor.
- Enter the query as the path of your JSON file.
Now, the latest version of Excel comes under Office 2019. The below steps define how to open a JSON file in Excel.
- Go to the Data tab in an Excel Workbook.
- Click on From File and then choose JSON.
- Now, choose the JSON file from your system and select OPEN.
- This will open the JSON file in Excel and now you can view the data.
Opening JSON From the Internet in Excel
The latest version of Excel also supports importing the data from the web. You can also import the JSON file from the Internet or by using an API call. To import the JSON from the internet, you need to follow these steps:
- Go to the Data tab in an Excel workbook.
- Select From Web option under the “Get & Transform Data” ribbon.
- After that an input box will appear in your window where you will have to enter the URL for the JSON file.
- Click OK and it will open the JSON file in Power Query first.
- Then you need to transform the data into a table and also apply other transformations to your data.
- After that when you Close & Apply from the Power Query, it will open the transformed data in Excel.
What is a JSON format?
JSON stands for JavaScript Object Notation which means the data in this file represents every information as an object. And the data stored in the JSON file is lightweight. The JSON format is used by JSON files as “.json”. It is very useful while communicating between the server and the client. The text format in the JSON file is completely language-independent. However, anyone can easily understand a JSON file because of its simplicity. The other programming languages such as Python, C, C++, and others can also use JSON files for various purposes.
The JavaScript scripting language represents the data in a JSON file as a simple data structure by using associative arrays. These are called objects. By using these objects, the data can be differentiated easily.
So the format JSON is used by the JSON files to organize the data.
How to view JSON files?
As we know JSON is a document that contains data. So the JSON file is generally a text file just like other text files of Notepad or Notepad ++. The JSON file can be viewed in Notepad, Wordpad, or any other text editor. You can also view the JSON files in Python. To understand the data in a JSON file, it is best viewed in MS Excel. You can view the JSON document in an Excel workbook by importing the file available either on your system or on the internet.
Free Excel Courses
- Excel Tips and Tricks
- Excel for Intermediate Level
- VLOOKUP in Excel
Conclusion
JSON documents are very useful for transmitting the data from the server to the client. And Excel is used to store the data in a spreadsheet. Excel allow us to apply formulas and functions to that data. JSON document is best viewed in Excel in a table format and Excel presents the data in a clean format. So, it is very useful to import a JSON file in Excel.
As we know, there are various versions of Excel available, but older versions of Excel don’t allow importing a JSON file. But, now you have the option to import any JSON document whether it is available locally on your machine or you can also import a JSON from the internet.
In this article, we talked about how productivity increases when working with JSON and Excel together. You can use the steps described above to import a JSON file in MS Excel. Learn more Excel tricks with us today!
FAQs
How do I import a JSON file into Excel?
To import the JSON file to the latest version of Excel, you need to follow the below steps:
1. Open a new Excel workbook and go to the Data tab.
2. Select the option Get Data if you have the JSON file on your system and locate the path in the input field to get the JSON file.
3. If you want to import a JSON file available on the internet, then you need to choose From Web option in the Data tab.
4. After that you need to give the URL of the file and click OK.
5. It will load the JSON file in Microsoft Power Query where you can transform the JSON file before it gets opened in MS Excel.
6. After the transformation of your data in the JSON file, you need to close Power Query and it will load the data in the Excel workbook.
How do I import JSON to Excel 2016?
To import the JSON file in MS Excel 2016 version, follow the steps given below:
1. Open a New Excel workbook and go to the Data tab.
2. Choose the Get Data option and Choose From JSON.
3. After that specify the path to the JSON file and click OK.
4. It will fetch the file and take you to the Power Query Editor.
5. Now, you need to transform your JSON file to a table format.
6. And then you need to click on Close and Apply which will open the table in Excel.
How do I edit a JSON file in Excel?
To edit a JSON file in Excel, you need to import the file in Excel first. You can follow the steps discussed in this article to open a JSON file in Excel that will take you to Power Query Editor first. In the power query editor, you can edit the JSON file before importing it to Excel.
How do I convert JSON to CSV?
When you import the JSON file in Excel, it will open the Power Query editor and then you need to transform the JSON file to a table format. After all the transformations are done, you need to close the Power Query that will open the JSON table in MS Excel. Then you can save the table in CSV format from excel. This way, you can convert a JSON document into CSV.
How do I import data into Excel?
To import the data in Excel, go to the Data tab. There you will find various options to import the data such as From text/CSV, From Web, and Get Data. You can choose any of the options relevant to you and import the data in Excel.
Can Excel read JSON?
Yes, you can import the JSON data in MS Excel. But first, you need to convert the data into a table format which will be done in Power Query when you import the data. This way Excel reads the data from the JSON document.
How do I convert a JSON file to readable?
The steps below show how you can convert a JSON file to readable:
1. There is a tool named JSON to String that you can use to convert the JSON file.
2. After opening the tool, you need to copy and paste the JSON Code to the text editor.
3. You can also upload the JSON file to the tool that will convert it into readable.
4. After that click on JSON to String button and then you will see the conversion is started.
5. After successful conversion of JSON to readable, you can save and share the string data.
Can Excel pull data from an API?
Yes, you can use API to import data to excel. You need to go to the Data tab in Excel and choose the Get Data option. There you will see From other Sources option. Then you need to choose From Web from that list.
You will be asked for a URL where you can enter the API URL for the data you need to pull in Excel. This will import the data from the API call to Excel.
How do I convert API data to Excel?
To access the API Data in Excel, follow the steps below:
1. Open MS Excel and go to the Data tab.
2. There you will see a bunch of options to get data, you need to choose From other sources drop-down list.
3. In the list, you will see an option From OData Data Feed. You will need to use this option.
4. After that you will be asked for a link URL or the path for the file.
5. You can enter the URL of the results of the API service.
6. Then if the API is public, you don’t need to enter the User Name and Password. But in the case of the private API call, you will have to enter the User Name and Password to connect to the API.
7. After successful connection to the API, you will be asked to fetch the data that you need in Excel.
8. Click Next and it will save the data connection and finish the dialogue box.
9. Lastly you need to choose if you want to view the data in the existing worksheet or the new worksheet. There are other options too and you can choose any of them based on your needs. And it will download the data from the API to your excel.
This way you can convert the API data to Excel.
This tutorial is for you if you’re an Excel user who would like to learn how to extend your spreadsheets with data from APIs. You might be one of the people who spend most of their workdays in Excel and do calculations and visualizations but still work manually to import or even just copy and paste data from external sources.
If data is available from an API, however, there are various ways in which can consume it directly from Excel, saving you time and preventing errors.
That is, unfortunately, just as long you are using a Windows PC. The integrations presented in this article do not work in Excel for Mac or the web-based version of the Office apps.
BASF provides the Periodic Table of Elements API, which enables you to query the periodic table and retrieve all kinds of information about chemical elements.
We assume you came here from the Introduction to APIs. If not, please check out that document to learn the basics of APIs before continuing.
The Periodic Table of Elements API follows the CRUD/RESTful paradigm but implements only a subset. Specifically, the periodic table is read-only and allows HTTP GET requests exclusively. It is also limited to one resource called «element».
The base URL for the API is https://dev.api.basf.com/chemical/. Every endpoint starts with this URL.
For the elements, there are two endpoints. The first is a collection endpoint that allows you to either retrieve the full periodic table or request a subset of elements through filter parameters. It is called a collection endpoint because it always returns a collection data structure containing multiple items. The second is an individual resource endpoint that allows you to retrieve a single element.
Both endpoints return JSON-formatted responses.
All BASF APIs require authentication. The Periodic Table of Elements API uses an app-only context with an API key. If you haven’t done so, please read the introduction, terminology, and app-only context sections of the Authentication and Authorization guide. You can skip the part on the app and user context and OAuth as it is not required for this API.
To use authentication, you need to create an account and an application. The process gives you a Client ID, which you can then use as your API key. If you do not have an API key, follow the steps outlined in the Get Started guide. Make sure you select the API product BASF Periodic Table while creating your app.
In Excel for Windows, there are three options for getting external data from an API, which we’ll investigate throughout this article.
The first option is the built-in WEBSERVICE() function. Retrieving data from a URL is a single step. However, extracting the information is rather cumbersome as Excel doesn’t understand JSON responses and you have to use string processing functions. Also, as the function only supports the URL as a parameter, this works only with APIs that allow you to provide authentication information as part of the URL. The BASF Periodic Table of Elements API fits the criteria, as it uses a query string for authentication. For other APIs that require custom headers, though, you’re out of luck.
The second option is using VBA, Visual Basic for Applications, to write a Macro in Basic code to consume an API and fill the sheet programmatically. It is the most powerful and flexible option and should work with all kinds of APIs, but it requires you to have some basic programming knowledge.
The third option is the Power Query builder that allows you to gather and combine data from different sources, including APIs. If you have already used the Power Query builder, for example, to access a database directly, this is the sensible way to do it. It’s also a good choice if you do not want to work with code and the WEBSERVICE() option is too limited.
We’ll use an individual resource endpoint with the WEBSERVICE() function as well as the VBA macro, and we’ll demonstrate the collection endpoint with the Power Query builder.
Before we introduce the WEBSERVICE() function, let’s look at functions in Excel in general. They allow you to fill a table cell with computed data. To enter a function into a cell, you start with the equals sign (=), followed by the function name, a left parenthesis [(], your arguments (if needed), and a right parenthesis [)] to end. If there is more than one argument, you separate them with semicolons (;). A common function that you may have used is SUM(), which adds the data from a number of other cells and returns the result. It takes a range of cells as its argument.
The WEBSERVICE() function also takes one argument, a URL. Then, Excel issues an HTTP GET request to fetch whatever is available at that URL, and puts it into the cell as its result. If we want to do an API requests, since the function only allows a single argument, we have to encode the full API request into the URL. As mentioned before, this rules out APIs that require other HTTP methods (such as POST) or custom headers, e.g., for authorization. With the Periodic Table API, however, we put the API key in the URL and only need the GET method.
Open a new Excel workbook, and enter the following line into a cell, replacing the string APIKEY with the previously generated key:
=WEBSERVICE("https://dev.api.basf.com/chemical/elements/He?x-api-key=APIKEY")
Once you hit Enter or click on another cell, you should see a JSON structure describing the Helium element appear in your cell.

As mentioned before, every API endpoint starts with the base URL. For the Periodic Table API, that is https://dev.api.basf.com/chemical/. Then, the path to a resource or collection endpoint follows. In our example, we retrieved a single element, hence, we used a resource endpoint. Typically, the path to a resource starts with the pluralized resource name, followed by a slash (/) and finally an identifier. If you look at the URL above, you can identify elements/He as this path. The question mark (?) separates the parameter section, and you can see the x-api-key parameter that authenticates the request.
We can separate the base URL and the API key from the URL and build the URL dynamically through string concatenation. That is useful if you have multiple requests in the same Excel sheet and, let’s say, you want to share this sheet with another person who then provides a different API key. The other person then only has to enter their API key in one designated cell instead of modifying your API requests.
As next step, we’ll create a sheet that allows users to modify the base URL and API key in one place. We’ll also apply string processing functions to parse a single field from the JSON response. You can follow along these steps. If something is unclear or doesn’t work for you, you can compare your sheet with the screenshots as well as the full Excel workbook that we’ll provide as download further below.
Here we go:
- Type «Base URL» in A1 and the base URL https://dev.api.basf.com/chemical/ in B1.
- Type «API Key» in A2 and paste your API key from the developer portal in B2.
- Type «Element» as a header in A4 and some elements below it. As an example, we’ll put «H» in A5 and «N» in A6.
- Type «API URL» as a header in B4. To build the URL, concatenate the following elements: a reference to the field containing the base URL, «elements/», a reference to the field containing the element name, «?x-api-key=», and a reference to the field containing the API key. You need to use absolute references to base URL and API key and a relative reference to the element name. Your function call should look like this: =CONCAT($B$1;»elements/»;A5;»?x-api-key=»;$B$2)
- Type «API Response» as a header in C4. Make the webservice call using the URL you built in the previous step by typing =WEBSERVICE(B5) in C5. You should see a JSON API response appear in the cell.
- Type «Atomic Mass» as a header in D4. As there is no JSON parser in Excel, we copy a substring from the API response between the atomic_mass field and the subsequent field, covalent_radius. The whole function looks like this: =MID(C5;SEARCH(«atomic_mass»;C5)+13;SEARCH(«covalent_radius»;C5)-SEARCH(«atomic_mass»;C5)-16) You should now see only the atomic mass as a number in the cell.
- Select the cells B5 to D5, grab the right bottom corner, and drag them down to the B6 to D6. You should see the API URL, API response and atomic mass for the second element appear.
- To get the atomic mass for more elements, add a new element symbol in column A and copy or drag down the three other columns.
Please note that Excel function names are localized along with the Excel user interface. If your Excel installation is in German, replace the names based on this list:
- CONCAT – TEXTKETTE
- MID – TEIL
- SEARCH – SUCHEN

You can get a working Excel workbook in the PeriodicTableWebservice.xlsx file (TODO: add download).
Visual Basic for Applications, or VBA for short, is a powerful programming language that you can use to automate Microsoft Office applications, including Excel. VBA is closely related to, but not fully compatible with, other versions of the Basic language (such as Visual Basic .NET).
If you not worked with VBA before but have programming skills in a different language, you have to learn a new syntax, but should be able to understand the structure of the macro we build in this section.
Our goal is to retrieve various attributes of specific chemical elements (but not the entire periodic table). The sheet layout uses one row per element. The user should enter the element names into the first column of the sheet (A). Then, upon running the macro, it should go through the list of rows and fill the other columns with details. For example, the atomic mass in the second column (B) and the covalent radius in the third column (C).
Open Excel with a new, empty sheet. Then, press the combination Alt and F11 on your keyboard to launch the Visual Basic editor.
On the left side of the editor, you can see the project structure. There’s an entry for your sheet. Double-click on this entry to open the code view where you can enter Basic code that is specific to that sheet.

We start by creating two global string variables, one for the base URL and the API key. It helps us separate them from the code itself so we can swap them if necessary.
Dim baseUrl, apiKey As String
It’s not possible to assign a value to these variables yet. We’ll do that later.
As mentioned under the objective above, we need to retrieve specific elements that the user enters into the sheet, not the full periodic table. For this purpose, we use the API endpoint for specific elements and have to make multiple requests. Hence it is useful to develop an abstraction and put the logic for the API request into a function.
In VBA, you can define functions with the Function keyword. They have parameters with types and a return type. Here is the definition of our getElement() function:
Function getElement(id As String) As Object
Next, we create a script control. That is actually a workaround because there is no native JSON parser available and we don’t want to install a third-party module. The script control can execute JScript, which is a version of JavaScript, and thus understand JSON.
Dim scriptControl As Object
Set scriptControl = CreateObject("MSScriptControl.ScriptControl")
scriptControl.Language = "JScript"
Then, we can make an HTTP request to the API endpoint. VBA makes HTTP requests through the XMLHTTP object. While building the request, we use string concatenation to build the API URL and include the base URL and API key from the variables we defined earlier.
With CreateObject("MSXML2.XMLHTTP")
    .Open "GET", baseUrl + "elements/" + id + "?x-api-key=" + apiKey, False
    .send
Once we have a response, we can parse it with the script control and assign the result to the function name, which is VBA’s way of specifying the returned value for a function:
    Set getElement = scriptControl.Eval("(" + .responsetext + ")")
    .abort
After that, all is left is closing the With-block and the function. The VBA editor might have already generated this code for you automatically.
End With
End Function
Macros are public VBA subroutines. Let’s call ours getPeriodicElementData():
Public Sub getPeriodicElementData()
Inside the subroutine, we first assign some values to our global variables. Add these lines and replace APIKEY with your API key from the developer portal:
baseUrl = [https://dev.api.basf.com/chemical/](https://dev.api.basf.com/chemical/)
apiKey = "APIKEY"
Then, as we want to go through our sheet row by row to get element data, we set up a counter variable:
Dim row As Integer
row = 1
Our algorithm goes through all rows until it stops at an empty row. We can achieve this with a Do-Until-loop:
Do Until IsEmpty(Cells(row, 1))
Inside the loop, we call our getElement() function we created in the previous section. By using a With-block, we can access the attributes of the elements directly and write them in the cells. Our sample code reads two attributes, atomic mass and covalent radius, which go in the row of the current element and the second or third column respectively.
    With getElement(Cells(row, 1))
        Cells(row, 2) = .atomic_mass
        Cells(row, 3) = .covalent_radius
    End With
If you want, you can extend this code with more properties from the element object and put them in additional columns. Tip: Use the WEBSERVICE() function to get the full JSON structure so you can see the available properties.
Afterwards, make sure to increase the row variable, otherwise you have an infinite loop:
row = row + 1
Finally, we close the loop and the subroutine. The VBA editor might have already generated this code for you automatically.
Loop
End Sub
Before we can run the macro, we should add a couple of element symbols in the first column (A) so that the macro has something to do. As an example, use the elements H, S and O. Use one row for each, so that H is in the first, S in the second and O in the third row.
During development, you can run your macro directly from the VBA editor, using either the play button in the toolbar, the Run menu, or the F5 key on your keyboard.

The macro should run and automatically fill the other columns for your three rows.
To re-run your macro later when you’ve closed the VBA editor, follow these steps:
- Open the View ribbon.
- Click on Macros.
- Select the macro and click Run to execute.

The Power Query builder provides access to a variety of data sources. It even enables the combination of data from multiple sources. In this tutorial, though, we’ll just show you the basics to make an API call and display the results in your Excel sheet. We use the collection endpoint to retrieve the complete periodic table.
To get started, go to the Data ribbon, click the Get Data button, choose From Other Sources, and From Web.

In the popup window, enter the URL for the API. You can configure advanced settings such as HTTP headers for your request, but the BASF Periodic Table API doesn’t need any. You have to provide the full URL to the collection endpoint and add the query parameter for authentication directly into the URL. In the following sample, replace APIKEY with the Client ID of your application
https://dev.api.basf.com/chemical/elements?x-api-key=APIKEY
Once you confirm with OK, the Power Query Builder opens and shows the API response. At first, you just see the container element items. Right-click on it and select Drill Down.

Note the list of applied steps on the right side of the window. It shows you everything you did in the query builder and you can undo any step by clicking the X next to it.
Now you see a list of records and you can click on each to see the different attributes of each element. The next step is converting this list into a table and you do this by clicking the To Table button.

A popup with additional options may appear which you can simply confirm with OK. After that, you see the list as a table but it still has just one column that we need to expand into multiple columns so you can see each attribute of the element in its own column. To do so, click the expand icon (<>) in the column header.

In the popup, select the fields that you like or keep all fields intact. You can uncheck «Use original column name as prefix» as the prefix doesn’t provide any value when you’re just working with one data source.
Once you see the data you want in the query builder, your final step is transferring the table into the Excel sheet. You do this with the Close&Load button.

You’re done! Your excel sheet contains the periodic table of elements now.

Congratulations on making it through the tutorial! We hope it deepened your understanding of APIs and how to consume them with Excel. Feel free to contact developer@basf.com with feedback and questions.
How to Convert API Results: JSON to Excel or CSV
There are thousands of APIs, tools used by developers to connect data from one service to another. Many APIs have data that could be useful in everyday situations, and you don’t necessarily have to be a programmer to connect to the data. However, it can be helpful to have it in a format that is familiar and easy to use.
The trusty spreadsheet—whether it’s Excel, Google Sheets, Numbers, or any tool that can accept comma separated values (CSV) files—is the data tool of the non-programmer. We’ve grown accustomed to viewing our data as columns and rows. Most APIs produce a different data format, called JSON (or XML). It’s full of curly braces and doesn’t look very user-friendly. However, you can convert JSON to CSV or Excel to get the data in a more familiar format.
Find Your Data Source
Before you can convert your JSON, you need to have the data. Perhaps you already know where you’ll get your data, but if you’ve never used an API before, that can be intimidating. Once you know what to look for, though, accessing many APIs is as intuitive as loading a webpage.
First, to discover the API, there are a couple of approaches that work well once you know who has the data you want:
- Look in the footer or header of the website for the words “API,” “developer,” “partners,” or “integrations”
- Google it by searching for “website name API”
- Look in a directory like ProgrammableWeb.
Next, you’ll need to navigate the API documentation. The best APIs will have a “getting started” guide or similar tutorial for first-timers. It can still be intimidating, but you’re looking for descriptions of the type of data you want. For example, if you use a CRM and you’re wanting to get your contacts via API, look for sections of the documentation that reference “getting contacts” or “listing contacts.”

For our Halloween celebration map of events and our holiday light displays map, we went to Eventful and found “Developer API” in its footer. Within its API documentation, we saw an endpoint (which is like a web address URL) for /events/search. Using their examples, we could put together the API call right in the web browser: http://api.eventful.com/json/events/search?app_key=SECRETKEY&keywords=halloween&page_size=250&date=2018103000-2018110100
When you replace “SECRETKEY” with your API key, that returns a bunch of text. It’s in JSON format, but if you don’t know what to look for, it might not seem very useful.
Understand the JSON Results
Much of the time, JSON is returned as a giant wall of text, which is one reason it looks incredibly confusing to non-programmers (and many programmers can’t make much sense of it, either). One quick trick to make JSON more readable is to either “pretty print” it or get an extension such as JSONView for Chrome that automatically displays JSON with colors and indentation to make it easier to understand the data within.

Take the example above. It still may be daunting, but hopefully, some of it looks familiar. For example, can you tell the total number of results? Almost 3,000—as referenced by the total_items.
Most JSON data is stored as key/value pairs. That is, there is a way to reference a value (total_items in our example) and the value itself (2869). All related key/value pairs are stored within a single object, as denoted by the curly brackets { and }. Each pair is separated by a comma. There can be objects within objects by using more curly brackets as the value.
In addition, there’s one more important type of value, highly relevant to converting from JSON to CSV: an array or list. This is many values in a row, often many objects in a row. A list occurs between two sets of square brackets, [ and ].
Our example shows a primary object defined by the { on the first line, followed by a few key/value pairs, then e key called “events” whose value is an object. Within that object, there is a single key, “event” which includes a list value (the [ shows us this is a list) and the values within the list are yet more objects. There’s a lot to unpack there and understand, and it might be helpful to see the full JSON file displayed using JSONView.
Even if it’s confusing, the JSON will always have a structure you can figure out using these basic building blocks: objects with key/value pairs, where values can be additional objects or lists of values.
Convert JSON to Excel or CSV
Once you understand the type of data that can be converted, it’s time to make your JSON data usable in Excel. That means you need to convert the JSON either directly to an Excel document, or more likely to a text document that Excel can read, such as CSV.
Let’s look back at our Eventful data again. We need to extract the list of events, which are a series of objects. The key/value pairs in all of the event objects will all contain the same keys. The values will obviously be different since they describe individual events.
Therefore, in spreadsheet terms: the keys become the header row.
You can copy all the key/values, or just the ones you want. For example, we can see the “latitude” key in the screenshot from the previous section. That is a useful value for making a map!
If there’s only a small amount of data, you could make quick progress by copying and then pasting your data from JSON to a spreadsheet. However, most of the time there’s a lot of data. In our Eventful example, there were almost 3,000 events! Use a tool like this to convert file formats automatically.
Optional: Create a Map with Your Data
Many APIs and data sources include location data, such as addresses, city names, or latitude/longitude coordinates. Once your data is in spreadsheet format (as a CSV, Excel, Google Sheets, and more) you can easily create a map like this:
View 2018 Tour de France Route in a full screen map
Create a latitude and longitude map by copy-pasting your spreadsheet data in the cases where you have geographic coordinates. Otherwise, you can automatically geocode location names using our Google Map creator.
This article shows how to import data into Microsoft Excel using Power Query from a RESTful Weather API. This API returns JSON-based data. We are also going to explain how to create a loop within our script so that we can call the API multiple times for multiple locations and create a combined result table in our Excel worksheet.
To download the example workbook for this guide, please see the sample in our code repository at:
https://github.com/visualcrossing/WeatherApi/blob/master/Excel_Workbooks/TimelineWeatherAPI_Json.xlsx
Steps to import JSON data from RESTful API into Microsoft Excel
Here are the steps we will take:
- Choose a Weather API and create a sample query.
- Create a Power Query script in Microsoft Excel to import the data and create a table.
- Add a loop around multiple locations to demonstrate how to append multiple tables together
- Add parameters to the Power Query script so that we can make changes in Excel and have the data update automatically
Step 1 – Choose an API and create a sample query
We are going to use the Visual Crossing Weather API. This free API provides simple access to historical weather data as well as weather forecast. Before we can use the API, we have to create a free account. To do this, head over to the Weather Data Services page. In addition to creating your account, you can also create sample Weather API queries.
We will be using the Timeline Weather API that provides seamless access to historical and forecast weather. Here’s the sample weather API request we will model our Power Query Script around:
https://weather.visualcrossing.com/VisualCrossingWebServices/rest/services/timeline/Paris,France/2021-2-1/2021-2-17?unitGroup=us&key=YOUR_API_KEY
The items in bold are parameters for the location, date range and units of measurement – we will add a way for the user to modify these easily.
The above API request returns JSON formatted data. Here is sample of the data:
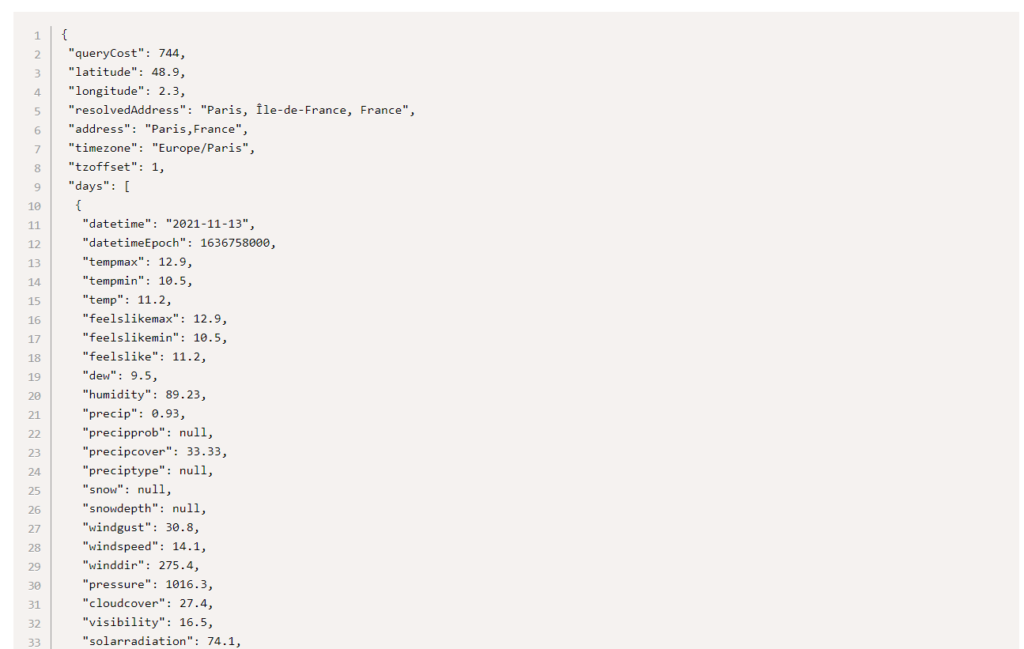
For full documentation on this Weather API, head over to the full Timeline Weather API documentation.
Step 2 – Create a Power Query script
Now that we have our Weather API query, we can start creating the Power Query script that will import the data into Excel. As Power BI also supports Power Query, you can also use these same concepts to import data into Power BI.
Here’s our first Power Query script:
let
ApiQuery="https://weather.visualcrossing.com/VisualCrossingWebServices/rest/services/timeline/paris%2Cfr/2021-2-1/2021-2-17?unitGroup=us&key=YOUR_API_KEY",
RawData=Web.Contents(ApiQuery),
JsonResult = Json.Document(RawData),
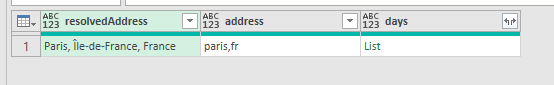
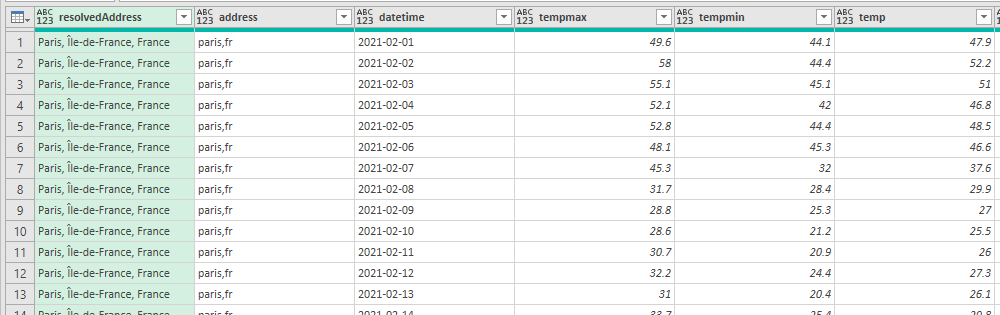
QueryResult= Table.FromRecords( { JsonResult } , {"resolvedAddress", "address", "days"})
in
#"QueryResult"This simple script simply retrieves sets up the variable ‘ApiQuery’ to contain the URL to the Weather API query, retrieves the contents (using Web.Contents). After retrieving the data, the script parses the result as JSON and creates a basic table output consisting of three columns – ‘resolvedAddress’, ‘address’ and the days array.
The ‘days’ list contains a list of multiple elements – one for each day of our weather data request representing the weather for that day. We would like to expand this array as rows of the output table. To do this, we add a few more lines to our script:
let
    ApiQuery="https://weather.visualcrossing.com/VisualCrossingWebServices/rest/services/timeline/paris%2Cfr/2021-2-1/2021-2-17?unitGroup=us&key=YOUR_API_KEY",
    RawData=Web.Contents(ApiQuery),
    JsonResult = Json.Document(RawData),
    QueryResult= Table.FromRecords( { JsonResult } , {"resolvedAddress", "address", "days"}),
    ExpandDaysAsRows = Table.ExpandListColumn(QueryResult, "days"),
    QueryResultExpanded = Table.ExpandRecordColumn(ExpandDaysAsRows, "days", {"datetime", "tempmax", "tempmin", "temp", "feelslikemax", "feelslikemin", "feelslike", "dew", "humidity", "precip", "precipprob", "precipcover", "preciptype", "snow", "snowdepth", "windgust", "windspeed", "winddir", "pressure", "cloudcover", "visibility", "solarradiation", "solarenergy", "sunrise", "sunset", "moonphase", "conditions", "source"},
              {"datetime", "tempmax", "tempmin", "temp", "feelslikemax", "feelslikemin", "feelslike", "dew", "humidity", "precip", "precipprob", "precipcover", "preciptype", "snow", "snowdepth", "windgust", "windspeed", "winddir", "pressure", "cloudcover", "visibility", "solarradiation", "solarenergy", "sunrise", "sunset", "moonphase", "conditions", "source"})
in
    #"QueryResultExpanded"
There are two steps to expanding the day rows. First we use ‘ExpandListColumn’ to expand the days list into multiple rows. Next we use ‘ExpandRecordColumn’ to expand each of the day records into multiple columns we would like on our output table. We provide a list of parameters to expand and how we would like to set the column names of our table.
Step 3- Add a loop around multiple locations to append multiple tables using Power Query
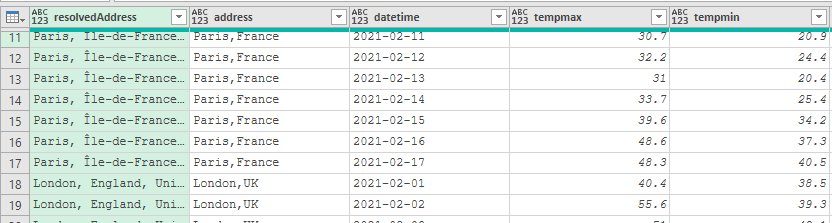
We now have the weather data for a single location loaded into Excel. Let’s create a merged table of weather data for multiple locations. Conceptually this is simple – run the above Weather API query multiple times and join the tables together!
To do this, we first create a Power Query method based on the above script. We can then call this in a loop to create the combined results:
let
    WeatherApi.Results = (location) => let
        ApiQuery="https://weather.visualcrossing.com/VisualCrossingWebServices/rest/services/timeline/" & location & "/2021-2-1/2021-2-17?unitGroup=us&key=YOUR_API_KEY",
        RawData=Web.Contents(ApiQuery),
        JsonResult = Json.Document(RawData),
        QueryResult= Table.FromRecords( { JsonResult } , {"resolvedAddress", "address", "days"}),
        ExpandDaysAsRows = Table.ExpandListColumn(QueryResult, "days"),
        QueryResultExpanded = Table.ExpandRecordColumn(ExpandDaysAsRows, "days", {"datetime", "tempmax",...}, {"datetime", "tempmax",...})
    in
        #"QueryResultExpanded",
        FinalMergedResults=WeatherApi.Results("Paris,France")
in
    FinalMergedResults
In this script, we’ve moved the above code into a function called ‘WeatherApi.Results’ which we call with a text location (“Paris, France”). Notice that we now add the location into ApiQuery variable dynamically so we can easily call the function with different location addresses. The result of this stage is the same – the weather for Paris, France.
So now we call our function in a loop and append the results:
let
    WeatherApi.Results = (location) => let
        ApiQuery="https://weather.visualcrossing.com/VisualCrossingWebServices/rest/services/timeline/" & location & "/2021-2-1/2021-2-17?unitGroup=us&key=YOUR_API_KEY",
        RawData=Web.Contents(ApiQuery),
        JsonResult = Json.Document(RawData),
        QueryResult= Table.FromRecords( { JsonResult } , {"resolvedAddress", "address", "days"})
    in
        #"QueryResult",
        Locations=Table.FromRows({{"Paris,France"}, {"London,UK"}, {"Hamburg,Germany"}}, {"Location"}),
        InsertedResults = Table.AddColumn(Locations, "Results", each  WeatherApi.Results([Location])),
        AllResults=Table.Column(InsertedResults, "Results"),
        CombinedResults = Table.Combine(AllResults),
        ExpandDaysAsRows = Table.ExpandListColumn(CombinedResults, "days"),
        FinalMergedResults = Table.ExpandRecordColumn(ExpandDaysAsRows, "days", {"datetime", ...}, {"datetime", ...})

in
    FinalMergedResults
In this script we loop through a list of locations created directly in the script. We then ‘WeatherAPI.Results for each item in the list using the ‘each’ method.
These results are combined together using ‘Table.Combine’. Note that the expansion of the days and columns has been moved outside of the method and is performed after the tables have been combined.
Step 4 – Add parameters to the Power Query script
Finally we’d like to add some parameters to our script so that we can change parameters on a Excel sheet and provide a list of locations. This will be a lot easier than editing the script every time!
To create the parameters we will create a series of named ranges in Excel. Then we can references those named ranges in the script. First we create a series of single-cell named ranges for each of the API parameters.
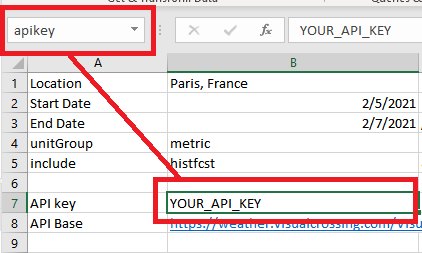
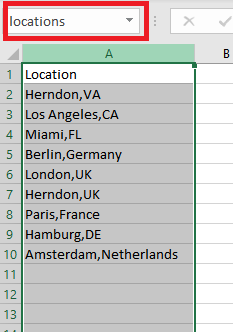
Now we create a range for a full Worksheet column to read the list of locations. We create a named range called ‘locations’:
Now we can modify our script to use these named ranges. Within our function, we create the ApiQuery from these parameters:
//read the parameters from the Workbook named ranges
apibase=Excel.CurrentWorkbook(){[Name="apibase"]}[Content]{0}[Column1],
startdate=Excel.CurrentWorkbook(){[Name="startdate"]}[Content]{0}[Column1],
enddate=Excel.CurrentWorkbook(){[Name="enddate"]}[Content]{0}[Column1],
unitGroup=Excel.CurrentWorkbook(){[Name="unitGroup"]}[Content]{0}[Column1],
key=Excel.CurrentWorkbook(){[Name="apikey"]}[Content]{0}[Column1],
include=Excel.CurrentWorkbook(){[Name="include"]}[Content]{0}[Column1],

//construct the ApiQuery by appending the parameters
ApiQuery=apibase & location &
  (if startdate<>"" then "/" & DateTime.ToText(startdate,"yyyy-MM-ddThh:mm:ss") else "") &
  (if startdate<>"" and enddate<>"" then "/" & DateTime.ToText(enddate,"yyyy-MM-ddThh:mm:ss") else "") &
  "?unitGroup=" & unitGroup & "&key=" & key &
   (if include<>"" then "&include=" & include else ""),
The second part of the parameterization reads our list of locations:
 Locations=Excel.CurrentWorkbook(){[Name="locations"]}[Content],
 #"Filtered Rows" = Table.SelectRows(Locations, each [Column1] <> null and [Column1] <> ""),
#"Promoted Headers" = Table.PromoteHeaders(#"Filtered Rows", [PromoteAllScalars=true]),

InsertedResults = Table.AddColumn(#"Promoted Headers", "Results", each  WeatherApi.Results([Location])),
Reading the list of locations from the location range is a multi-step process. First we read access the named range. Then we filter down the rows to remove the null values. Finally we use the first row as the header. We can then pass the list to the Table.AddColumn method that we had from our previous step.
We now have a fully parameterized, multiple location RESTful API example that reads from a JSON-based Weather API and merges the result into a single table.
Questions or need help?
If you have a question or need help, please post on our actively monitored forum for the fastest replies. You can also contact us via our support site or drop us an email at support@visualcrossing.com.