
Курсы валют через Power Query
Добрый день, уважаемые читатели блога! Сегодня речь пойдёт снова о загрузке курсов валют, только теперь мы обратимся к криптовалютам.
Основным источником данных о котировках будут служить биржи — Kraken, Binance, Poliniex, Bitterex и прочие. Что их объединяет? Ответ прост — API (application programming interface, программный интерфейс приложения, если по-русски).
Самое забавное, что к этому интерфейсу нельзя обратиться с помощью простого web запроса в Excel. Как мы это делали раньше. Выход есть — использовать Power Query.
Power Query — это специальная технология получения и анализа данных от компании Microsoft. Для Excel 2016 её отдельная установка не требуется (пакет уже включён в программу), для всех остальных версий придётся качать отдельно, также нужно обратить внимание на разрядность вашего офиса (х32, х64).
ССЫЛКА
Скачали, установили и теперь в Excel появится новая вкладка — POWER QUERY.

Вкладка выглядит следующим образом:

В принципе можно рассматривать Power Query как надстройку над вкладкой «Данные», так как у нас расширяется выбор источников получения данных.
Ну что ж, теперь перейдём непосредственно к загрузке. Цель — получить соотношение покупки продажи криптвалютных пар (ETH/BTC). К примеру, нужно загрузить курс с биржи Binance.
Весь труд будет в следующем — найти API биржи и его «руководство пользователя». Для нашей биржи оно находится по адресу:
https://github.com/binance-exchange/binance-official-api-docs/blob/master/rest-api.md
Базовой точкой входа будет:
https://api.binance.com/
И далее идёт пространное описание возможностей синтаксиса. Экспериментальным путём и опираясь на это руководство пользователя, выяснилось следующее: для получения данных по конкретной паре валют необходимо указать путь до «бегущей строки» биржи и прописать символьное обозначение пары.
Вот так:
https://api.binance.com/api/v3/ticker/price?symbol=ETHBTC
- v3 — версия api биржи;
- ticker — «бегущая строка» котировок;
- price?symbol=ETHBTC — текущая стоимость продажи.
Воспользуемся полученной ссылкой. Переходим на вкладку «Power Query» и нажимаем кнопку «Из интернета» (она самая первая). Перед нами появится окно с запросом источника загрузки данных, в поле «URL адрес» записываем адрес интересующей пары. Для загрузки остальных нужно просто поменять краткие названия криптовалют в конце строки.

Нажимаем «ОК» и попадаем в редактор запроса и представления на листе Excel.

Видим, появился редактор, данные и параметры запроса. Мы находимся на вкладке «Конвертировать». Перейдём на вкладку «Просмотр» и поставим галку «Строка формул», чтобы видеть запрос в привычном представлении.

Возвращаемся на вкладку «Конвертировать» и нажимаем кнопку «В таблицу».

Поскольку нам ничего пока больше не нужно, в появившемся окне нажимаем «Закрыть и загрузить», чтобы данный запрос появился на листе.

В результате получим вот такую картину.

Цель достигнута, курсы подгрузились. Теперь нужно настроить их на автоматическое обновление. Справа у нас есть столбец «Параметры запроса», щелкаем правой кнопкой мышки по нашем запросу и выбираем «Свойства», ставим галку «Быстрая загрузка» -> Ок.

Далее мы оказываемся на вкладке «Конструктор», в блоке кнопок «Данные из внешней таблицы» щёлкаем по треугольнику после кнопки «Обновить», затем выбираем пункт «Свойства подключения». В следующем окне нужно настроить время обновления нашего запроса.

Проставляем галки как на рисунке. Тем самым мы добиваемся автоматического обновления котировок в течение одной минуты, а если нам нужно — можем обновить сами по нажатию кнопки. Нажимаем «ОК».
Готово! Ждём минуту, курс обновляется сам. Теперь котировки будут подгружаться автоматически.
Единственный минус — для большого количества запросов придётся всё создавать ручками, что в свою очередь будет сильно нагружать программу Excel при обновлении курсов криптовалют.
Давайте что-нибудь проанализируем.. Например, историю торгов? Это и в принципе полезно, и скиллы набьются полезные… В общем план такой – научиться вытаскивать нужные данные с биржи, экспортировать в Excel, ну и что-нибудь с ними делать. Понятно, что не руками  Поехали!
Подготовка.
Нам потребуется
а) Установленный питон с модулем requests (как установить читайте тут)
б) Установленный модуль openpyxl – но тут всё просто, запустите командную строку и вбейте pip install openpyxl
Проверка
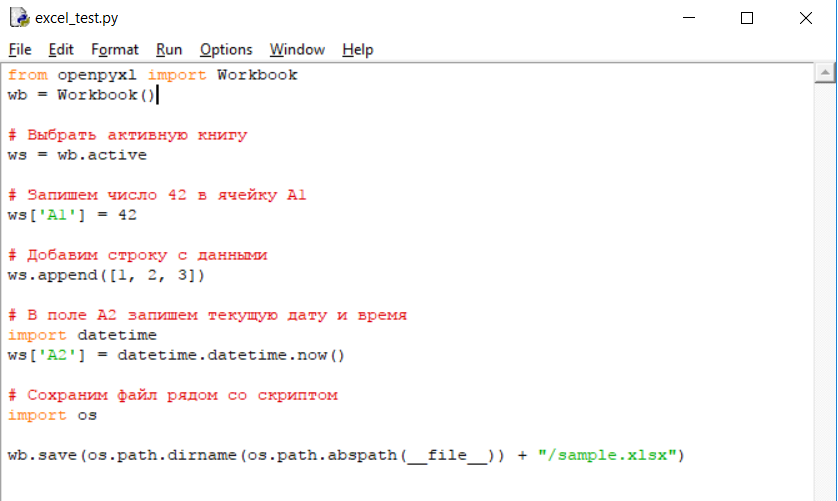
После того, как вы все установили, давайте проверим, создаются ли валидные Excel файлы. Простейший пример (взятый с официального сайта) показывает, как создать новую книгу, внести туда данные и сохранить:
from openpyxl import Workbook
wb = Workbook()

# Выбрать активную книгу
ws = wb.active

# Запишем число 42 в ячейку А1
ws['A1'] = 42

# Добавим строку с данными
ws.append([1, 2, 3])

# В поле А2 запишем текущую дату и время
import datetime
ws['A2'] = datetime.datetime.now()

# Сохраним файл рядом со скриптом
import os

wb.save(os.path.dirname(os.path.abspath(__file__)) + "/sample.xlsx")
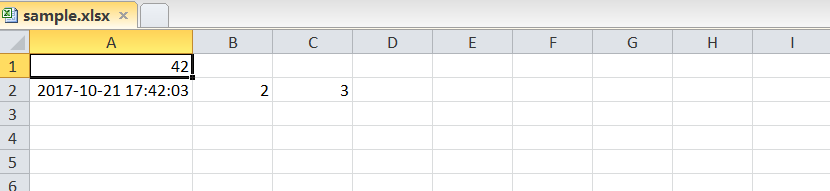
Копируем этот код, вставляем в IDLE (опять же, подробности тут), сохраняем под каким-нибудь именем (у меня это excel_test.py) и запускаем (F5). В папке рядом со скриптом должен появиться файл sample.xlsx.
Можно открыть его экселем и посмотреть, что внутри:
Реклама
История торгов из Exmo в Excel
Ок, работает, писать данные можем. Теперь давайте попробуем забрать с exmo.me всю историю торгов. Точнее не так – всю историю Эксмо не дает, а дает максимум 10 000 последних торгов по паре.
Вот код – вставим в IDLE, сохраним как exmo_excel.py и запустим (о том, что такое API и как работать с ним на Exmo читайте в других статьях цикла – ссылки в конце статьи, над комментариями).
import urllib, http.client
import os
import time
import json
# эти модули нужны для генерации подписи API
import hmac, hashlib

from openpyxl import Workbook
from datetime import datetime, timezone

# ключи API, которые предоставила exmo
API_KEY = 'K-...'
# обратите внимание, что добавлена 'b' перед строкой
API_SECRET = b'S-...'

# базовые настройки
API_URL = 'api.exmo.com'
API_VERSION = 'v1'

# Свой класс исключений
class ScriptError(Exception):
    pass
class ScriptQuitCondition(Exception):
    pass

# все обращения к API проходят через эту функцию
def call_api(**kwargs):
    payload = {'nonce': int(round(time.time()*1000))}

    if kwargs:
        payload.update(kwargs)
    payload =  urllib.parse.urlencode(payload)

    H = hmac.new(key=API_SECRET, digestmod=hashlib.sha512)
    H.update(payload.encode('utf-8'))
    sign = H.hexdigest()

    headers = {"Content-type": "application/x-www-form-urlencoded",
           "Key":API_KEY,
           "Sign":sign}
    conn = http.client.HTTPSConnection(API_URL, timeout=60)
    conn.request("POST", "/"+API_VERSION + "/" + kwargs['method'], payload, headers)
    response = conn.getresponse().read()

    conn.close()

    try:
        obj = json.loads(response.decode('utf-8'))

        if 'error' in obj and obj['error']:
            raise ScriptError(obj['error'])
        return obj
    except json.decoder.JSONDecodeError:
        raise ScriptError('Ошибка анализа возвращаемых данных, получена строка', response)

# Получим список всех пар, по которым торгует биржа
pairs_list = []
pairs = call_api(method='pair_settings')
for pair in pairs:
    pairs_list.append(pair) # сложим их в словарь

pairs_str = ','.join(pairs_list) # из словаря создадим строку, с парами, разделенными запятыми

# Получим историю торгов по всем парам
trades = call_api(method='user_trades', pair=pairs_str, limit=10000)
for pair in trades: # пройдемся по каждой паре
    if not trades[pair]: #пропускаем пары, по которым не было торгов
        continue
    # Теперь проходим по всем торгам этой пары
    print(pair, len(trades[pair]))
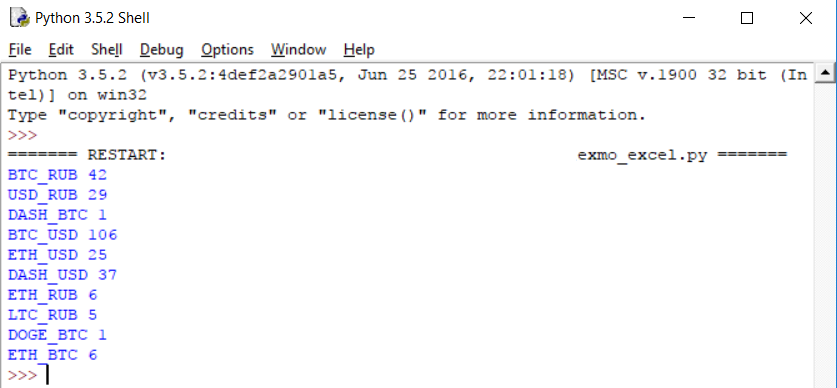
Должны увидеть список пар, по которым торговали, и кол-во полученных сделок по каждой их них. У меня это выглядит так:
Не лишним будет упомянуть, что есть торги по сути. Когда вы выставляете ордер на продажу, например 1 BTC, биржа подбирает для вас покупателей. Ваш ордер может быть исполнен в одну сделку – если кто-то сразу купит ваш биткоин целиком, либо в несколько – когда ваш биткойн раскупят по частям. Так вот, история торгов – это история именно таких сделок.
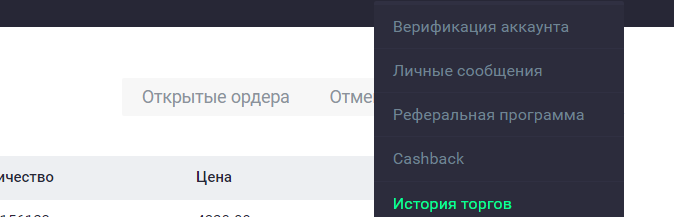
Вообще, стоило бы сравнить с историей торгов на сайте Эксмо, но там как будто специально неудобно сделано.. В общем, похоже на правду, на этом и остановимся пока. Если что, историю торгов можно смотреть тут (раздел сделки):
Теперь, собственно, нужно объединить оба скрипта, что бы получить историю торгов и выгрузить в эксель. Немного магии и вуаля:
import urllib, http.client
import os
import time
import json
# эти модули нужны для генерации подписи API
import hmac, hashlib

from openpyxl import Workbook
from datetime import datetime, timezone

# ключи API, которые предоставила exmo
API_KEY = 'K-...'
# обратите внимание, что добавлена 'b' перед строкой
API_SECRET = b'S-...'

# базовые настройки
API_URL = 'api.exmo.com'
API_VERSION = 'v1'

# Свой класс исключений
class ScriptError(Exception):
    pass
class ScriptQuitCondition(Exception):
    pass

# все обращения к API проходят через эту функцию
def call_api(**kwargs):
    payload = {'nonce': int(round(time.time()*1000))}

    if kwargs:
        payload.update(kwargs)
    payload =  urllib.parse.urlencode(payload)

    H = hmac.new(key=API_SECRET, digestmod=hashlib.sha512)
    H.update(payload.encode('utf-8'))
    sign = H.hexdigest()

    headers = {"Content-type": "application/x-www-form-urlencoded",
           "Key":API_KEY,
           "Sign":sign}
    conn = http.client.HTTPSConnection(API_URL, timeout=60)
    conn.request("POST", "/"+API_VERSION + "/" + kwargs['method'], payload, headers)
    response = conn.getresponse().read()

    conn.close()

    try:
        obj = json.loads(response.decode('utf-8'))

        if 'error' in obj and obj['error']:
            raise ScriptError(obj['error'])
        return obj
    except json.decoder.JSONDecodeError:
        raise ScriptError('Ошибка анализа возвращаемых данных, получена строка', response)

# Получим список всех пар, по которым торгует биржа
pairs_list = []
pairs = call_api(method='pair_settings')
for pair in pairs:
    pairs_list.append(pair) # сложим их в словарь

pairs_str = ','.join(pairs_list) # из словаря создадим строку, с парами, разделенными запятыми

# Создадим Excel файл
wb = Workbook()
ws = wb.active
# Вставим заголовки
ws.append(["Дата сделки", "Пара сделки", "ID ордера", "ID сделки", "Тип сделки", "Кол-во по сделке", "Цена сделки", "Сумма сделки"])

# Получим историю торгов по всем парам
trades = call_api(method='user_trades', pair=pairs_str, limit=10000)
for pair in trades: # пройдемся по каждой паре
    if not trades[pair]: #пропускаем пары, по которым не было торгов
        continue
    # Теперь проходим по всем торгам этой пары
    for trade in trades[pair]:
        # Мы бы могли использовать метод dict.values(), но нам нужны данные в определенном порядке, причем каждый раз для каждого массива, так что немного усложним код
        # Форматируем и вставляем строку с данными в Excel
        ws.append([
            datetime.fromtimestamp(trade['date'], timezone.utc), # дата сделки
            pair, # Пара сделки
            trade['order_id'], # ID ордера
            trade['trade_id'], # ID сделки
            'Покупка' if trade['type'] == 'buy' else 'Продажа',
            float(trade['quantity']), # Кол-во по сделке
            float(trade['price']), # Цена сделки
            float(trade['amount']) * (-1 if trade['type'] == 'buy' else 0.998), # сумма сделки, если buy то отрицательная - так удобнее считать потом
        ])

# Сохраняем файл
wb.save(os.path.dirname(os.path.abspath(__file__)) + "/exmo_excel.xlsx")
print('Работу закончил')
Вставляем этот код в IDLE, сохраняем, запускаем.. У вас должен появиться Excel-файл exmo_excel.xlsx рядом со скриптом. Откроем, посмотрим.
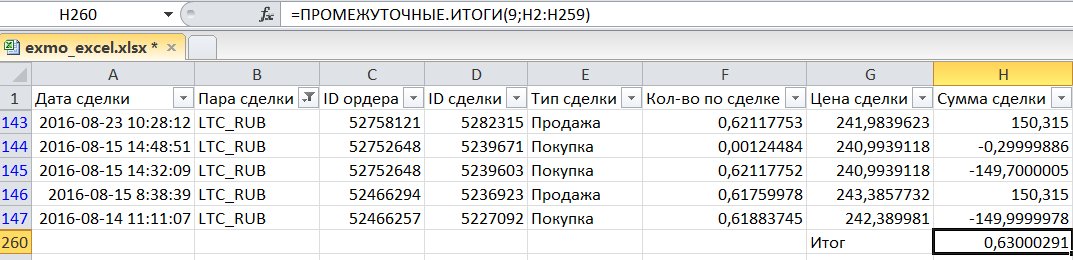
Я поставил фильтр по паре LTC_RUB, что бы еще раз акцентировать внимание на сделках, так в файле все торги по всем парам (точнее, последние 10 000 торгов). В первой колонке время сделки (по времени биржи), в остальных вроде понятно, объясню про ID ордера и ID сделки.
Смотреть стоит по времени, т.е. снизу вверх. 14 августа я на почти 150р купил 0, 618LTC по курсу 242,38. Для этого я создавал отложенный ордер (52466257), который был исполнен в рамках одной сделки (5227092).
После этого я, видимо, выставил отложенный ордер на продажу купленного (52466294), который исполнился опять же одной сделкой.
После этого я создал отложенный ордер на покупку (62752648), который был исполнен частями –обратите внимание, что тут две строки с одним и тем же номером ордера и одной и той же ценой, но разными суммами, временем и id сделки. Т.е. сначала кто-то купил почти всё, а потом кто-то еще докупил, что осталось.
Ну а потом сработала еще одна продажа купленного.
Если сложить все суммы сделки (вот почему покупку мы делали отрицательной), то получим сальдо или как там его – мне больше нравится слово профит, хотя и «прибыль» тоже ничего. В данном случае вроде бы 63 копейки прибыли, но….. Тут, насколько я вижу, хотя надо бы и проверить, сумма указывается ДО вычета комиссии биржи – 0.2%.
Если еще раз обратите внимание, то первую сделку я провел за 150 рублей, купив 0,618LTC, а продаю 0,617LTC – потому что часть купленного в LTC съела комиссия (рубли не псотрадали). Когда же я продаю купленное, комиссия берется с рублей – но тут я не вижу, что бы это отражалось. Поэтому, наверное, более точно было считать так (дополнил столбец руками):
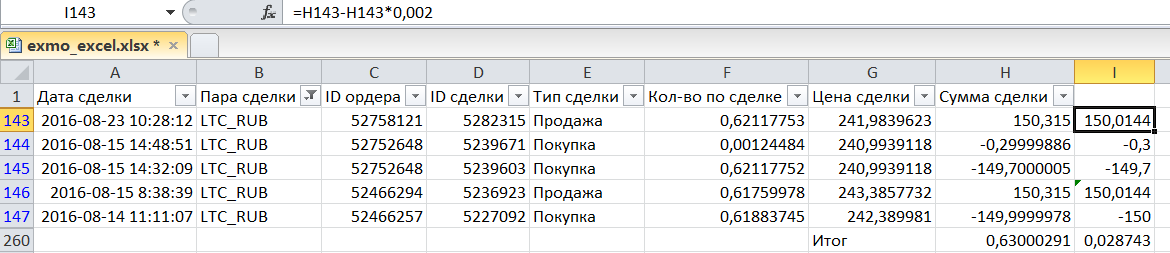
Для положительных сумм сделок мы вычитаем комиссию 0.2% (формула видна на рисунке), отрицательные считаем как есть – так правильно. Итого, профит составил 2,8 копейки, юхууу))
Не помню, что я тестил на этой паре год назад, и какие настройки прибыльности стояли, но в общем имейте в виду такую выдачу инфы, что через API, что на сайте.
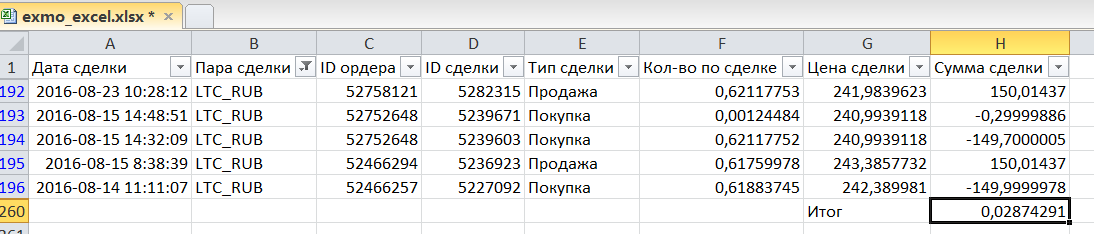
Если хотите, можете сразу выводить в эксель прибыль за вычетом комиссии. Для этого строку
float(trade['amount']) * (-1 if trade['type'] == 'buy' else 1),
нужно заменить на
float(trade['amount']) * (-1 if trade['type'] == 'buy' else 0.998),
итог будет правильным:
В общем, делайте с экселем теперь что хотите, стройте графики или сводные таблицы, инструмент для получения данных у вас есть.
Реклама
История торгов из Yobit в Excel
Ну и как бонус давайте сделаем тоже самое для биржи yobit.net. Тут уже будет меньше комментариев, т.к. по сути ничего не меняется, только немного кода. Более детально о том, как работать с API yobit, читайте так же по ссылкам в конце статьи.
В общем, вот код, вбивайте свои ключи, запускайте.. Он будет работать мучительно долго, т.к. во первых очень много пар, а во вторых, после каждой пары добавлено time.sleep(1), что бы вас Yobit не забанил.. Хотя, он может быть и так не забанит, так что можете удалить эту строку и все пойдет шустрее, но это на свой страх и риск.
import os
import json
import requests
import math
import time
import urllib, http.client
import hmac, hashlib

from openpyxl import Workbook
from datetime import datetime, timezone

# Вписываем свои ключи
API_KEY = '...'
API_SECRET = b'...'

"""
    Каждый новый запрос к серверу должен содержать увеличенное число в диапазоне 1-2147483646
    Поэтому храним число в файле поблизости, каждый раз обновляя его
"""
nonce_file = "./nonce"
if not os.path.exists(nonce_file):
    with open(nonce_file, "w") as out:
        out.write('1')
# Будем перехватывать все сообщения об ошибках с биржи
class YobitException(Exception):
    pass

def call_api(**kwargs):

    # При каждом обращении к торговому API увеличиваем счетчик nonce на единицу
    with open(nonce_file, 'r+') as inp:
        nonce = int(inp.read())
        inp.seek(0)
        inp.write(str(nonce+1))
        inp.truncate()

    payload = {'nonce': nonce}

    if kwargs:
        payload.update(kwargs)
    payload =  urllib.parse.urlencode(payload)

    H = hmac.new(key=API_SECRET, digestmod=hashlib.sha512)
    H.update(payload.encode('utf-8'))
    sign = H.hexdigest()

    headers = {"Content-type": "application/x-www-form-urlencoded",
           "Key":API_KEY,
           "Sign":sign}
    conn = http.client.HTTPSConnection("yobit.net", timeout=60)
    conn.request("POST", "/tapi/", payload, headers)
    response = conn.getresponse().read()

    conn.close()

    try:
        obj = json.loads(response.decode('utf-8'))

        if 'error' in obj and obj['error']:
            raise YobitException(obj['error'])
        return obj
    except json.decoder.JSONDecodeError:
        raise YobitException('Ошибка анализа возвращаемых данных, получена строка', response)

res = requests.get('https://yobit.net/api/3/info') # получаем данные info
res_obj = json.loads(res.text) # переводим полученный текст в объект с данными

pairs = [pair for pair in res_obj['pairs']] # создадим массив названий пар

# Создадим Excel файл
wb = Workbook()
ws = wb.active
# Вставим заголовки
ws.append(["Дата сделки", "Пара сделки", "ID ордера", "ID сделки", "Тип сделки", "Цена сделки", "Сумма сделки"])

for pair in pairs:
    try:
        print ('Получаем историю торгов по паре %s' % pair, '*'*30)
        data = call_api(method="TradeHistory", pair=pair)
        if(data.get('return')):
            for t in data['return']:
                trade = data['return'][t]
                ws.append([
                    datetime.fromtimestamp(int(trade['timestamp']), timezone.utc), # дата сделки
                    pair, # Пара сделки
                    trade['order_id'], # ID ордера
                    t, # ID сделки
                    'Покупка' if trade['type'] == 'buy' else 'Продажа',
                    float(trade['rate']), # Цена сделки
                    float(trade['amount']) * (-1 if trade['type'] == 'buy' else 1), # сумма сделки, если buy то отрицательная - так удобнее считать потом
                ])
        else:
            print('Торгов не было')
        #time.sleep(1)
    except YobitException as e:
        print("Облом:", e)

wb.save(os.path.dirname(os.path.abspath(__file__)) + "/yobit_excel.xlsx")
print('Работу закончил')
Когда оно всё доработает, рядом с файлом появится файл yobit_excel.xslx, можете открывать и делать выводы. Опять же, если нужно вычитать комиссию, то воспользуйтесь советом выше, для эксмо. Если что-то не будет работать или будет работать не так, пишите, поправим.
Удачи!

Одним из простых способов получения данных из криптовалютных торговых бирж в программу MS Excel для дальнейшего использования или анализа , это вставка программного кода в сам Excel.
Программа на VBA подключается к бирже через API и в зависимости от того, какие вы хотите получить данные меняете строку подключения. В результате получаете данные в виде стоки, которую в дальнейшем в коде можно распарсить по своему усмотрению.
Вот простой пример получения текущей цены торгуемой пары EOS/ETH с биржи Binance:
Private Sub Workbook_Open()
    Set XMLHTTP = CreateObject("Microsoft.XMLHTTP")
    XMLHTTP.Open "GET", "https://api.binance.com/api/v3/ticker/price?symbol=EOSETH", False

    XMLHTTP.Send
    If XMLHTTP.statustext = "OK" Then
        txt = XMLHTTP.responseText
        Cells(2, 5) = txt
        txt = Mid(txt, 29, 10)
        Cells(2, 3) = txt
    End If
    XMLHTTP.abort
    Set XMLHTTP = Nothing

End Sub
Эта простенькая программа считываемую строку, для примера, выводит в ячеку MS Excel вот в таком виде:
{«symbol»:»EOSETH»,»price»:»0.02672500″}
Ну а дальше вырезает текущую цену с помощью функции VBA MID начиная с 29 символа и длиной 10 и вставляет в другую ячейку Excel.
Можно конечно нужное значение строки вырезать и другими функциями VBA, например Replace, заменяя ненужные символы пустой строкой, но это дело вкуса каждого.
Например так, в два этапа
txt = Replace(txt,"{""symbol"":""EOSETH"",""price"":""", "")

txt = Replace(txt, """}", "")
Вот таким простым способом можно взаимодействовать с криптовалютными биржами через MS Excel на VBA.
Комментарии закрыты
Файлы к уроку:
- Для спонсоров Boosty
- Для спонсоров VK
Ссылки:
- Страница курса
- Плейлист YouTube
- Плейлист ВК
Описание
В этом уроке мы научимся получать прямо в Excel котировки разных ценных бумаг с сайта Московской биржи.
Решение
Московская биржа предоставляет возможность скачивать котировки и другую информацию по ценным бумагам при помощи специальных ссылок.
Если мы введем такую ссылку в Power Query, создав запрос из интернета, то получим интересующие нас котировки прямо в Excel.
Вот ссылка на сайте Московской биржи https://iss.moex.com/iss/reference/ На этой странице вы можете увидеть какую именно информацию вы можете получить с сайта Московской биржи. Котировками дело не ограничивается.
Все ссылки конструируются примерно по одному шаблону. В этом примере мы разберем получение котировок при помощи Power Query, но если вам нужна какая-то другая информация, то вы по аналогии сможете создать похожую ссылку.
Наша ссылка будет выглядеть так — https://iss.moex.com/iss/history/engines/stock/markets/shares/securities/SBER/securities.xml
В том месте, где написано SBER нужно вставить тикер интересующей вас ценной бумаги. Далее, развернув таблицу, вы получите таблицу с котировками, но только 100 строк. Это максимальное количество, которое позволено выгружать. Нам нужно что-то придумать, чтобы выгружать больше строк.
Что делать, чтобы получить много строк? Нужно использовать параметр start. Мы создадим столбец с числами с инкрементом 100 и в каждой строке будем запрашивать информация по ссылке.
Примененные функции
- Xml.Tables
- Web.Contents
- List.Numbers
- Table.FromList
- Splitter.SplitByNothing
- ExtraValues.Error
- Table.AddColumn
- Text.From
- Table.SelectColumns
- Table.ExpandTableColumn
- Table.TransformColumnNames
- Text.AfterDelimiter
Код
Пример получения 100 строк:
let
   source = Xml.Tables(
      Web.Contents(
         "http://iss.moex.com/iss/history/engines/stock/markets/shares/securities/SBER/securities.xml?start=300"
      )
   ){0}[Table]{0}[rows]{0}[row]
in
   source
Пример получения 4000 строк:
let
   source = List.Numbers(1, 40, 100),
   to_table = Table.FromList(
      source,
      Splitter.SplitByNothing(),
      null,
      null,
      ExtraValues.Error
   ),
   table_add_col = Table.AddColumn(
      to_table,
      "Пользовательская",
      each Xml.Tables(
         Web.Contents(
            "http://iss.moex.com/iss/history/engines/stock/markets/shares/securities/SBER/securities.xml?start="
               & Text.From([Column1])
         )
      ){0}[Table]{0}[rows]{0}[row]
   ),
   cols_select = Table.SelectColumns(table_add_col, {"Пользовательская"}),
   col_expand_table = Table.ExpandTableColumn(
      cols_select,
      "Пользовательская",
      {
         "Attribute:BOARDID",
         "Attribute:TRADEDATE",
         "Attribute:SHORTNAME",
         "Attribute:SECID",
         "Attribute:NUMTRADES",
         "Attribute:VALUE",
         "Attribute:OPEN",
         "Attribute:LOW",
         "Attribute:HIGH",
         "Attribute:LEGALCLOSEPRICE",
         "Attribute:WAPRICE",
         "Attribute:CLOSE",
         "Attribute:VOLUME",
         "Attribute:MARKETPRICE2",
         "Attribute:MARKETPRICE3",
         "Attribute:ADMITTEDQUOTE",
         "Attribute:MP2VALTRD",
         "Attribute:MARKETPRICE3TRADESVALUE",
         "Attribute:ADMITTEDVALUE",
         "Attribute:WAVAL"
      },
      {
         "Attribute:BOARDID",
         "Attribute:TRADEDATE",
         "Attribute:SHORTNAME",
         "Attribute:SECID",
         "Attribute:NUMTRADES",
         "Attribute:VALUE",
         "Attribute:OPEN",
         "Attribute:LOW",
         "Attribute:HIGH",
         "Attribute:LEGALCLOSEPRICE",
         "Attribute:WAPRICE",
         "Attribute:CLOSE",
         "Attribute:VOLUME",
         "Attribute:MARKETPRICE2",
         "Attribute:MARKETPRICE3",
         "Attribute:ADMITTEDQUOTE",
         "Attribute:MP2VALTRD",
         "Attribute:MARKETPRICE3TRADESVALUE",
         "Attribute:ADMITTEDVALUE",
         "Attribute:WAVAL"
      }
   ),
   types = Table.TransformColumnNames(
      col_expand_table,
      each Text.AfterDelimiter(_, ":")
   )
in
   types
Этот урок входит в курс Веб-запросы в Power Query
| Номер урока | Урок | Описание |
|---|---|---|
| 1 | Котировки Yahoo Finance | Вы хотите получить историю котировок акций MCD с 2000 года по текущий день с сайта Yahoo Finance. Вы копируете ссылку на раздел с историческими данными, вставляете ссылку в Power Query и получаете только 100 строк. |
| 2 | HTML, получение данных по облигациям | Мы хотим получить данные по всем облигациям со страницы bonds.finam.ru |
| 3 | Многостраничное извлечение | На разных страницах находятся сайта находятся котировки золота на каждый год. Нужно соединить все данные в одну таблицу. |
| 4 | JSON, Котировки Yahoo Finance 2 | В этом уроке мы разберем еще один способ скачивания котировок с Yahoo Finance. Этот способ намного удобнее и быстрее. Здесь мы научимся обрабатывать формат JSON. |
| 5 | Котировки Московской биржи | В этом уроке мы научимся получать прямо в Excel котировки разных ценных бумаг с сайта Московской биржи. Московская биржа предоставляет возможность скачивать котировки и другую информацию по ценным бумагам при помощи специальных ссылок. Если мы введем такую ссылку в Power Query, создав запрос из интернета, то получим интересующие нас котировки прямо в Excel. |
| 6 | Неразмеченный текст | Вы делаете запрос к Web-странице и сталкиваетесь с неразмеченным текстом. Вы хотите при помощи Power Query этот неразмеченный текст преобразовать в нормальную красивую таблицу. |
| 7 | Текстовый документ, веб-страница, List.Zip | В этом запросе мы научимся получать нужную информацию из текста веб-страницы. |
| 8 | Youtube Data API | В этом уроке мы научимся получать данные из Youtube Data API. Узнаем как получить данные о Youtube канале: список видео и плейлистов, названия, описания, длительность, тэги, количество лайков, дизлайков, просмотров и комментариев. |
| 9 | Личный OneDrive — подключаемся напрямую к файлам и папкам | В этом уроке мы разберем как напрямую подключиться к файлам и папкам на личном OneDrive. |
| 10 | Подключение Google Spreadsheets, Google Drive (Excel.Workbook, Web.Contents) | В этом уроке мы научимся подключаться к xlsx файлам, которые находятся в вашем Google Drive. |
| 11 | Получить все станции метро | Получим таблицу с перечнем станций метрополитена даже с координатами широты и долготы. |
| 12 | Получить ссылки с веб-страницы (Html.Table) | Получить URL с веб-страницы. Сделать запрос к каждому URL, получить таблицы и объединить их всех по вертикали. |
| 13 | Получить все URL с веб-страницы | Получим нужные URL с веб-страницы в Excel. Сделать запрос к каждому URL, получить таблицы и объединить их по вертикали. |
| 14 | Ищем работу через API Head Hunter (hh.ru) | Получим таблицу с перечнем вакансий с сайте HH. Получим вакансии, в названии или описании которых встречаются слова SQL, Pandas, Power Query, Power Pivot, Power BI. |
| 15 | Запрос к XML Sitemap | Сделаем запрос к sitemap.xml, чтобы извлечь список всех веб-страниц сайта. |
I am often asked about linking Interactive Brokers quotes to Macroption calculators and to Excel in general. IB offers several ways to do that and although (or because) their documentation is very detailed, the task may be a bit overwhelming to a non-technical person.
Here is the simplest way you can get Interactive Brokers quotes into Excel, step by step (there are only three steps).
Step 1: Install IB API
The technology that enables your Excel (and other programs) to access Interactive Brokers data is called API – Application Programming Interface, or in this case IB Excel API.
So the first step is to download and install IB API to your computer.
Go to:
https://interactivebrokers.github.io
Agree to terms.
Choose the stable version for your operating system (Windows or Mac/Unix).
Download and install.
Note: You don’t have to «run» this software every time you want to use IB data in Excel. Just having it installed does the job.
Step 2: Enable API Access in IB TWS
Next step is to enable IB API to access data from your IB TWS (Trader Workstation – Interactive Brokers trading platform).
Inside your IB TWS, go to (Global) Configuration -> API -> Settings.
Check the item «Enable ActiveX and Socket Clients».
You’ve just told your IB TWS that its data can be accessed by some software on your computer.
That’s it for the setup. You can now open Excel, write a formula into a cell and if all goes well you will see quotes from IB updated in real time.
Step 3: IB Quotes Excel Formulas
The formulas are quite simple. I list a few examples below, but it is best to see official documentation for more examples and full list of parameters:
RTD Server for Excel > Simple Syntax
RTD Server for Excel > TWS RTD Server Samples
Note: There are three types of syntax for these formulas: Simple, Complex, and Mixed. They differ in the way individual inputs (details like symbol, exchange, or currency) are arranged in the formula. For now let’s stick with Simple.
Forex (and Explanation of General Format)
Let’s get IB bid quote for the EUR/USD exchange rate in Excel.
The formula is:
=RTD("Tws.TwsRtdServerCtrl",,"EUR.USD/CASH","Bid")It has four parameters:
"Tws.TwsRtdServerCtrl"is the same for all formulas.- The second is empty (notice there are two commas).
- Symbol (in this case
"EUR.USD/CASH"). - Type of quote, named Topic in the documentation. It can be
"Bid","Ask","Last", or many other things. If omitted, it defaults to"Last".
Once you enter the formula in an Excel cell and hit Enter, you should see the EUR/USD rate updating in real time.
If something goes wrong, you will see an error message instead of the quote.
For example, if you try to get a quote for an invalid symbol like "ABC.USD/CASH", you will see this text in the Excel cell:
TwsRtdServer error: No security definition has been found for the requestStocks
Following the same logic as forex above, the formula for IBM stock bid price is:
=RTD("Tws.TwsRtdServerCtrl",,"IBM","Bid")Because the same stock can trade on multiple exchanges, you can also specify the exchange to only get quotes from that exchange:
=RTD("Tws.TwsRtdServerCtrl",,"IBM@NYSE","Bid")Without the exchange specified, the symbol "IBM" is the same as "IBM@SMART".
Real-Time vs. Delayed Quotes
You may get the following error:
TwsRtdServer error: Requested market data is not subscribed. Displaying delayed market data...This happens when you request data for a symbol for which you don’t have real-time data subscription. You can still get delayed data – just replace "Bid", "Ask", or "Last" in the formula with "DelayedBid", "DelayedAsk", "DelayedLast".
Indexes
This formula gets the last value of the VIX index from the CBOE exchange:
=RTD("Tws.TwsRtdServerCtrl",,"VIX@CBOE//IND")Same logic as stocks, but notice the extra //IND at the end of index symbol.
Futures
With futures you also need to specify expiration:
=RTD("Tws.TwsRtdServerCtrl",,"ES@GLOBEX//FUT/202009///USD","Bid")Options
With options you also need the strike and option type (call/put):
=RTD("Tws.TwsRtdServerCtrl",,"AAPL@SMART//OPT/20200717/C/360/USD","Bid")Quote Types
Besides bid, ask, and last, there are many different kinds of quotes you can request:
- «BidSize»
- «Bid»
- «Ask»
- «AskSize»
- «Last» (default)
- «LastSize»
- «High»
- «Low»
- «Volume»
- «Close»
- «Open»
- «LastTime»
For options also things such as:
- «BidImpliedVol»
- «BidDelta»
- «BidUndPrice»
- «AskImpliedVol»
… and much more. For full list see:
Simple Syntax > Topic
Plugging IB Data into Macroption Calculators
The typical use case is having the underlying price input updated in real time in Black-Scholes Calculator, Binomial Option Pricing Calculator, Option Strategy Payoff Calculator, or Option Strategy Simulator.
The easiest and fastest way to do that is to enter the IB data formula directly in the underlying price yellow input cell.
For example, instead of hard typed IBM stock price, enter this formula in the underlying price input cell:
=RTD("Tws.TwsRtdServerCtrl",,"IBM")You will have underlying price updated in real time, as well as all the calculated option prices, Greeks, and P/L.
Alternatively, you can set up another input cell for symbol and refer to that cell in the IB formula. The formula in the underlying price input cell becomes:
=RTD("Tws.TwsRtdServerCtrl",,Symbol)… where Symbol is the cell where you enter the stock symbol.
In Option Portfolio Manager the IB data formulas are already implemented and you only need to enter the symbol you want (in the correct IB symbol format as explained above).
Overview
Purposes of the TWS API
- Allows you to automate manual activities that you would normally do in TWS.
- Subscribe to market data and market depth information. Subscriptions in the Excel API refer to electing to view or extract certain data from TWS, such as requesting real-time or historical data.
- Extract historical data and process large volumes of that kind of information.
- Execute algorithms and trading strategies which require automation.
- Automates access to account, portfolio and trade information.
TWS API Trading
The API is all about the trader building an application to his or her own personal needs and specifications. Algorithmic trading is possible via proprietary
technology built by the customer and customized to the customer’s needs and goals.
- You can subscribe to 100 simultaneous market data tickers via the API. If
you unsubscribe then subscribe to new ones, you can look at many more
than just 100 tickers in a trading day. That initial 100 limit can be increased
if commission volume justifies that. Increase your allowance of
simultaneous quotes windows by purchasing monthly Quote Booster packs. - You can place or modify orders for any order type accepted by TWS
except baskets and conditional orders, which the API can do, just in
different ways. - Execution reports and portfolio updates lets you see the composition of
your portfolio and any changes to it as they occur. - Account and portfolio updates let you see your account’s financial status
and portfolio composition as trading occurs, and lets you maintain
automated books and records. - An important point to make about the DDE/Excel spreadsheet, as well as
the test clients for the other API technologies is that because they are
open source, they provide the basis for you to build your own application. - The commission structure when using the API is the same as the
commission structure that applies to TWS.
TWS API Technologies
We offer several TWS API technologies:
- DDE for Excel, which is accessed via the TwsDde.xls Excel spreadsheet. This API technology is intended for beginners.
- ActiveX, via provided COM Components for Visual Basic, Visual C++, C# and the .NET framework.
- The socket library, which is accessed via Visual C++, C#, POSIX and Java.
- TWS’s market data, extended order, combo order, bond and derivatives trading capabilities are fully supported.
Download and Install the API Software
Although we will focus on the DDE for Excel today, all of the API technologies have open source test clients that are included in the API installation program. Each API technology has its own sample application, including the TwsDde.xls Excel spreadsheet that we will access in today’s webinar.
To access the API software page from the IB Web site, click Trading | API Solutions | IB API button, then API Software. Click the I Agree button on the license agreement page to open the API software download page. In the Windows column, click the IB API for Windows button. This opens a File Download box, where you can decide whether to save the installation file, or open it. Choose Save and then select a place where you can easily find it.
Configure TWS to Allow the API Connection
To use the ActiveX API sample application, you first need to configure TWS to allow the type of API connection you are using.
- Start TWS, then select Global Configuration in the File menu.
- Select API in the left panel, then check the Enable DDE Clients check box.
To start the installation wizard, go to the place where you saved the file, double-click the filename and hit next to move through the installation.
Connect the Excel API to TWS
Now that the TWS has been configured to allow the connection to the DDE/Excel API application, the next step is to connect the Excel API application to the TWS.
- Open the TwsDde.xls Excel spreadsheet that was installed with the rest of the API technologies.
- Click on the button that says Enable Macros.
- Finally, connect each page in the Excel API spreadsheet to the TWS by entering your TWS user name into the appropriate cell on each Excel page.
Exploring TWS Excel DDE Tutorials
The Dynamic Data Exchange (DDE) protocol is a method of inter-process
communication developed by Microsoft. DDE makes it possible for TWS to
communicate with other applications such as MS Excel.
One of the most common inquiries we receive at Interactive Brokers is how to
export data from TWS into Excel. In the API Reference Guide, please find two
basic tutorials that explain how to retrieve market data and historical data through
MS Excel via the TWS DDE for Excel API. All of the VBA code included in this
tutorial is kept to a minimum and is intended to be illustrative.
The sample API applications are merely demonstrations of the API capabilities
aimed at experienced programmers who will in turn use them as a reference to
develop more complex and robust systems.
Getting Started with Sample Spreadsheet
Connect the Excel API to TWS
Now that the TWS has been configured to allow the connection to the DDE/Excel
API application, the next step is to connect the Excel API application to the TWS.
- Open the TwsDde.xls Excel spreadsheet that was installed with the rest of
the API technologies. - Click on the button that says Enable Macros.
- Finally, connect each page in the Excel API spreadsheet to the TWS by
entering your TWS user name into the appropriate cell on each Excel
page.
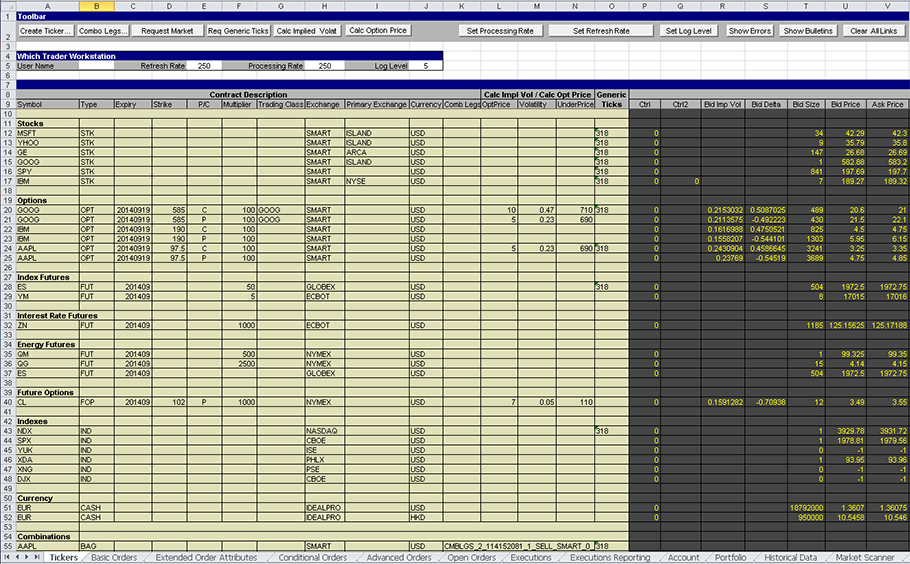
Requesting Market Data
In the Excel API spreadsheet, you subscribe to market data on the Tickers page.
- Get market data for stocks, combos, futures, options, foreign exchange and bonds.
- Options market data includes implied volatility and delta ticks for the last trade and the NBBO (National Best Bid and Offer), as well as options model values, so that you can you use the option modeler in the TWS to setup your own volatility curves and then subscribe to those model values and model volatilities from the API.
- An important point to remember about market data subscriptions is that you can cancel them when you no longer want to watch a particular ticker.
- The Excel API supports IB SmartRouting, which searches for the best firm stock, option, and combination prices available at the time of your order, and seeks to immediately execute your order electronically.
Adding a Ticker
To see more market data, you simply add more tickers. To add a ticker:
- Insert a blank row if necessary, then click in the Symbol cell on the row.
- 2Click the Create Ticker button in the Toolbar section of the page.
- 3Enter information about the contract description.
- For stocks, enter the symbol, type, exchange and currency.
- For options, enter the symbol, type, expiry, right, multiplier, exchange and currency.
- For futures, enter the symbol, type, expiry, exchange and currency.
You can also just type the required information into the appropriate cells, select the entire row, and then click Request Market Data at the top of the spreadsheet.
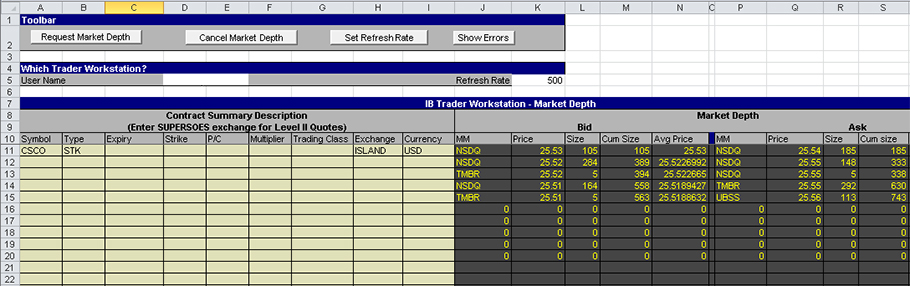
Market Depth
Market depth displays the range of prices in the market to help you gauge market liquidity.
- The Excel API spreadsheet includes a Market Depth page which lets you subscribe to market depth.
- Market Depth in the Excel API shows five rows of data for each underlying.
- As market depth changes, real-time update messages are sent to the application so that you can see the depth of market in real-time as the various market makers post their bids and offers.
- You can cancel market depth subscriptions when you no longer need to subscribe to market depth information.
- You can get the NYSE open book market depth and Nasdaq TotalView data as long as you’ve signed up for those Market Data Subscriptions. You subscribe to these on the Account Management page, which is accessible from TWS.
For market depth, all you have to do is enter the contract description information, then click in the symbol cell and click the Request Market Depth button. In the Excel API, you get a maximum of five rows of market depth.
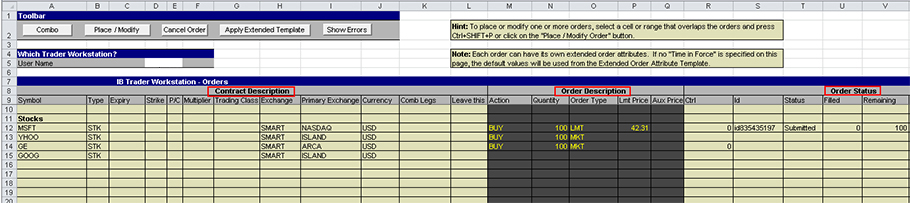
Placing an Order
Contract descriptions are displayed on the left side of the spreadsheet while descriptions of actual orders are displayed in the center of the spreadsheet. On the right side of the spreadsheet, you can see that each order has a different status (PreSubmitted, Filled, and Submitted). To the far right, you will see institutional and extended order attribute values.
- On a blank row, enter the information in the appropriate cells in the Contract Description section, depending on the type of instrument:
- In the Order Description section, enter the Action (Buy or Sell), Quantity, Order Type, and Limit Price if it’s a limit order or Aux Price if it’s a stop order, in the appropriate cells.
- Press the Tab key to move to the next empty cell in the row, then click the Place/Modify Order button.
- Scroll to the right to see the cells in the Order Status section get filled in automatically.
Placing a Basket Order
- Enter the appropriate information in the Contract Description and Order information cells in multiple rows.
- To select a group of contiguous orders, highlight the first order, hold down the Shift key, and highlight the last order. To select a group of non-contiguous orders, hold the Ctrl key down as you select each order.
- Click the Place/Modify Order button.
- Scroll to the right to see the cells in the Order Status section get filled in automatically.
Viewing Open Orders
The Open Orders page shows you all transmitted orders.
- You can view open orders if you subscribe to them on the Open Orders page.
- Once you subscribe to open orders, the Open Orders page is updated every time you submit a new order, either through the Excel API spreadsheet or TWS.
Trade Executions
Once you have placed an order or two, you can view the completed trades on the Executions page.
- To view execution details on this page, you must first subscribe to them. You do this by clicking the Subscribe to Executions button in the Toolbar section of the page.
- In the Excel API, execution reporting is done on the Executions page.
- It’s important to remember that the executions reported to your API application match the executions displayed in the TWS Trades window.
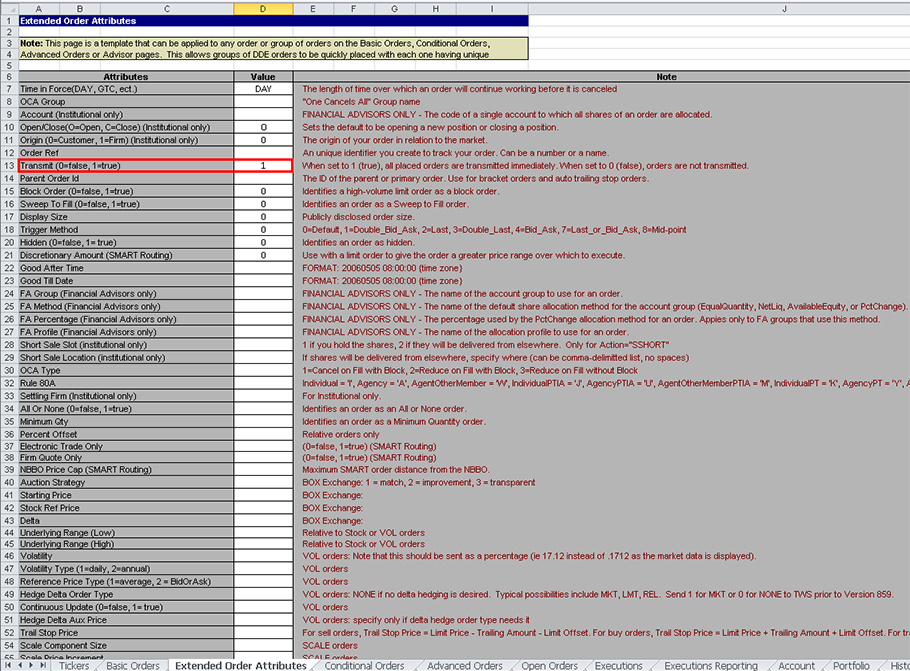
Extended Order Attributes
The DDE/Excel API supports extended order attributes. You can see these on the Extended Order Attributes page. The extended attributes match the extended attributes that are in the TWS.
- The Extended Order Attributes page is a template. This means that any value you enter in the fields on this page will apply to ALL orders you transmit unless you specify a different attribute value for an order on the Orders page. Extended order attributes are only applied to orders if you enter a value on this page.
- Starting on the left side of the page, you can see the attributes, their current values if there are any, and the descriptions of the attributes.
Note: The Transmit value — when set to 1 (true), all placed orders are transmitted immediately. When set to 0 (false), orders are not transmitted.
The Advanced Orders Page
You place and modify orders that require the use of Extended Order Attributes on the Advanced Orders page. This page is exactly the same as the Basic Orders page; we’ve separated advanced orders from basic orders in the sample spreadsheet to make it easier for you to learn how to place more complex orders, such as Bracket, Trailing Stop Limit, Scale, Volatility and Relative orders. Each of these order types require you to use the Extended Order Attributes page.
Tip: Hover your mouse over the red arrow in the Multiplier column to view order set-up steps.
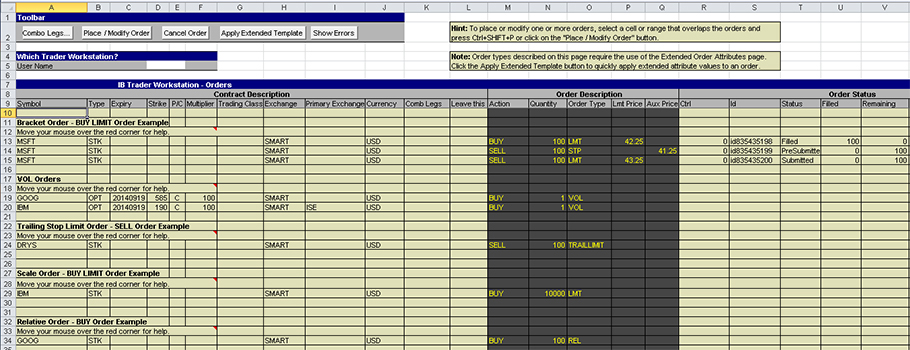
Placing a Bracket Order
To place a BUY-LMT bracket order:
- Enter the contract descriptions and order descriptions for all three orders on three contiguous rows:
- The first order should be a BUY LMT order.
- The second order should be a SELL STP order.
- The third order should be a SELL LMT order.
- Go to the Extended Order Attributes page and change the Value for Transmit to 0 (row 13).
- This ensures that your orders are not transmitted until you have completed the order setup.
- Go to the Advanced Orders page, highlight the first order in the bracket order, then click the Place/Modify Order button.
- The order is not executed, but the system generates an Order ID.
- Copy the Order ID for the first order, omitting the «id» prefix, then go to the Extended Order Attributes page and paste the Order ID into the Value cell for Parent Order Id (row 14). This value will be applied to all subsequent orders until you remove it from the Extended Order Attributes page.
- The first order of the bracket order is now the primary order.
- Go to the Advanced Orders page, highlight the second order and click the Place/Modify Order button.
- The order is not executed but is now associated with the primary order by means of the Parent Order Id extended order attribute.
- Go to the Extended Order Attributes page and change the Value for Transmit back to 1 (row 13).
- Go to the Advanced Orders page, highlight the third order and click the Place/Modify Order button.
- The entire bracket order is transmitted.
- Delete the value for Parent Order Id from the Extended Order Attributes page.
Account and Portfolio Updates
- You can see detailed information about your account if you subscribe to Account Updates on the Account page.
- You can cancel your Account Update subscription at any time by clicking the Cancel Account Subscription button.
- You can also clear all the account data from the page by clicking the Clear Account Data button.
Once you subscribe to Account Updates in the Excel API spreadsheet, the Account page displays a variety of details about your account, including various financial values, available funds, and more. Here’s a list of Account Values referenced on the Account page.
You can view your portfolio if you subscribe to Portfolio Updates on the Portfolio page.
The columns on the Portfolio page are the same as the columns displayed in the Portfolio section of the TWS Account window.
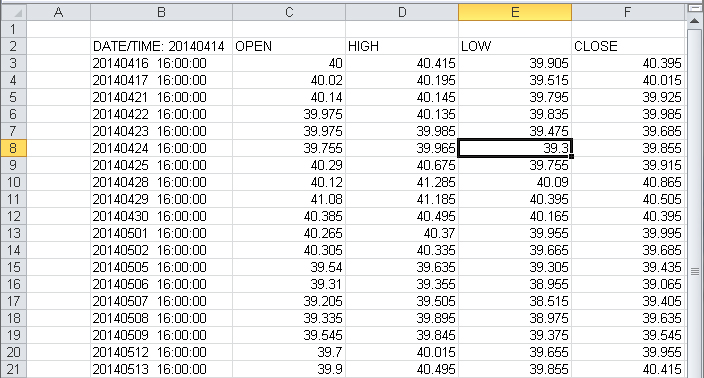
Historical Data
Use the Historical Data page to request historical data for an instrument based on data you enter in a query. This information is the same as charting a contract in TWS, except that the information is presented to you in rows on a spreadsheet.
- API historical data requests allow you to extract the entire previous calendar year.
To enter an historical data query, fill in the following fields in the Query Specification section, then click in any blank cell in that row and click the Request Historical Data button:
- End Date/Time in the format: yyyymmdd{space}HH:mm:ss{space}{TMZ}
For example, 20140714 18:25:18 GMT. - Duration (X seconds, minutes, days, etc.)
For example, 1 W, 1 Y, 1 M, 300 S, 1 D. - Bar Size: Enter the integer value that represents the desired bar size:
| Bar Size String | Integer Value |
|---|---|
| 1 SEC | 1 |
| 5 SEC | 2 |
| 15 SEC | 3 |
| 30 SEC | 4 |
| 1 MIN | 5 |
| 2 MIN | 6 |
| 3 MIN | 16 |
| 5 MIN | 7 |
| 15 MIN | 8 |
| 30 MIN | 9 |
| 1 HOUR | 10 |
| 1 DAY | 11 |
| 1 WEEK | 12 |
| 1 MONTH | 13 |
| 3 MONTHS | 14 |
| 3 YEAR | 15 |
- What to Show (MIDPOINT, TRADES, BID, ASK, or BID_ASK)
- RTH Only: set to zero (0) to get data outside of regular trading hours
- Date Format Style: Set this to 1 to apply dates to bars in the format «yyyymmdd{space}{space}hh:mm:dd» (the same format already used when reporting executions). Set this to 2 to return the dates as an integer specifying the number of seconds since 1/1/1970 GMT.
- Page Name: the title of the results page that will be created.
Excel shows the results of your query on a separate page in the spreadsheet created specifically for these results. When you define the query parameters, you can include a name for the results page in the Page Name field.
Note: There are some limitations in the way TWS API handles historical data requests. Specifically, requesting the same historical data in a short period of time can cause extra load on the backend and cause pacing violations. For more information on these pacing violations, see Historical Data Limitations in the API Reference Guide.
Market Scanners
Use the Market Scanner page to subscribe to market scanners in the Excel API spreadsheet. The TwsDde.xls spreadsheet included in the API comes with several market scanners set up and ready to use.
- You access the same data in the DDE/Excel API that is used in the TWS Market Scanner.
- The results of each market scanner subscription are displayed on their own page in the spreadsheet.
- API Scanner subscriptions update every 30 seconds, just as they do in TWS. In fact if you run the same scan, you will see the same data returned.
The Market Scanner page lists available market scans and includes the elements of each scan, which are the same kind of parameters that the TWS allows you to select. If you run the same scan in the spreadsheet as you run on the TWS, you will get the same results. For a complete list of elements that make up a market scan, see the API Online Reference Guide.
The Activate Page column tells the spreadsheet whether or not to display the scan results page on top of the Excel window. If you set this to TRUE, the results page for each market scanner subscription will display on top of your window every time it updates.
Contract Details
You can request contract details on the Contract Details page.
- Contract details include:
- a list of order types for this contract
- a list of exchanges on which a contract is traded
- conid, which is the unique contract ID
- minimum price tick
- order size multiplier
- market name
- trading class
- The Bond Contract Details page is similar to the Contract Details page, except it lets you get information about bond contracts from TWS. Bond contract details include such information as coupon, maturity, issue date of the bonds, credit ratings on the bonds, whether the coupons are fixed, etc.
Starting from the left side of the page, you see the contract summary descriptions, then the contract details. Note the Order Types and Exchanges columns; these list all the available order types and exchanges for that contract.
To request a contract, enter Contract Summary information and then click on the Request Contract Details button.
Looking at the Code
The real power of the Excel API is the Visual Basic code behind the scenes. You will definitely gain a better understanding of the Excel API spreadsheet by looking at the code.
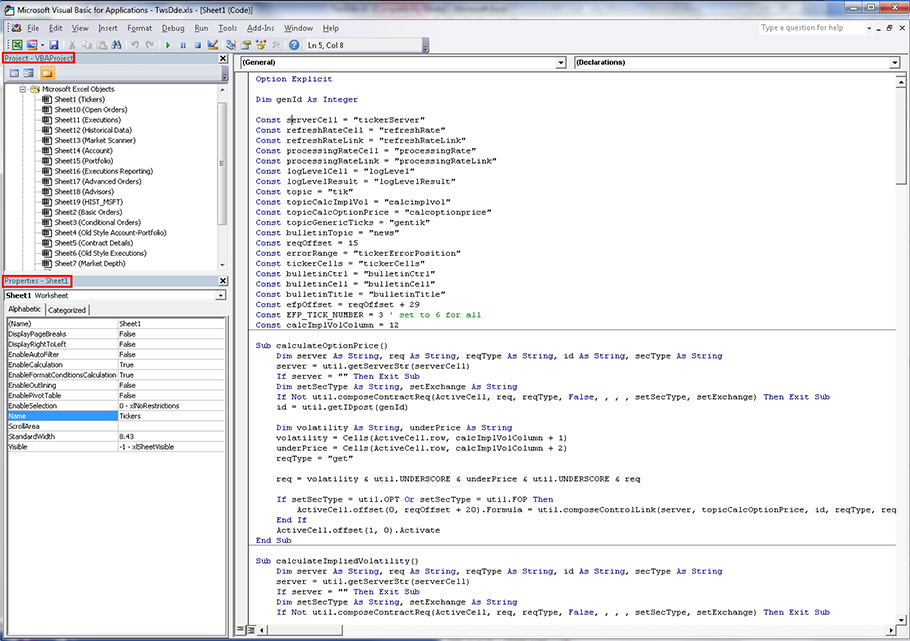
- To view the code, press Alt+F11 From any page in the spreadsheet. The Visual Basic Editor opens.
For those of you who are unfamiliar with the Visual Basic Editor, there are three main areas of the Visual Basic Editor window:
- Project Explorer
- Properties Window
- Code Window
You can see the Microsoft Excel Objects in the Project Window that correspond to the pages in the spreadsheet. Double-click any of them to display the code for that page. There are also additional forms and code modules used by the rest of the code that you can see if you scroll down in the Project Window.
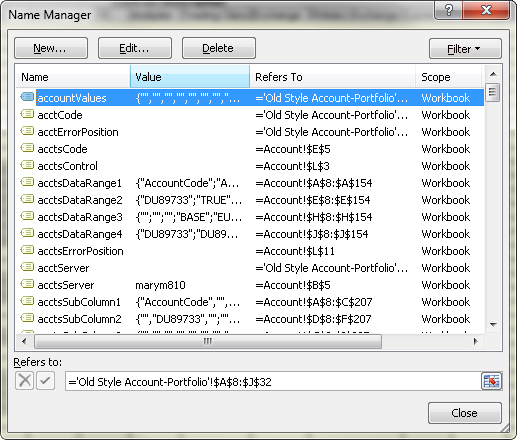
Named Ranges
Named ranges are meaningful names that you can assign to a single cell or a range of cells in Microsoft Excel. The TwsDde.xls API spreadsheet uses named ranges throughout the VB code, and a good way to get a feel for how the code works is to find the named ranges and see where they are used in different code modules.
To find the named ranges used in spreadsheet:
- In Excel 2010, you can see a complete list of all named ranges used in the spreadsheet by clicking Formulas > Name Manager. The Name Manager displays every named range used in the spreadsheet, the value of the range, and the page and range of cells covered by the range. As you can see, this can be very useful in learning how our spreadsheet uses values from different pages in the VB code.
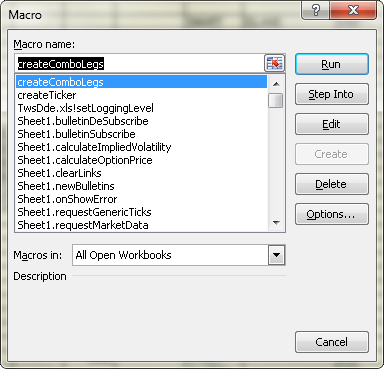
Macros
The other Microsoft Excel feature used throughout the TwsDde.xls spreadsheet is the macro. Every button on every page in the spreadsheet has a macro associated with it. You can see the macros used in the spreadsheet by viewing the list of macros, then clicking Edit to open the macro in the Visual Basic Editor to look at the actual code.
- In Excel 2010, click the View tab, then click the Macro button to see the list of macros used in the spreadsheet.
More Information
For more on the Excel DDE API, review the Getting Started with the Excel DDE API guide, available on our website. This guide walks you through the software setup and the common trading tasks that you can perform using the Excel DDE API sample application.
From the IB API web page, you can also access our release notes for the current production API release and the most recent Beta API release.
Direct Links
- API Reference Guide
- API Message Codes
- Getting Started with the TWS DDE for Excel API
- Getting Started with the TWS DDE for Excel API for Advisors
- DDE for Excel Tutorials – Requesting Real-Time Market Data
- DDE for Excel Tutorials – Requesting Historical Data
TWS API Bulletin Board
You can trade ideas and ask for help on the IB Bulletin Board, which is part of our website. To view or participate in the IB Discussion Forum, go to the Education menu and click Bulletin Boards | Launch Discussion Forums. Click TWS API thread. To participate in the discussion forum, create a userid and password in Account Management under Manage Account | Security | Voting Subscription.
Contact Our API Support Team
For any questions not answered today or that are beyond the scope of today’s Webinar, contact our API Support Team at: api@interactivebrokers.com
Disclosure
Options and Futures are not suitable for all investors. The amount you may lose may be greater than your initial investment. Before trading options read the «Characteristics and Risks of Standardized Options». Before trading futures, please read the CFTC Risk Disclosure. Security futures involve a high degree of risk and are not suitable for all investors. The amount you may lose may be greater than your initial investment. Before trading security futures, please read the Security Futures Risk Disclosure Statement. For a copy any of these disclosures, call (203) 618-5800. Any ticker symbols displayed are for illustrative purposes and do not portray recommendations.

Всем гуманитариям по диплому, но инженерам в душе, посвящается этот пост.
Ковырял на днях интернет в поисках готовых примеров по работе с API наиболее популярных сейчас криптобирж и наткнулся в гитхабе на работающий пример в Excel подгружающий с наиболее популярных криптобирж через API котировки по криптовалютам, а так же данные по личным кабинетам в случае необходимости.
Я знатный любитель экселя и всевозможных костылей, которые энтузиасты пишут на VBA. Понятно, что этот VBA был придуман для гумманитариев, которые радуются автоматизации протягивания экселевской таблички и к реальному программированию он относится… как учитель литературы к сопромату. Но конкретно этот пример очень хорош для тех, кому так или иначе требуется у себя в экселе иметь исторические данные с криптобирж.
Например мне такой функционал нужен для того чтобы просто и быстро подгружать инфу для расчёта показателей портфеля Романа.
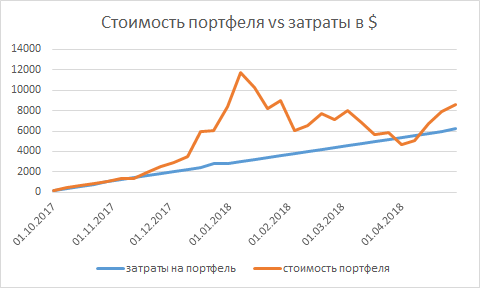
Читатели помнят, что я обычно выкладываю информацию о портфеле романа в таком виде.

Хотя безусловно интереснее смотреть сравнение рыночной стоимости портфеля и объема потраченного на портфель фиата в динамике. Мне было лень такое делать, потому что приходилось бы вручную подгружать данные по цене крипты при каждом формировании отчёта.
Вот для этого и нужен рабочий пример, который умеет подгружать нужную информацию. Но приведенный пример с гитхаба хорош тем, что не просто умеет подгружать данные откуда-то из интернета, он умеет подгружать данные через API непосредственно с криптобирж и преобразовывать получаемые JSON данные в удобные экселевские таблички.
Я переделал базовый файл под свои нужды с портфелем романа, для того чтобы зная объем портфеля в монетах на каждую дату истории считался вот такой график рыночной стоимости портфеля.
Мой пример можно скачать отсюда. Но в моем примере используется только одна функция, для изучения всех возможностей лучше использовать пример непосредственно с гитхаба, ссылку на который я давал выше.
Из интересных особенностей представленного кода можно выделить возможность авторизации на бирже с использованием индивидуальных api-ключей и выгрузку информации об истории транзакций. То есть при не хитрой доработки вполне можно реализовать торговлю на криптобиржах через эксель. То еще извращенство, но с точки зрения спортивного интереса, выглядит эта идея весьма заманчиво.
В примере с гитахаба реализован код, который позволяет подключаться по api через эксель к следующим криптобиржам:
- Kraken
- Poloniex
- Bittrex
- Liqui
- WEXnz
- Coinone
- Cryptopia
- Binance
- Kucoin
- HitBTC
- Coinigy
- Coinspot
- GDAX
- Bitfinex