
Text analysis is a machine learning technique used to automatically extract valuable insights from unstructured text data. Companies use text analysis tools to quickly digest online data and documents, and transform them into actionable insights. We can use text analysis to extract specific information like keywords, names, or company-oriented information from thousands of details, or categorize survey responses by analyzing the text.
Automated Text Analysis in Excel
AI in Excel can be used for automated text analysis by utilizing its built-in functions, macros, and add-ins that allow you to automate repetitive tasks and perform advanced text analysis.
Example
Good service: I ordered a brand new laptop from online store. It’s really a awesome product with good condition.
Thank you for this wonderful service.
Some Text Analysis Techniques:
- Text classification
- Text extraction
- Word Frequency
- Clustering
Steps to be followed in Excel for Automated Text Analysis
Step 1: Open the Excel spreadsheet and proceed with Azure machine learning add-ins. Add-ins such as text analytics for excel provide advanced text analysis capabilities such as sentiment analysis, key phrase extraction, and language detection. These can be used to automatically extract insights from large amounts of text data, such as identifying positive or negative sentiments in customer reviews or extracting key topics from a collection of documents.

Click on the Get Add-ins tab.

Additionally, Excel can also be integrated with other AI services such as Azure cognitive services or AWS comprehend to perform more advanced text analysis tasks such as entity recognition, language translation, and machine learning-based text classification.

Step 2: After installing the Azure Machine Learning add-ins it’s time to prepare your text data by cleaning and transforming it in Excel. This may include removing unnecessary columns, removing duplicates, and standardizing the format of the text data.

Step 3: Now apply the web services to the cells to apply text sentiment analysis. Azure Machine Learning add-ins for Excel are a set of Excel add-ins that allow users to build, deploy, and manage machine learning models within the Excel interface. These add-ins provide a user-friendly way to access Azure Machine Learning’s capabilities and can be used to create predictive models, deploy them as web services, and consume them in Excel.

Below, we can see that the text analysis is done.

Overall, Automated text analysis in Excel can greatly reduce the time and effort required to manually analyze large amounts of text data and help to extract insights more efficiently.
IMPORTANT: Ideas in Excel is now Analyze Data
To better represent how Ideas makes data analysis simpler, faster and more intuitive, the feature has been renamed to Analyze Data. The experience and functionality is the same and still aligns to the same privacy and licensing regulations. If you’re on Semi-Annual Enterprise Channel, you may still see «Ideas» until Excel has been updated.

Analyze Data in Excel empowers you to understand your data through natural language queries that allow you to ask questions about your data without having to write complicated formulas. In addition, Analyze Data provides high-level visual summaries, trends, and patterns.
Have a question? We can answer it!
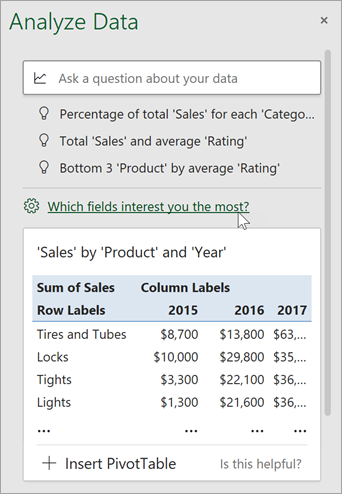
Simply select a cell in a data range > select the Analyze Data button on the Home tab. Analyze Data in Excel will analyze your data, and return interesting visuals about it in a task pane.
If you’re interested in more specific information, you can enter a question in the query box at the top of the pane, and press Enter. Analyze Data will provide answers with visuals such as tables, charts or PivotTables that can then be inserted into the workbook.
If you are interested in exploring your data, or just want to know what is possible, Analyze Data also provides personalized suggested questions which you can access by selecting on the query box.
Try Suggested Questions
Just ask your question
Select the text box at the top of the Analyze Data pane, and you’ll see a list of suggestions based on your data.

You can also enter a specific question about your data.

Notes:
-
Analyze Data is available to Microsoft 365 subscribers in English, French, Spanish, German, Simplified Chinese, and Japanese. If you are a Microsoft 365 subscriber, make sure you have the latest version of Office. To learn more about the different update channels for Office, see: Overview of update channels for Microsoft 365 apps.
-
The Natural Language Queries functionality in Analyze Data is being made available to customers on a gradual basis. It may not be available in all countries or regions at this time.
Get specific with Analyze Data
If you do not have a question in mind, in addition to Natural Language, Analyze Data analyzes and provides high-level visual summaries, trends, and patterns.
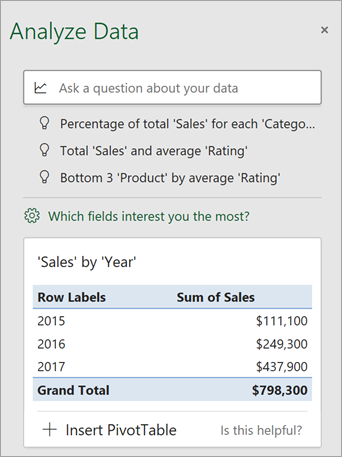
You can save time and get a more focused analysis by selecting only the fields you want to see. When you choose fields and how to summarize them, Analyze Data excludes other available data — speeding up the process and presenting fewer, more targeted suggestions. For example, you might only want to see the sum of sales by year. Or you could ask Analyze Data to display average sales by year.
Select Which fields interest you the most?
Select the fields and how to summarize their data.
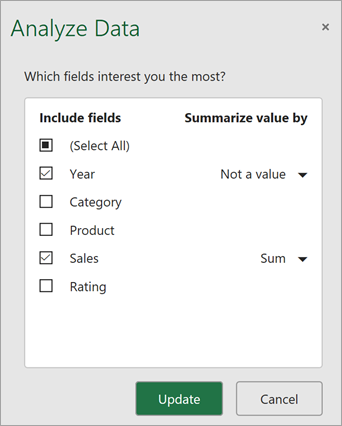
Analyze Data offers fewer, more targeted suggestions.
Note: The Not a value option in the field list refers to fields that are not normally summed or averaged. For example, you wouldn’t sum the years displayed, but you might sum the values of the years displayed. If used with another field that is summed or averaged, Not a value works like a row label, but if used by itself, Not a value counts unique values of the selected field.
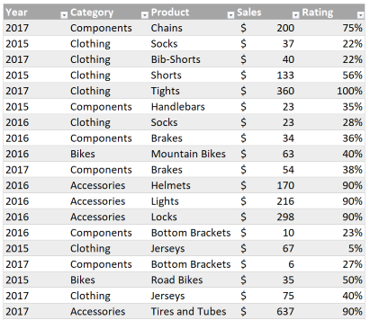
Analyze Data works best with clean, tabular data.
Here are some tips for getting the most out of Analyze Data:
-
Analyze Data works best with data that’s formatted as an Excel table. To create an Excel table, click anywhere in your data and then press Ctrl+T.
-
Make sure you have good headers for the columns. Headers should be a single row of unique, non-blank labels for each column. Avoid double rows of headers, merged cells, etc.
-
If you have complicated, or nested data, you can use Power Query to convert tables with cross-tabs, or multiple rows of headers.
Didn’t get Analyze Data? It’s probably us, not you.
Here are some reasons why Analyze Data may not work on your data:
-
Analyze Data doesn’t currently support analyzing datasets over 1.5 million cells. There is currently no workaround for this. In the meantime, you can filter your data, then copy it to another location to run Analyze Data on it.
-
String dates like «2017-01-01» will be analyzed as if they are text strings. As a workaround, create a new column that uses the DATE or DATEVALUE functions, and format it as a date.
-
Analyze Data won’t work when Excel is in compatibility mode (i.e. when the file is in .xls format). In the meantime, save your file as an .xlsx, .xlsm, or .xlsb file.
-
Merged cells can also be hard to understand. If you’re trying to center data, like a report header, then as a workaround, remove all merged cells, then format the cells using Center Across Selection. Press Ctrl+1, then go to Alignment > Horizontal > Center Across Selection.
Analyze Data works best with clean, tabular data.
Here are some tips for getting the most out of Analyze Data:
-
Analyze Data works best with data that’s formatted as an Excel table. To create an Excel table, click anywhere in your data and then press
 +T.
+T. -
Make sure you have good headers for the columns. Headers should be a single row of unique, non-blank labels for each column. Avoid double rows of headers, merged cells, etc.
 +T.
+T.Didn’t get Analyze Data? It’s probably us, not you.
Here are some reasons why Analyze Data may not work on your data:
-
Analyze Data doesn’t currently support analyzing datasets over 1.5 million cells. There is currently no workaround for this. In the meantime, you can filter your data, then copy it to another location to run Analyze Data on it.
-
String dates like «2017-01-01» will be analyzed as if they are text strings. As a workaround, create a new column that uses the DATE or DATEVALUE functions, and format it as a date.
-
Analyze Data can’t analyze data when Excel is in compatibility mode (i.e. when the file is in .xls format). In the meantime, save your file as an .xlsx, .xlsm, or xslb file.
-
Merged cells can also be hard to understand. If you’re trying to center data, like a report header, then as a workaround, remove all merged cells, then format the cells using Center Across Selection. Press Ctrl+1, then go to Alignment > Horizontal > Center Across Selection.
Analyze Data works best with clean, tabular data.
Here are some tips for getting the most out of Analyze Data:
-
Analyze Data works best with data that’s formatted as an Excel table. To create an Excel table, click anywhere in your data and then click Home > Tables > Format as Table.
-
Make sure you have good headers for the columns. Headers should be a single row of unique, non-blank labels for each column. Avoid double rows of headers, merged cells, etc.
Didn’t get Analyze Data? It’s probably us, not you.
Here are some reasons why Analyze Data may not work on your data:
-
Analyze Data doesn’t currently support analyzing datasets over 1.5 million cells. There is currently no workaround for this. In the meantime, you can filter your data, then copy it to another location to run Analyze Data on it.
-
String dates like «2017-01-01» will be analyzed as if they are text strings. As a workaround, create a new column that uses the DATE or DATEVALUE functions, and format it as a date.
We’re always improving Analyze Data
Even if you don’t have any of the above conditions, we may not find a recommendation. That’s because we are looking for a specific set of insight classes, and the service doesn’t always find something. We are continually working to expand the analysis types that the service supports.
Here is the current list that is available:
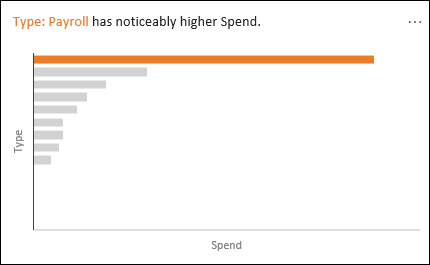
-
Rank: Ranks and highlights the item that is significantly larger than the rest of the items.
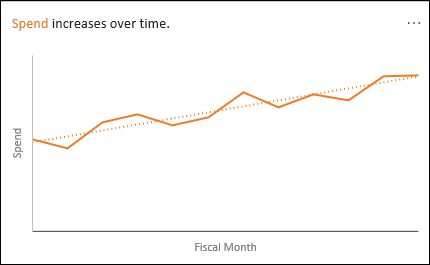
-
Trend: Highlights when there is a steady trend pattern over a time series of data.
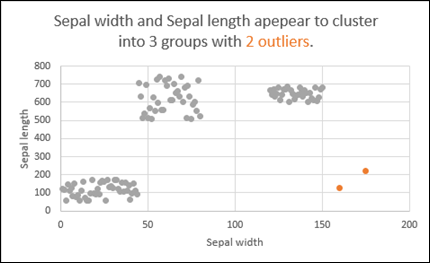
-
Outlier: Highlights outliers in time series.
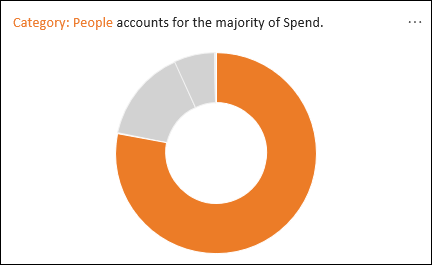
-
Majority: Finds cases where a majority of a total value can be attributed to a single factor.
If you don’t get any results, please send us feedback by going to File > Feedback.
Because Analyze Data analyzes your data with artificial intelligence services, you might be concerned about your data security. You can read the Microsoft privacy statement for more details.
Need more help?
You can always ask an expert in the Excel Tech Community or get support in the Answers community.
Incorporate advanced NLP, Machine Learning services into your daily work tool, no programming required!
Use it as a Real-Time Social Media Monitoring Tool for Twitter and Facebook data!
Simple steps
- Download and install FREE Add-In*
Excel Add-In 64 bit
[Excel 2010-2019 x64]
Excel Add-In 32 bit
[Excel 2010-2019 x86]
If your Excel analysis pane won’t open, please follow these steps
* unzip and run setup.exe
Current version [4.1.0] last update 2022-11-14
Windows only
- Create free account and get your API key,
- Start analysing data from Twitter, Facebook, Surveys… directly in Excel!
* requires Excel (64-bit/ 32-bit) 2010-2019
Quick videos
Excel Add-In
|
Social media
|
We all know how good Power Query is for cleaning, shaping and analyzing numerical data. But this powerful tool opens doors for analysts that had been closed for long time, such as for analyzing text. In this article, I will give you some ideas how Power Query can be used for analyzing text that is unstructured. This is a new area for me as well so I’ll be grateful for any comments, thoughts, ideas and shared experience that will help to elaborate further on the methodology.
Our scenario
First, let’s put things in a context with simple but realistic example. Assume you are the newly appointed Marketing Manager of a 4-star SPA hotel. You want to analyze reviews about the hotel in sites like booking.com and tripadvisor.com to understand the major service issues. Thanks to Power Query, you will be able to extract, clean and shape data from those sites to receive a nice table like this:
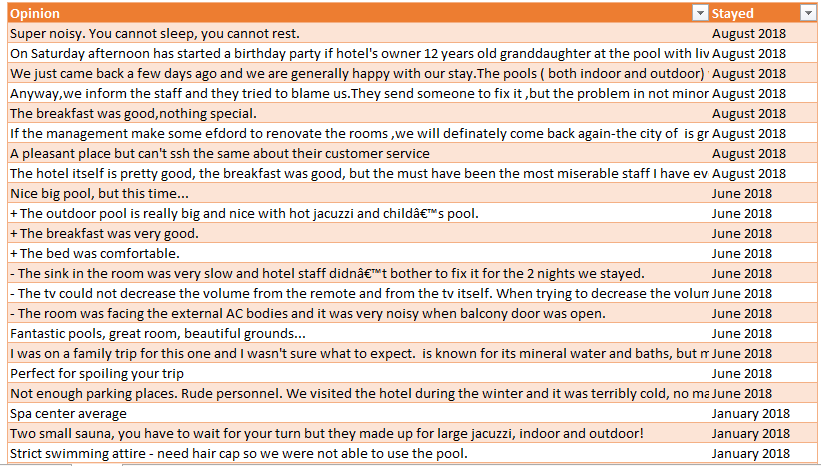
* Table contains ~300 real opinions for several Bulgarian SPA hotels in Hissarya, Velingrad, Sandanski and Bansko. Source: booking.com and tripadvisor.com
But how can you get some insights from this data? Obviously you will spend lots of time to read all reviews. Even if you do that, you need to summarize the information somehow. So let’s play a little within Power Query and see how it can help us analyze text.
Preparing data for analysis
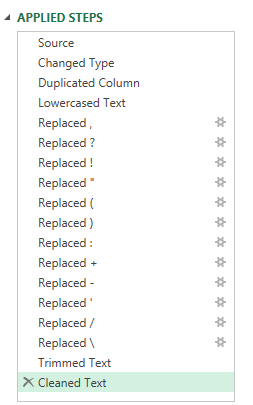
First, we load the table in Power Query (From Table) and clean it of punctuation symbols like commas, semicolons, dashes, brackets, etc., as well as replace capital letters with lower cased one. Why do that last one? Because we want to count the most frequently used words and for Power Query ‘hotel’, ‘hotel,’, ‘Hotel’ are different words.
The cleaning can easily be done with tools like Replace Values, Trim, and Lowercase. I believe they are well-known to average user of Power Query so will I skip detailed operations. Instead, here some lessons learnt from practice:
- First, duplicate the Opinions column so you can have original text.
- Then, replace all punctuation symbols with a space.
- Later we will use a period a separator to split opinions into sentences. And since a sentence can finish with exclamation mark or a question mark it is useful to replace ‘!’ and ‘?’ with ‘.’
- Since this is a hotel, clients may use the symbol ‘*’ in their opinions (i.e. ‘nice 4* hotel’ or ‘definitely not a 4* hotel’). So don’t replace this symbol.
Above points are nice examples that when analyzing text or other data you need to do it in a context and should explore it first, but that is another story.
Here are the steps applied so far. As a final touch the text has been trimmed and cleaned.
Separating each comment
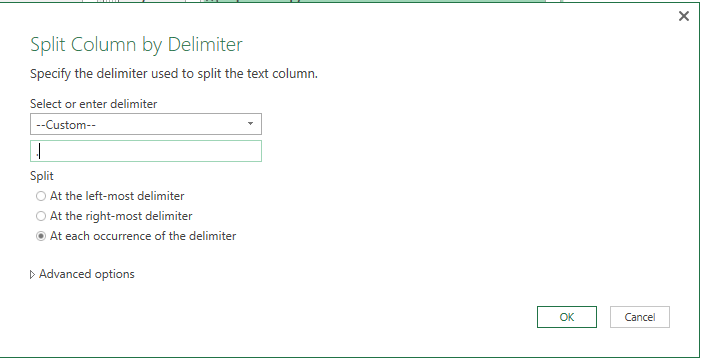
Our next step is to split the column using a period (‘.’) as a delimiter, and doing so at each occurrence of the delimiter.
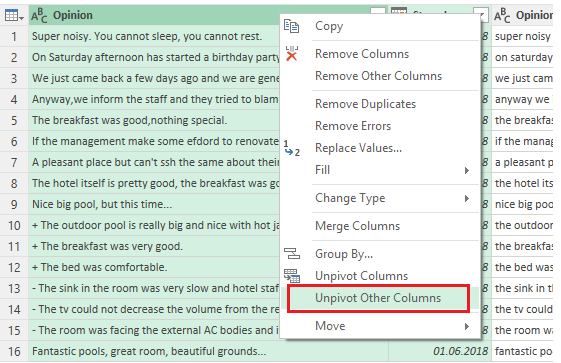
Power Query creates a number of new columns, each one containing a sentence. I bet you are guessing what will follow. That’s right – select the original two columns and choose Unpivot Other Columns.
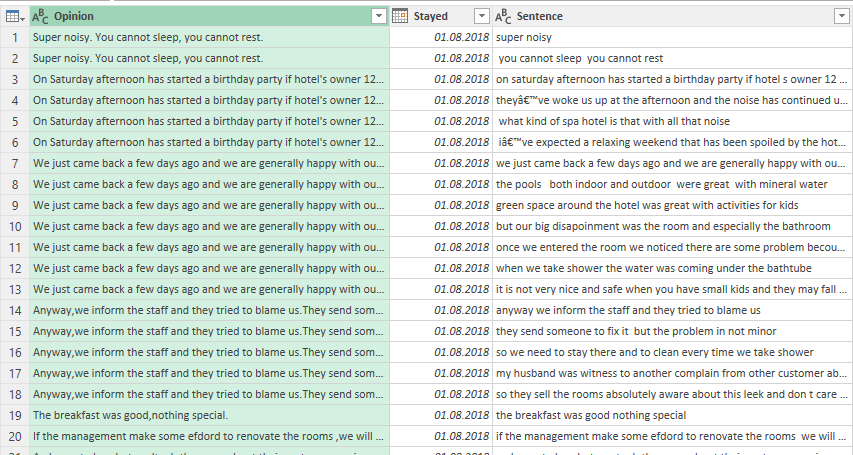
After removing the Attribute column and filtering out rows that are blank, our table has a column for the original comments (Opinion) and a column for each sentence contained in the original comments (Sentence). Please be patient here, and you will understand why this is important.
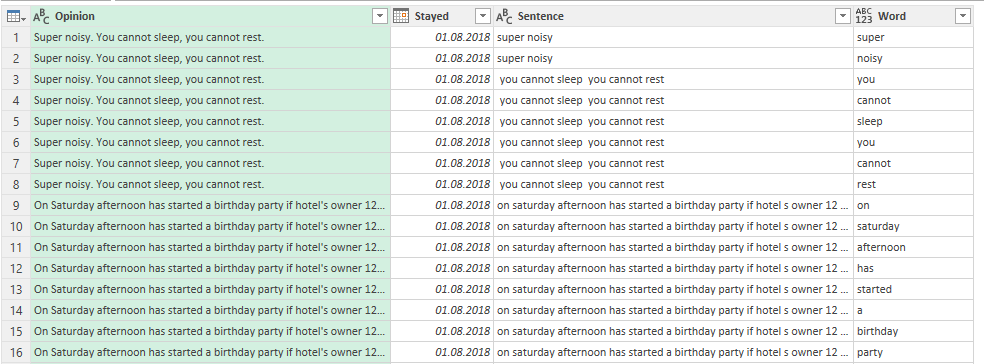
Let’s now duplicate the Sentence columns and repeat the above actions: split each sentence into its individual words, then unpivot. Below is the table after removing the Attribute column and filtering out blank rows:
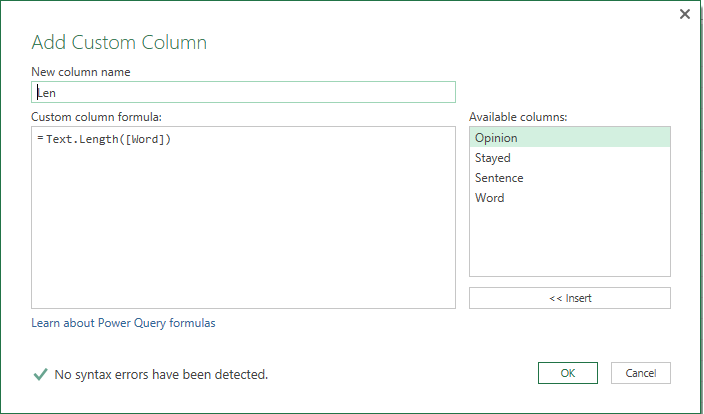
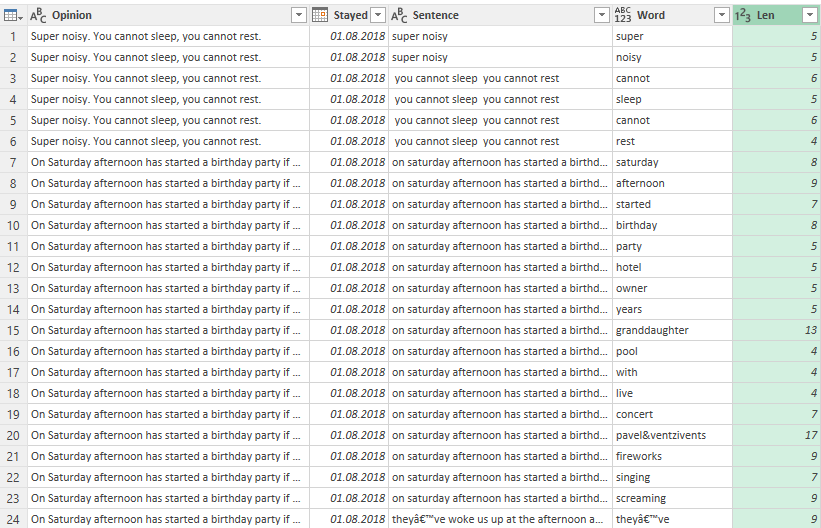
As a next step I will add custom column with a simple formula that calculates the length of each word. We can use it to remove common words that bring no value to our analysis – ‘a’, ‘the’, ‘is’, ‘or’, ‘but’ etc.
Finally, filter to exclude words that are 1, 2 or 3 letters long. We will use the resulting table as the basis for analyzing text.
Finding Lookup words
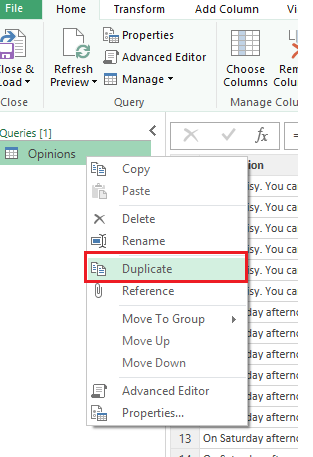
As a first step in analyzing text, let’s Duplicate the query (you may use Reference as well).
In the new Query, simply use the Group By function on the Words column to count the rows.
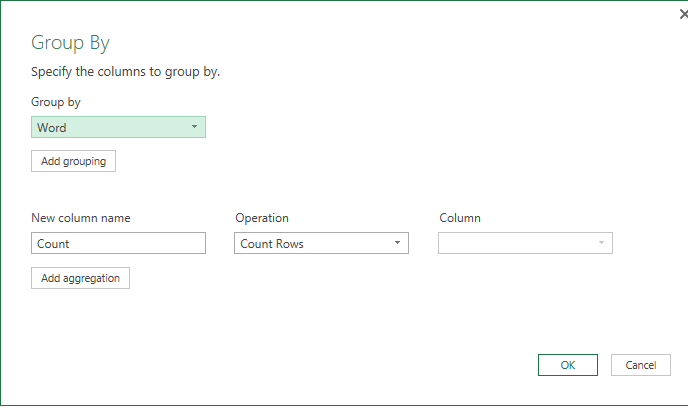
Thus, we will have a list with all words (above 3 letters long) and how many times they have been used. For convenience, we can sort this and then load it into Excel.
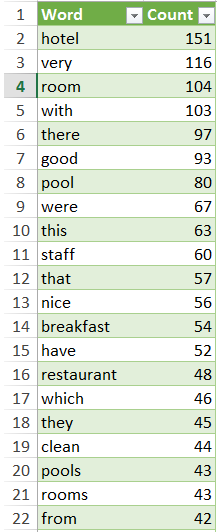
Let’s take a look at the list. Obviously it contains words like ‘with’, ‘this’, ‘have’ that we need to ignore because they could be used in many different situations. On the other hand we see ‘good’ and ‘nice’ in the top 20. Those words are highly subjective – what is good for me might not be good for you. Besides, we don’t know whether the reviewer said ‘good food and nice service’ or ‘the food was not good and service far from nice’. So let’s skip them for now.
Apart from the above, we see that customers mention most often words like ‘room’, ‘pool’, staff’, ‘food’. These are our words of interest (I call them ‘Lookup words’). We may now filter all sentences that contain these words, allowing us to read much less information compared to original list of opinions.
Honestly speaking, if you have enough experience or even some common sense, you can skip this step. I mean it is more than expected that ‘room’, ‘staff’ and ‘pool’ are most often mentioned in reviews for a SPA hotel. However, identifying lookup words might be needed for cases like analyzing text of more open-ended questions.
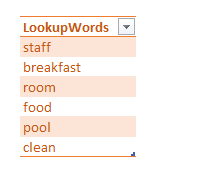
Filtering Lookup words
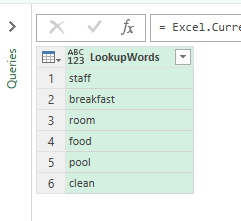
So far we have identified our words of interest and listed them in a table:
So how do we filter all sentences containing these lookup words? We can make it dynamic by creating a custom function. The process is similar to one used to load data from multiple internet pages, as described in M is for (Data) Monkey.
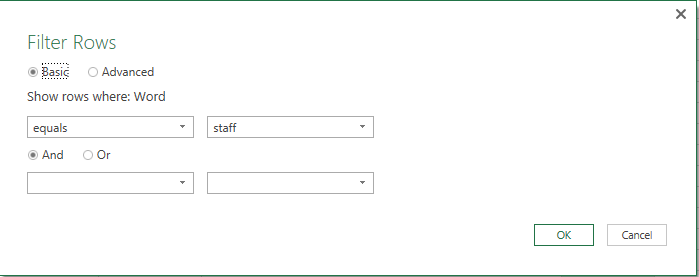
First, we create a query to Filter Rows of the Word column that contain one of our lookup words, ‘staff’ for example.
Then we go to Home > Advance Editor and change the M code a bit as shown below:
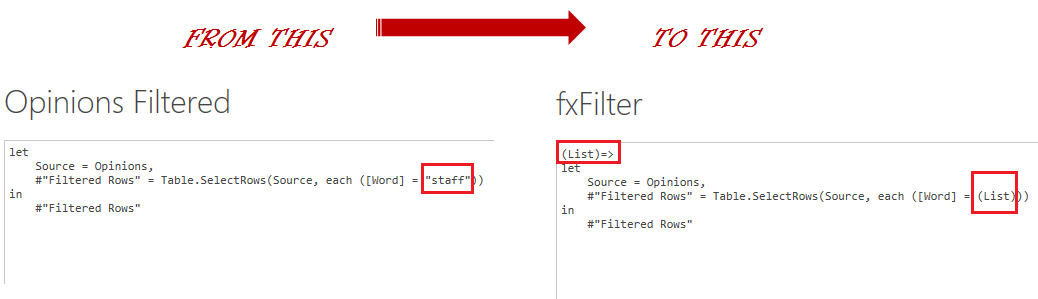
After we create the function, we rename it as something more user-friendly (I used fxFilter).
Then we load our LookupWords table into Power Query (From Table):
Next, we Add Custom Column. (Note: in Excel 2016, you have to Invoke Custom Function.)
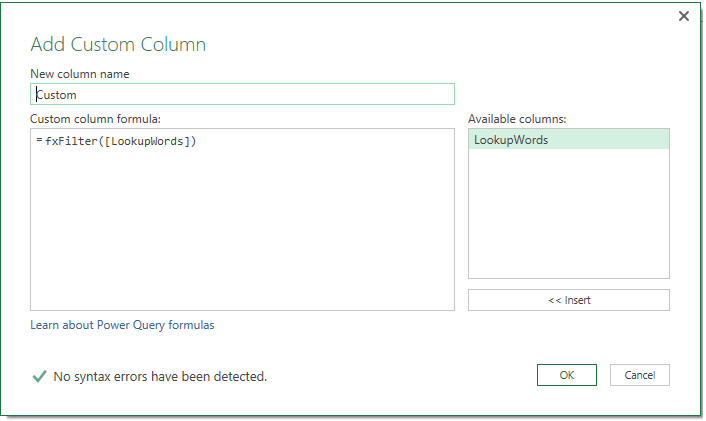
And when we expand the table, we get all rows that contain the words from our lookup list.
Identifying Connected words
We now need to split the Sentence column again to identify the words that were most often used in sentences containing our Lookup words. I call these words ‘Connected words’.
There are some final steps such as eliminating words that appear rarely (i.e. less than 5 times), removing duplicate rows, rearranging columns etc. that I will skip.
Our final table is on the left below:
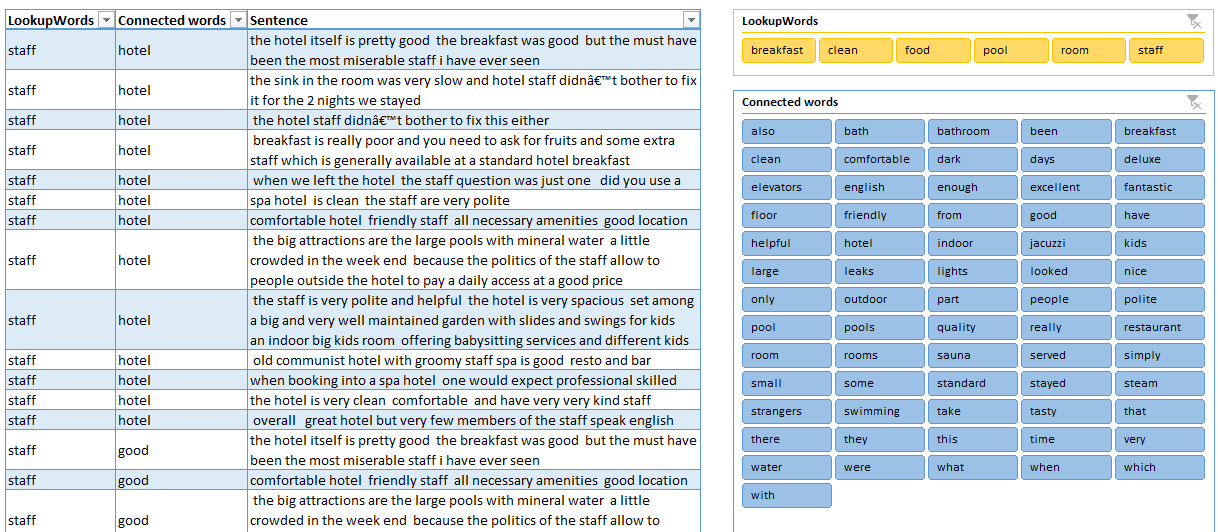
Analyzing text
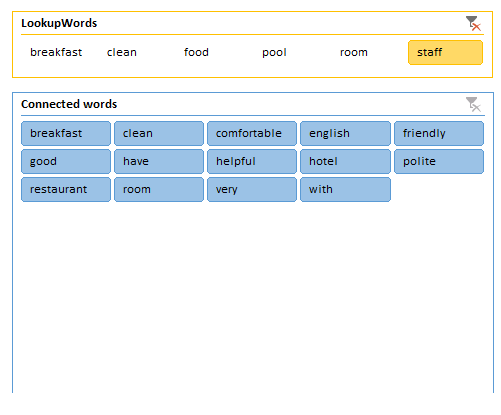
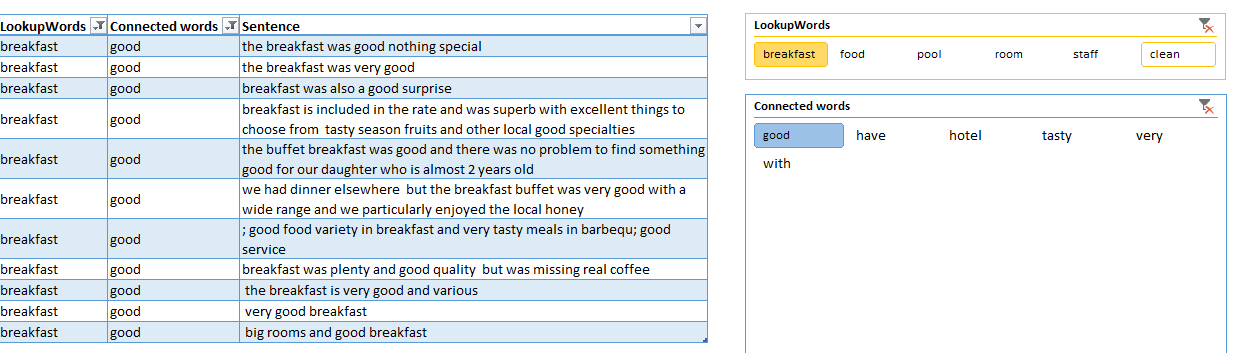
As you see, I added two slicers to our table — one for our Lookup words and one for our Connected words. By using them in combination, we can get more insights quite easily. For example, these are the words used most frequently together with ‘staff’:
Here, I have filtered for the Connected word ‘friendly’, which gives us just 10 rows to read:
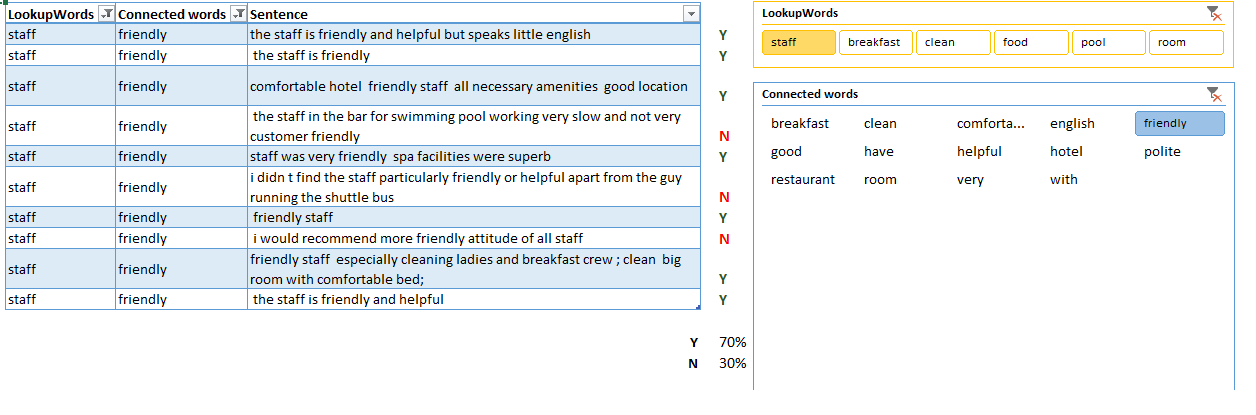
In a separate column, we can manually type “Y” for each positive opinion and “N” for each negative. Now we can calculate that 30% of mentions are actually negative. This is a simple way to quantify and measure our data. And it takes just few minutes to find out that the picture is similar with ‘helpful’ and ‘polite’ – positive feedback is prevailing.
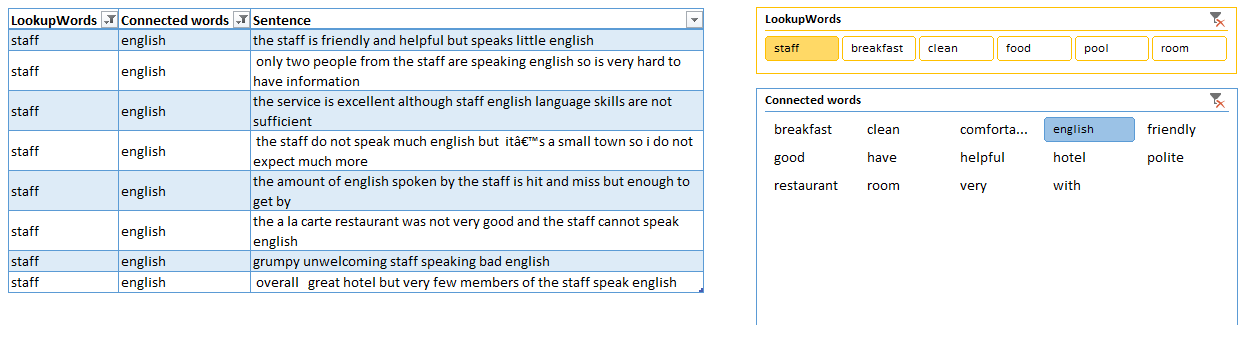
When we filter ‘English’ it is easy to see that 8 people mentioned staff speaks no or poor English. That directly calls for some action — we need to train our staff in English. If you were reading through 300 opinions, you might miss this quite easily.
It takes just few clicks and couple of minutes or reading to find out that clients are happy with the breakfast:
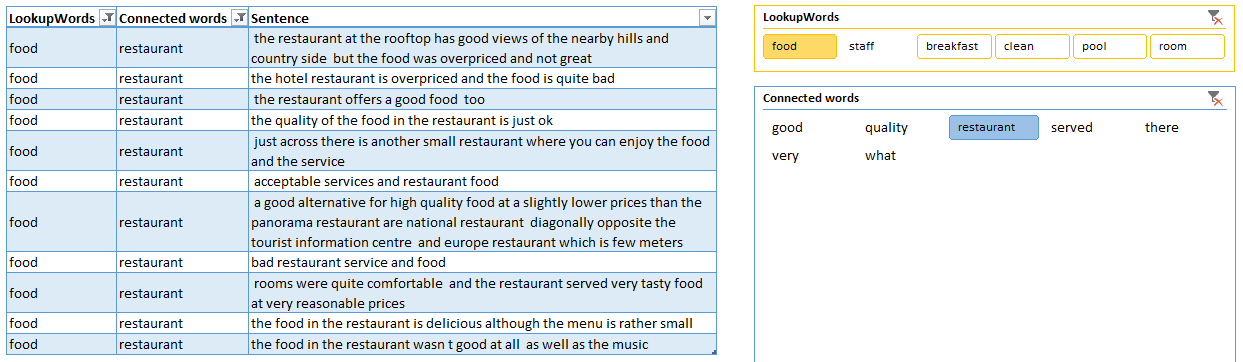
But are disappointed by the prices and quality of food in the restaurant:
Of course this is just a starting point and each of the above observations needs further investigation and analysis. But the key takeaway here is that we can successfully use Power Query to summarize unstructured text data. We can then focus our attention on sentences that contain the most commonly used words instead of reading the whole bunch of reviews.
Applying the technique
Many other ideas come up into my mind of how we can use this for further analyzing text data. We can use the Stayed column to study trends in time, we can quantify some key words (as shown with ‘friendly’) or make a word cloud showing our top 20 words. What are your ideas — how can we use Power Query and Excel to analyse unstructured text?
Last month, we launched an Excel add-in, a solution for using ParallelDots NLP APIs to do text analysis on unstructured data without… 
Last month, we launched an Excel add-in, a solution for using ParallelDots NLP APIs to do text analysis on unstructured data without writing a single line of code. The Excel add-in is very easy to use and provides a convenient, yet effective solution for your text analysis needs. In an earlier post, we provided you with detailed information of how the excel add-in works. In this post, we will discuss some real-world use cases where you can use the Excel Add-in to raise your analytics game without spending a fortune on building a data science team.
Text analysis on product reviews from E-commerce sites, Facebook Pages and other review sites
You can analyze a corpus of customer reviews to understand the general impression about your product. The Excel add-in works on ParallelDots AI APIs, which are being used extensively by developers and enterprises to empower their analytics since the last two years.

Furthermore, you can run keyword analysis on positive and negative sentiment sentences to discover why people like or dislike your product. Such an analysis will enable you to understand the key phrases contributing to the overall sentiment around your product. For example, a phone manufacturer company can analyze reviews from e-commerce sites, social media, and tech review blogs for their models. They can then extract keywords for both positive and negative sentiment sentences to find which features (screen, battery life, camera, storage, etc.) users liked or disliked about a particular phone model.
Additionally, you can go a level deeper by analyzing the intent of the product reviews and categorize them to identify whether the review counts as the feedback, opinion, query or spam. This will help in filtering essential reviews and replying/acting on them faster.
The analyzed data, i.e. sentiment, keywords and intent, can be correlated with your internal business metrics such as marketing spends, sales data etc. to find actionable insights.
Analyse open-ended user feedback from surveys
Open-ended feedback forms have proven to be more useful than close-ended ones (Folks at our market research division, Karna AI, have written a extensive blog on analyzing open-ended user surveys. You can read it here) but analyzing them can be very time-consuming and expensive task.
Our Excel Add-in is a lifesaver when it comes to analyzing open-ended surveys. Once you have exported all the survey responses in xlsx or csv format and installed the add-in, you can start analyzing the responses straight away without writing a single line of code. The Excel add-in makes it simple for anyone and everyone to perform AI-powered text analysis.

Methodology can be same as the one mentioned in the product reviews analysis, and you can incorporate entity extraction function along with keyword analysis to discover broader entities (product name, person name etc.) talked about in the surveys.
Text Analysis for financial content
Financial data such as earnings call, news articles, transcripts etc. contain lot of rich information which can form basis for your fundamental investment and financial research. The BFSI sector is heavily equipped with textual data.

Since excel remains an integral part of any financial analyst’s toolkit, this Excel add-in can help to correlate many of the structured data points found in financial documents (balance sheets, trading history, P&L statements) with those found in unstructured financial documents.
Analyzing social media content from your social listening tool
While social listening tools do a good job of tracking every conversation about your brand or product on the internet, building good text analytics capability is only considered as an afterthought in most of these tools. The data from such social listening tools analyzed by a powerful text analytics tool like ParallelDots Excel add-in can provide a good overview of your social presence.

Further, listening tools that do provide good text analytics capabilities can be an expensive tool to use when compared to the Excel add-in like ParallelDots.
These listening tools give a very convenient option to export all the conversations in csv format. You can then analyze these conversations similar to product reviews to get actionable insights such as sentiment attached to the conversation, keywords and key-phrases mentioned, emotions detected in the conversation, entities mentioned, etc.
Empowering business analysts to carry out text analysis on unstructured datasets
Business analysts capture, analyze and document business needs and changes. A business analyst is usually equipped with huge textual corpus from different domains such as market research, financial data, historical viewpoints, etc.

ParallelDots Excel Add-in can help analysts up their game since excel is heavily used in analyzing the data points in this sector. Business analysts can process the information faster using multiple functions from the ParallelDots Excel Add-in. They can gather relevant insights such as extracting the entities, categorizing products, services or markets based on sentiment and classifying text based on the IAB categories etc.
The use cases of ParallelDots Excel add-in are not limited to the ones mentioned above. Essentially, you can use the add-in whenever you require to process a large corpus of unstructured textual data, just download the add-in, sign up for your unique API key and start analyzing your content. Functionality info here.
Original Source.